
 Open Access Article
 This Open Access Article is licensed under a Creative Commons Attribution-Non Commercial 3.0 Unported Licence
Metal oxide/CeO2 nanocomposites derived from Ce-benzene tricarboxylate (Ce-BTC) adsorbing with metal acetylacetonate complexes for catalytic oxidation of carbon monoxide†
Dongren Cai *,
Bin Chen,
Zhongliang Huang,
Xiaoli Zeng,
Jingran Xiao,
Shu-Feng Zhou and
Guowu Zhan*
*,
Bin Chen,
Zhongliang Huang,
Xiaoli Zeng,
Jingran Xiao,
Shu-Feng Zhou and
Guowu Zhan*
College of Chemical Engineering, Huaqiao University, 668 Jimei Blvd, Xiamen, Fujian 361021, P. R. China. E-mail: 15506@hqu.edu.cn; gwzhan@hqu.edu.cn
First published on 14th June 2021
Abstract
Herein, a series of metal oxide/CeO2 (M/CeO2) nanocomposites derived from Ce-benzene tricarboxylate (Ce-BTC) adsorbing with different metal acetylacetonate complexes were prepared for CO oxidation under four different CO gas atmospheres. It was demonstrated that Cu/CeO2 exhibited the highest catalytic activity and stability in CO oxidation. Remarkably, both O2 selectivity and CO selectivity to CO2 are 100% in most of the investigated conditions. Several analytical tools such as N2 adsorption–desorption and powder X-ray diffraction, were employed to characterize the prepared catalysts. In addition, the excellent catalytic performance of Cu/CeO2 in CO oxidation was revealed by H2 temperature-program reduction experiment, X-ray photoelectron spectroscopy, and in situ diffuse reflectance infrared Fourier transform spectroscopy. The result showed that high oxygen vacancy and high CO adsorption capacity (Cu+–CO) caused by the electron exchanges of Cu2+/Cu+ and Ce3+/Ce4+ pairs (Ce4+ + Cu+ ⇆ Ce3+ + Cu2+) are two key factors contributing to the high oxidation performance of Cu/CeO2 catalyst.
1. Introduction
The removal of trace carbon monoxide (CO) from the bulk gas has become the key step for the development of clean energy (like fuel cells that utilize reformate gas as the fuel), and environmental protection (like treatment of automobile exhaust gas) in recent years.1–3 One of the most effective methods to remove CO from the bulk gas is the catalytic oxidation of CO, which converts CO to carbon dioxide (CO2) directly.1,4,5 Compared to other methods (like water–gas shift reaction), this technique offers various benefits of low cost, ease of implementation, and thorough removal of CO.6 To complete the process of CO oxidation, preparing a highly active and stable catalyst is of vital importance.7,8Up to now, the potential catalysts for CO oxidation have been mainly concentrated on the noble metal (Ag, Au, Pt, etc.)/metal oxide (support) and metal oxide (active component)/metal oxide (support) (Co3O4/Al2O3, CuO/CeO2, etc.).9–12 The noble metal always has an excellent performance in CO oxidation, but the high cost and low availability hinder the wide applications. Therefore, more attention has shifted to the metal oxide (active component)/metal oxide (support). The metal oxide (active component)/metal oxide (support) are usually synthesized by impregnation, co-precipitation, deposition, sol–gel, etc. Although the catalyst forming can be effectively controlled, the dispersion of metal sites in the whole catalyst is poor, resulting in the sintering and deactivation easily during the reaction.13,14 As a result, the uniform dispersion of metal sites is essential to catalyst design for CO oxidation.
Metal–organic frameworks (MOFs) are organic–inorganic hybrid materials formed by self-assembly of metal ions (or clusters) and organic ligands through coordination bonds, which have been applied in gas separation, gas storage, drug delivery, and even catalysis in recent years.15–17 What more noteworthy is that MOFs can be used as a sacrificial template or precursor for the preparation of other porous materials (metal oxide, metal oxide/metal oxide, and so forth) via thermal decomposition because of their unique structure and textural property.18,19 In general, the derived metal oxides maintain the original morphology of MOFs, and own a large specific surface area and pore volume. Furthermore, the uncoordinated organic sites (like carboxyl, –COOH) on MOFs have strong adsorption capacity for transition metal ions, which can make the transition metal (M) uniformly enrich in MOFs, forming precursor M/MOFs. The direct calcination of M/MOFs would lead to the formation of the multicomponent metal oxides, which can be used as an excellent catalyst for CO oxidation.
Interestingly, the transition metal acetylacetonates (M(acac)x) have been proved to be a good precursor for element doping.20–22 For example, based on the hydrogen bonding interaction and ligand exchange mechanism, Kuśtrowski et al. successfully loaded Cu(acac)2, Fe(acac)3, and Cr(acac)3 on siliceous support.21 The research conducted by Vital et al. also revealed that M(acac)x can be immobilized on amino-functionalized active carbon support.22 In view of this situation, the M(acac)x can be used as the precursor of the active component to be doped into MOFs for improving the dispersion. Not only the active component but also the support plays an important part in determining the catalytic activity due to the effects of surface area, active component dispersion, and interactions with active component.1 Cerium dioxide (CeO2) is considered as excellent support for CO oxidation due to the huge oxygen storage and good redox ability. Besides, CeO2 can improve the dispersion of the active metal components via the metal–support interface, which also enhances the anti-sintering ability of the metals.23–25 Therefore, CeO2 derived from Ce-MOF (like Ce-BTC) would be highly desirable support material for CO oxidation.
Based on the above statements, herein, we prepared a variety of M/CeO2 (multicomponent metal oxides) by using Ce-BTC adsorbing with metal acetylacetonate complexes as precursors. The catalytic performances of prepared M/CeO2 were evaluated in CO oxidation under four different gas atmospheres (e.g., dry, wet, H2-rich, and wet + H2-rich conditions). The prepared M/CeO2 were characterized by N2 adsorption–desorption, powder X-ray diffraction (XRD), inductively couple plasma-optical emission spectrometry (ICP-OES), thermogravimetric analysis (TGA), scanning electron microscopy (SEM), transmission electron microscopy (TEM), high-resolution transmission electron microscopy (HRTEM), and X-ray photoelectron spectroscopy (XPS). The interactions of active components and support were revealed by H2 temperature-program reduction experiments (H2-TPR). Besides, in situ diffuse reflectance infrared Fourier transform spectroscopy (DRIFTS) was used to reveal the reaction process of CO oxidation over M/CeO2 catalysts.
2. Experimental section
2.1 Chemicals
The chemicals used in this study were as follows: cerium nitrate hexahydrate (Ce(NO3)3·6H2O, 99.99%, Admas), trimesic acid (H3-BTC, C9H6O6, 99%, Admas), polyvinylpyrrolidone (PVP, MW: 50![[thin space (1/6-em)]](https://www.rsc.org/images/entities/char_2009.gif) 000–60000, Admas), ethanol (CH3CH2OH, 99.5%, Guoyao), N,N-dimethylformamide (DMF, HCON(CH3)2, 99.5%, Aladdin), cupric(II) acetylacetonate (Cu(acac)2, C10H14O4Cu, 98%, Admas), nickel(II) acetylacetonate (Ni(acac)2, C10H14O4Ni, 98%, Admas), cobalt(II) acetylacetonate (Co(acac)2, C10H14O4Co, 99%, Admas), iron(III) acetylacetonate (Fe(acac)3, C15H21O6Fe, 98%, Admas), copper nitrate trihydrate (Cu(NO3)2·3H2O, 99%, Aladdin), sodium hydroxide (NaOH, 98%, Aladdin) and deionized water (H2O). All of the chemicals were used without purification.
000–60000, Admas), ethanol (CH3CH2OH, 99.5%, Guoyao), N,N-dimethylformamide (DMF, HCON(CH3)2, 99.5%, Aladdin), cupric(II) acetylacetonate (Cu(acac)2, C10H14O4Cu, 98%, Admas), nickel(II) acetylacetonate (Ni(acac)2, C10H14O4Ni, 98%, Admas), cobalt(II) acetylacetonate (Co(acac)2, C10H14O4Co, 99%, Admas), iron(III) acetylacetonate (Fe(acac)3, C15H21O6Fe, 98%, Admas), copper nitrate trihydrate (Cu(NO3)2·3H2O, 99%, Aladdin), sodium hydroxide (NaOH, 98%, Aladdin) and deionized water (H2O). All of the chemicals were used without purification.
2.2 The synthesis of M/CeO2
M/CeO2 was synthesized via a three-step method, as shown in Fig. 1. In step I, firstly, 0.05 g of PVP, 2.17 g of Ce(NO3)3·6H2O, and 2.10 g of H3-BTC were dissolved in 10 mL of ethanol, 50 mL of ethanol, and 100 mL of DMF–ethanol mixture (V/V = 1:1), respectively. Next, the PVP solution and Ce(NO3)3 solution were dropwise added to the H3-BTC solution under vigorously stirring. Then, the reaction was conducted at 80 °C for 20 h. After the reaction, the white solid (Ce-BTC) was centrifuged and washed by ethanol for three times before being dried at 60 °C for 24 h. Finally, the Ce-BTC was obtained. In step II, firstly, 0.1 mmol of metal acetylacetonate (M(acac)x, M = Cu, Ni, Co, and Fe) was dissolved in 15 mL of ethanol. Then, 0.5 g of Ce-BTC was added to the above solution, and the solid–liquid mixture was fully stirred for 24 h at room temperature. Finally, the ethanol was evaporated at 80 °C to obtain the solid (M/Ce-BTC). In step III, the obtained Ce-BTC and M/Ce-BTC were calcined at 500 °C for 5 h in the air atmosphere to obtain CeO2 and M/CeO2.
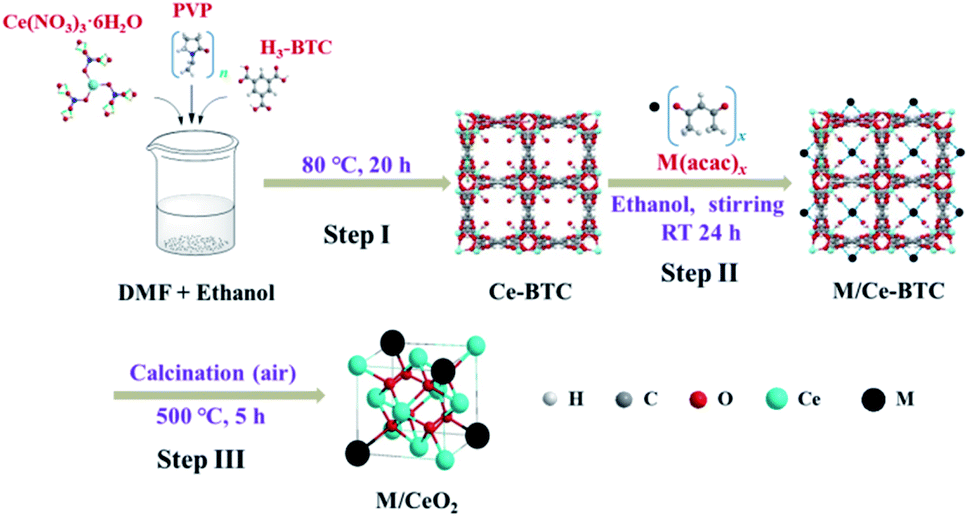 | ||
| Fig. 1 The preparative route of M/CeO2. | ||
2.3 The catalytic performances for CO oxidation
The catalytic performances of the prepared samples for CO oxidation were evaluated in a quartz tube (inner diameter = 7 mm) fixed-bed microreactor, as shown in Fig. S1.† The quartz tube loading 130 mg of the sample was placed vertically in a tube furnace. Four different kinds of feed gas (dry condition: 1 vol% CO, 4 vol% O2, N2 balance, 20 mL min−1, weight hourly space velocity (WHSV) of 9230 mL g−1 h−1; wet condition: 1 vol% CO, 4 vol% O2, 5 vol% H2O, N2 balance, 20 mL min−1, WHSV of 9230 mL g−1 h−1; H2-rich condition: 75 vol% H2, 1 vol% O2, 0.25 vol% CO, N2 balance, 40 mL min−1, WHSV of 18460 mL g−1 h−1; wet and H2-rich conditions: 75 vol% H2, 5 vol% H2O, 1 vol% O2, 0.25 vol% CO, N2 balance, 40 mL min−1, WHSV of 18460 mL g−1 h−1) passed through the quartz tube. The outlet of the reactor was connected with the gas chromatograph (GC-9160, Quhua, China) to record the compositions of mixed gas online. Before the catalytic performance test, the sample was pretreated with feed gas at 300 °C for 2 h. The CO conversion, O2 selectivity to CO2, and CO selectivity to CO2 can be calculated according to eqn (1)–(3):| XCO = ([CO]in − [CO]out)/[CO]in × 100% | (1) |
| SO2 = 0.5[CO2]out/([O2]in − [O2]out) × 100% | (2) |
| SCO = [CO2]out/([CO]in − [CO]out) × 100% | (3) |
2.4 Characterization methods
The textural properties of the samples were measured by Autosorb-iQ-MP-AG gas adsorption instrument (Quantachrome Corporation). Except for Ce-BTC, the samples were pretreated at 300 °C for 3 h under the high vacuum condition before being measured. The Ce-BTC was pretreated at 150 °C for 8 h under the high vacuum condition. For all samples, the surface area was calculated by Brunner–Emmet–Teller (BET) method, the average pore diameter was calculated by Barrett–Joyner–Halenda (BJH) method, and the total pore volume was obtained over the P/P0 value of 0.99. The crystal structures and properties were determined by XRD using the Rigaku Smart Lab operating at 30 mA and 40 kV with a Cu Kα radiation (λ = 1.5418 Å). The scan speed of 10° min−1 was applied in each continuous run at the 2θ range of 10° to 70°, except for Ce-BTC (5° to 70°). The average crystallite size was obtained by Scherrer equation (Dβ = Kλ/(βcosθ), λ is the wavelength (λ = 1.5418 Å), K is the particle shape factor (K = 0.89), β is the full-width at half maximum height in radians, and θ is the diffraction angle). The metal contents (Ce, Cu, Ni, Co, and Fe) in the catalysts were determined by ICP-OES on the Agilent 720ES. The thermal stability was analyzed by TGA (Metter Toledo) in the air (flow rate: 120 mL min−1) at a ramping rate of 10 °C min−1. The morphological structures were investigated by SEM (Hitachi, SU5000), TEM (JOEL, JEM2100), and HRTEM (Philips, C/M300). X-ray energy dispersive spectra (EDX) were also performed on TEM equipped with the corresponding accessories. The surface chemistry was analyzed by XPS (AXIS-His, Kratos Analytical). The C 1s core level peak with binding energy at 284.8 eV was taken as energy calibration. The reducibility of components was analyzed by H2-TPR which was carried out in Micromeritics Autochem II 2920 equipped with the thermal conductivity detector (TCD). The sample was pretreated at 300 °C with 20 mL min−1 of He gas for 2 h. The test was performed from room temperature to 850 °C with a heating rate of 10 °C min−1. In situ DRIFTS was adopted to study the reaction process of CO oxidation using the Thermo Scientific Nicolet iS50 spectrometer which was equipped with a KBr optical beam and a Mercury–Cadmium–Telluride (MCT) detector scanning in the wavenumber range of 4000 cm−1 to 650 cm−1. Each sample was placed into an infrared cell equipped with Zn–Se window. Before testing, the sample was purged by N2 stream (30 mL min−1) at 300 °C for 30 min to remove the adsorbed water and other volatile components, and then cooled to the targeted temperature for obtaining the background spectrum. The test process was divided into three stages. Firstly, the sample was exposed to the CO stream with a flow rate of 30 mL min−1 for 30 min to reach surface saturation. Then, the N2 stream passed through the sample with a flow rate of 30 mL min−1 for 30 min. Finally, the atmosphere was switched to O2 gas with a flow rate of 30 mL min−1 for 30 min.
3. Results and discussion
3.1 CO oxidation ability and catalyst stability
The catalytic performances of prepared samples for CO oxidation in the dry condition were shown in Fig. 2A. It can be seen that the temperature at 100% CO conversion (T100) increases in the sequence of Cu/CeO2 (100 °C) < Ni/CeO2 (160 °C) < Co/CeO2 (180 °C) < Fe/CeO2 (260 °C) < CeO2 (290 °C), suggesting that the doping of Cu, Ni, Co, or Fe on CeO2 can significantly promote the catalytic activity. Among the catalysts investigated, Cu/CeO2 exhibits the best catalytic performance, which may be due to high oxygen vacancy, and high CO adsorption capacity (Cu+–CO) (vide infra). Furthermore, the catalytic activity of Cu/CeO2 is much higher than those of bare CuO (derived from the calcination of Cu(acac)2, 500 °C for 5 h) and bare CeO2, which indicates there exists a strong interaction between Cu and CeO2 to improve the catalytic activity. To obtain meaningful kinetics, the CO conversion data <15% which can ignore the heat and mass transport effects were used to calculate the activation energy (Ea), as shown in Fig. 2B. It can be found that the Ea over Cu/CeO2 (53.3 kJ mol−1) is much lower than those catalyzed by other metal oxides, indicating the high catalytic activity for CO oxidation, which is consistent with the result of Fig. 2A. Interestingly, although the Ea over Ni/CeO2 is higher than that over Co/CeO2, Ni/CeO2 exhibits better catalytic performance. It may be due to the fact that the pre-exponential factor value of Ni/CeO2 (1.19 × 10¹¹ h−1) was much higher than that of Co/CeO2 (2.24 × 10¹⁰ h−1), which suggests a higher density of active sites for the CO oxidation.20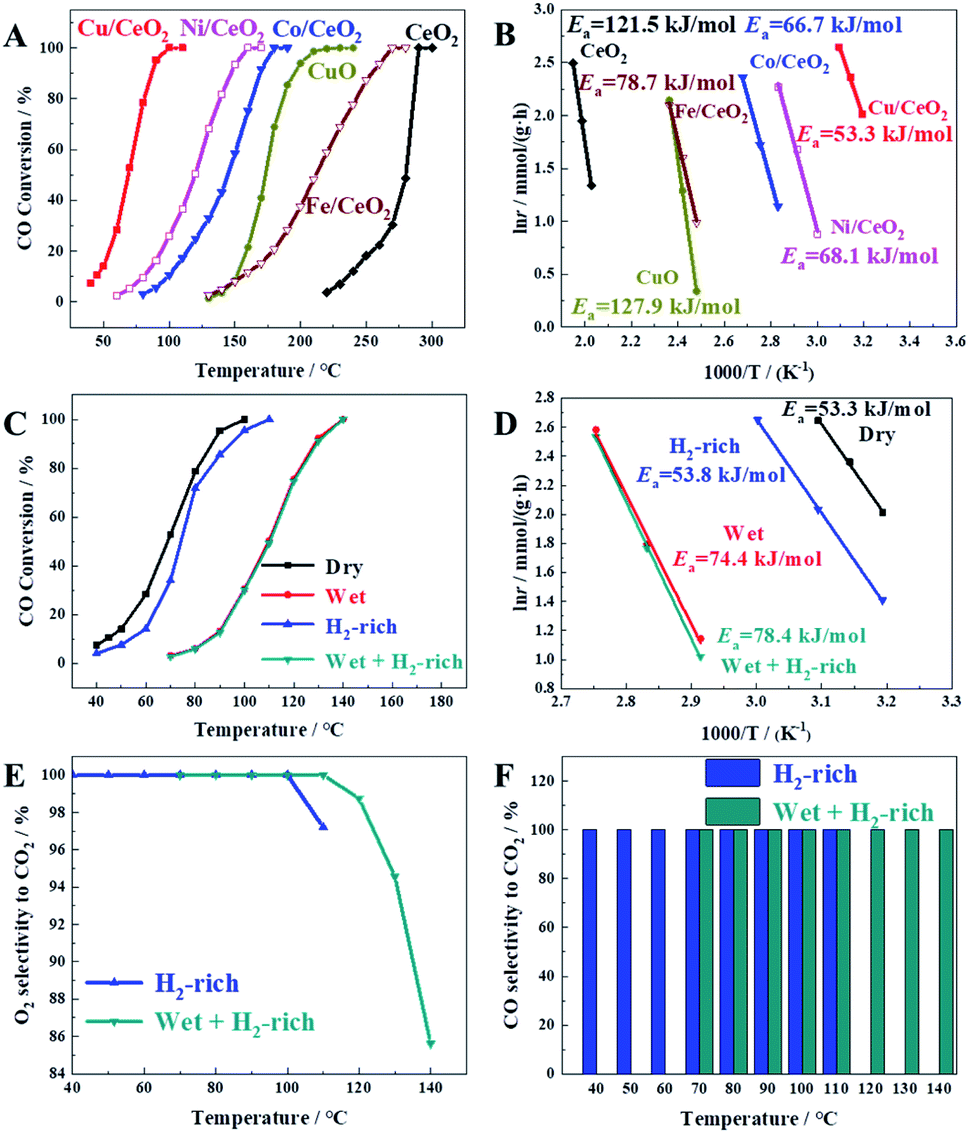 | ||
| Fig. 2 (A and B) The CO conversion data and the corresponding Arrhenius plots under the catalysis of six different catalysts in dry condition. (C and D) The CO conversion data and the corresponding Arrhenius plots over Cu/CeO2 using four gas mixtures as feedstock. (E) O2 selectivity to CO2. (F) CO selectivity to CO2. | ||
Furthermore, we also investigated the catalytic activity of Cu/CeO2 prepared by co-precipitation (defined as Cu/CeO2(cp)), as shown in Fig. S2.† It can be seen clearly that Cu/CeO2 exhibited higher catalytic activity than that of Cu/CeO2(cp) in CO oxidation, which indicated the advantages of the method being used.
The actual CO treatment gas, like the reformer gas, usually contains a large amount of hydrogen (H2) and an appropriate amount of water vapor (H2O), so it is necessary to investigate the catalytic activity of the prepared catalyst for CO oxidation under the atmosphere of H2, H2O and the both. Herein, we investigated the catalytic activity of Cu/CeO2 for CO oxidation in wet, H2-rich, and wet + H2-rich conditions, respectively. As shown in Fig. 2(C and D), CO is completely converted at 140 °C under 5.00 vol% H2O (wet condition), exhibiting a delay of 40 °C in comparison with catalytic activity in dry condition, which may be caused by the H2O blocking for the active sites or the competitive adsorption between H2O and O2.24,26 Accordingly, the Ea (74.4 kJ mol−1) in the wet condition is much higher than that (53.3 kJ mol−1) in the dry condition. The complete conversion of CO is achieved at 110 °C in H2-condition, showing only 10 °C of delay compared to dry condition, and their Ea are extremely similar (53.3 kJ mol−1 and 53.8 kJ mol−1), which suggests the reaction mechanism of CO oxidation is not changed with the existence of H2. Similarly, the existence of H2 has little effect on the CO conversion in wet conditions judging from the CO conversion curve and Ea. It can be seen clearly from Fig. 2E that when the reaction temperature is too high, O2 selectivity to CO2 is less than 100% in H2-rich conditions due to the competitive oxidation of H2. Furthermore, at 110 °C, the value of O2 selectivity in wet and H2-rich conditions is 100%, while it is 97.20% in H2-rich condition, indicating the presence of water also prevents the oxidation of H2 due to the H2O cover for active sites. In Fig. 2F, all of CO selectivity to CO2 are 100%, which suggests the reaction of CO and H2 is non-existent due to the low reaction temperature range. The obtained results reveal that the prepared Cu/CeO2 is highly active for CO oxidation.
The stability of prepared Cu/CeO2 for CO oxidation under four different gas atmospheres was also investigated by the time-on-stream studies, as shown in Fig. 3. It is obvious that no discernible decrease occurred in CO conversion, which suggested the prepared Cu/CeO2 is quite stable. In addition, the catalytic performances of Cu/CeO2 for CO oxidation were compared with those reported in the literature, summarized in Table S1.† It can be concluded that the prepared Cu/CeO2 exhibits the superior catalytic activity to many other catalysts due to the lower T100. Therefore, the prepared Cu/CeO2 can be an excellent catalyst for CO oxidation.
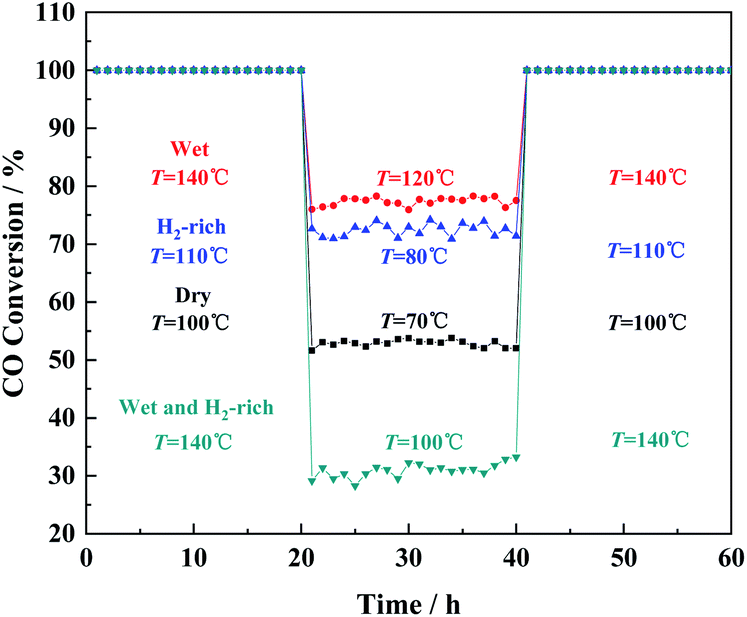 | ||
| Fig. 3 The long-term stability of Cu/CeO2 in CO oxidation under the four gas atmospheres. | ||
3.2 Characterization results
N2 adsorption–desorption isotherms and pore size distributions of the prepared samples were displayed in Fig. 4(i) and S3,† and the corresponding textural properties were given in Table 1. All the isothermal curves exhibit the typical IV-type behavior, and have the H3 type hysteresis loop over P/P0 value of 0.50 to 0.99, which indicates the existence of mesopores. Accordingly, the pore size distributions of the samples are mainly concentrated on 4 nm. It can be found that the BET surface area and total pore volume of Ce-BTC are much less than those of CeO2 and M/CeO2. The explanations for the result are that some of DMF molecules remain in the pore of Ce-BTC, which can be demonstrated by FT-IR, as shown in Fig. S4† (the peaks at 2973 cm−1, 2875 cm−1, and 1659 cm−1 are attributed to νas(–CH3), νs(–CH3) and ν(C![[double bond, length as m-dash]](https://www.rsc.org/images/entities/char_e001.gif) O) of DMF, respectively27), and after calcination, the DMF and organic ligands are removed from the Ce-BTC to form CeO2 or M/CeO2, making more space. Besides, the average pore diameter of Ce-BTC and obtained metal oxides is similar, which suggests the corresponding derivative oxide products maintain the superior pore structure.
O) of DMF, respectively27), and after calcination, the DMF and organic ligands are removed from the Ce-BTC to form CeO2 or M/CeO2, making more space. Besides, the average pore diameter of Ce-BTC and obtained metal oxides is similar, which suggests the corresponding derivative oxide products maintain the superior pore structure.
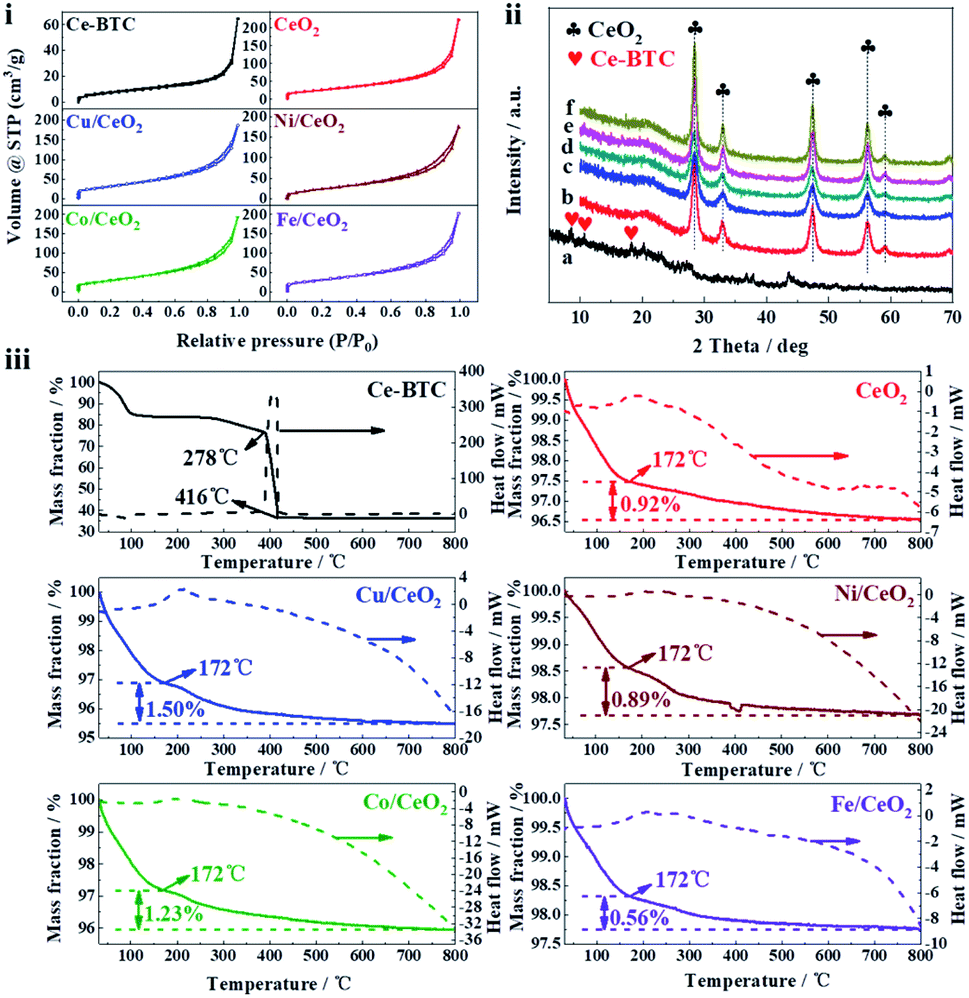 | ||
| Fig. 4 (i) N2 adsorption–desorption isotherms of the prepared samples. (ii) The XRD patterns of the prepared samples: (a) Ce-BTC, (b) CeO2, (c) Co/CeO2, (d) Cu/CeO2, (e) Fe/CeO2, (f) Ni/CeO2. (iii) TGA (air atmosphere) and heat flow curves of prepared samples. | ||
| Sample | Textural analysis | XRD analysis | ICP-OES | ||
|---|---|---|---|---|---|
| BET surface area (m2 g−1) | Pore volume (cm3 g−1) | Average pore size (nm) | Average crystallite sizea (nm) | Metal content (wt%) | |
| a Calculated by Scherrer equation. | |||||
| Ce-BTC | 25.90 | 0.10 | 3.83 | 10.32 | — |
| CeO2 | 94.75 | 0.34 | 3.42 | 9.49 | Ce: 81.77 |
| Cu/CeO2 | 114.09 | 0.29 | 3.42 | 7.49 | Ce: 77.37 |
| Cu: 4.09 | |||||
| Ni/CeO2 | 86.71 | 0.27 | 3.83 | 11.85 | Ce: 76.95 |
| Ni: 4.44 | |||||
| Co/CeO2 | 105.61 | 0.30 | 3.41 | 7.00 | Ce: 77.30 |
| Co: 3.66 | |||||
| Fe/CeO2 | 108.72 | 0.31 | 3.82 | 10.21 | Ce: 78.84 |
| Fe: 2.09 | |||||
The XRD patterns of the prepared samples were shown in Fig. 4(ii), and the corresponding average crystallite size calculated by Scherrer equation was presented in Table 1. For Ce-BTC, the peaks appear at 8.48°, 10.64°, and 18.18° are consistent with the previous reports,28,29 which suggests that Ce-BTC has been prepared successfully. Regarding the metal oxides, they all exhibit the fluorite type cubic CeO2 phase (28.34° (111), 33.06° (200), 47.36° (220), 56.35° (311), and 59.06° (222)). Interestingly, no peaks belonging to transition metals (M species) are observed, and it is similar to the previous study,4,30 which indicates M species have been successfully doped into CeO2.4 More or less the same crystallite size for CeO2 and M/CeO2 suggests that the addition of M does not affect the structural characteristics of CeO2 (also can be seen in SEM and TEM). The ICP-OES result (Table 1) reveals that the content of M in the prepared samples is less than 5 wt%, however, the little amount of M plays a significant role in the improvement of catalytic activity (Fig. 2B). In addition, the difference of M content in the prepared samples may cause by the different adsorption capability of Ce-BTC towards the different M(acac)x.
TGA was further employed to determine the thermal stability of prepared samples, as shown in Fig. 4(iii). In all samples, the weight loss before 150 °C can be attributed to the volatilization of sample adsorbates, like water. The Ce-BTC skeleton decomposes rapidly from 386 °C to 416 °C, which is associated with a strong exothermic peak in the heat flow curves. After 416 °C, Ce-BTC is basically converted into CeO2, indicating the calcination temperature (500 °C) for sample preparation is enough. For CeO2 and M/CeO2, it can be seen clearly that when the temperature rises from 172 °C to 800 °C, all of the weight losses are lower than 1.50%, which suggests they possess high thermal stability.
The morphological structures of the prepared samples were characterized by SEM and TEM, as shown in Fig. 5 and S5.† It is clearly that the morphology of Ce-BTC presents a straw-like bundle structure, which is quite different from those reported by Zhang (cauliflower-like structure, strawsheave-like structure, and rod-like structure).28,30,31 Compared to Ce-BTC, the surface morphologies of CeO2 and M/CeO2 become rougher and more shriveled due to the calcination, but they still maintain the bundle structure. The EDX elemental maps of Cu/CeO2 (Fig. 5(f and g)) reveal that both Ce and Cu are uniformly distributed in the whole structure, which indicates Ce-BTC adsorbing with Cu(acac)2 and then calcination is an effective method to prepare Cu/CeO2 bimetallic oxides. Furthermore, in Fig. 5(i), the interlayer distance between adjacent planes is calculated to be 0.31 nm, which can be indexed to the (111) crystal planes of CeO2, being highly consistent with the XRD result.
 | ||
| Fig. 5 (a and b) SEM images at different magnifications of Cu/CeO2. (c and d) TEM images at different magnifications of Cu/CeO2. (e–h) The dark-field TEM and the corresponding EDX elemental maps of Cu/CeO2. (i) HRTEM image of Cu/CeO2. | ||
H2-TPR experiments were carried out to study the redox properties of bare CeO2, bare CuO, and Cu/CeO2, as shown in Fig. 6. The reduction profiles of bare CeO2 consists of two broad overlapping peaks centered at 431.2 °C and 517.3 °C, and one peak at 788.3 °C, which are attributed to the reaction of surface oxygen (Os) from different crystal planes (overlapping peaks), and bulk oxygen (Ob) of CeO2, respectively.1,32 Bare CuO has two overlapping peaks (α and β) at 256.5 °C and 291.4 °C, also being ascribed to the reduction of Os and Ob, respectively. The reduction profiles of Cu/CeO2 show two overlapping peaks (α and β) in the range of 150.5–166.3 °C, and one peak at 788.6 °C which is assigned to the reduction of Ce4+ into Ce3+. The peak γ (150.5 °C) is assigned to the reduction of the uniformly dispersed CuOx species interacting strongly with the CeO2 surface, while the peak ε is attributed to the reduction of larger CuOx species associated with Ceria.7,30,32,33 It can be found that the reduction of Cu/CeO2 is easier than those of bare CuO and CeO2, indicating the strong interaction between CuOx species and CeO2 that facilitates the electron exchanges of Cu2+/Cu+ and Ce3+/Ce4+ (Ce4+ + Cu+ ⇆ Ce3+ + Cu2+),34,35 which weakens the metal–oxygen bonds and promotes the oxygen vacancy. The previous studies have revealed that the oxygen of CeO2 is involved in the CO oxidation,3,33 therefore, the weakening of metal–oxygen bonds by Cu doping makes the oxygen of prepared catalyst combine with CO to form CO2 easier, improving the catalytic activity.
 | ||
| Fig. 6 The H2-TPR profiles of CeO2, CuO, and Cu/CeO2. | ||
XPS was used to analyze the elementary oxidation states of CeO2, M/CeO2, and CuO. In Fig. 7A, it is clearly that two different metals are included in M/CeO2. The C 1s spectra exhibited in Fig. 7B has two independent peaks (288.6–287.5 eV and 284.8 eV), which are assigned to the carboxylate carbon (–COO) and the sp3-carbon, respectively. The existence of carboxylate carbon suggests that the organics are not completely decomposed in the calcination process.23,36 Fig. 7C depicts the O 1s of the prepared samples, which can be divided into three main peaks, at 533.3 eV, 531.4 eV, and 529.8–529.4 eV, respectively. The first peak reveals the existence of hydroxyl groups and C–O (from the carboxyl group), which is consistent with the C 1s result. The second peak can be attributed to the surface adsorbed oxygen (Oabs), which is closely associated with the oxygen vacancies. The last peak is assigned to the lattice oxygen (Olat).35,37 Fig. 7D displays the XPS spectra of the different doping metals. The two independent peaks located at 931.7 eV and 934.0 eV in Cu 2p3/2 are attributed to the Cu+ (Cu2O) and Cu2+ (CuO), and the typical shake-up satellite at 942 eV is caused by the divalent Cu2+ species.7,38 In Ni 2p3/2, the major peaks located at 853.7 eV and 856.3 eV are assigned to NiO and Ni2O3, respectively. The peak at 855.2 eV indicates surface Ni3+ species associated to the presence of Ni2+ vacancies in NiO crystal lattices.39 Also, it is found that the satellite peak of NiO appears at 860.8 eV.40 There are three peaks in Co 2p3/2, which can be attributed to Co3+ (779.8 eV), Co2+ (781.2 eV), and the satellite peak of Co2+ (786.2 eV).41 In Fe 2p3/2 region, Fe2+ and the satellite are characterized by the peak at 710.7 eV and 716.6 eV, respectively, while Fe3+ is characterized by the peak at 713.9 eV, with a strong satellite at 718.8 eV.37,42 The complex spectra of Ce 3d (Fig. 7E) are composed of eight peaks, namely at a (882.2 eV), a′ (884.8 eV), a′′ (888.7 eV), a′′′ (898.0 eV), b (900.6 eV), b′ (903.2 eV), b′′ (907.6 eV), and b′′′ (916.4 eV), as reported in several relevant studies.43,44 The six peaks a, a′′, a′′′, b, b′′ and b′′′ are the characteristics of Ce4+ ion on the 3d104f0 structure, whereas a′ and b′ are attributed to Ce3+ ion on the 3d104f1 structure. The co-existence of Ce3+ and Ce4+ indicates the formation of oxygen vacancy on the ceria surface, and the proportion of Ce3+ calculated from the area ratio of Ce3+ species to that of total Ce species (Ce3+/(Ce3+ + Ce4+)) can represent the amount of surface oxygen vacancy. Among the samples investigated, the proportion of Ce3+ decreases in the sequence of Cu/CeO2 (17.6%) > Ni/CeO2 (17.3%) > CeO2 (16.6%) > Fe/CeO2 (16.4%) > Co/CeO2 (15.4%). The fact that the oxygen vacancy of Cu/CeO2 is higher than that of CeO2 indicates the interaction between CuOx and CeO2 promotes the oxygen vacancy. The highest oxygen vacancy of Cu/CeO2 is perfectly matched to its highest catalytic performance, suggesting the key role of oxygen vacancy on CO oxidation performance. Furthermore, the existence of oxygen vacancy was also revealed by Raman spectrum, as shown in Fig. S6.† The band at 459 cm−1 is attributed to Raman active vibrational mode of fluorite-type CeO2, while that at 600 cm−1 is related to oxygen vacancy due to the presence of Ce3+ in the CeO2 lattice.45 The Cu 2p3/2 XPS spectra of CuO and Cu/CeO2 were shown in Fig. 7F. It is clearly that Cu exists only in divalent state for CuO, while the co-existence of Cu+ and Cu2+ is presented in Cu/CeO2, which reveals the strong interaction between CuOx and CeO2 also can lead to a stable existence of Cu+ in Cu/CeO2. It is well recognized that Cu+ has strong chemisorption to CO (vide infra), and the chemisorption of CO on Cu+ is significant for CO oxidation.35 Therefore, both high oxygen vacancy and high CO adsorption capacity contribute to the excellent catalytic activity of Cu/CeO2 in CO oxidation.
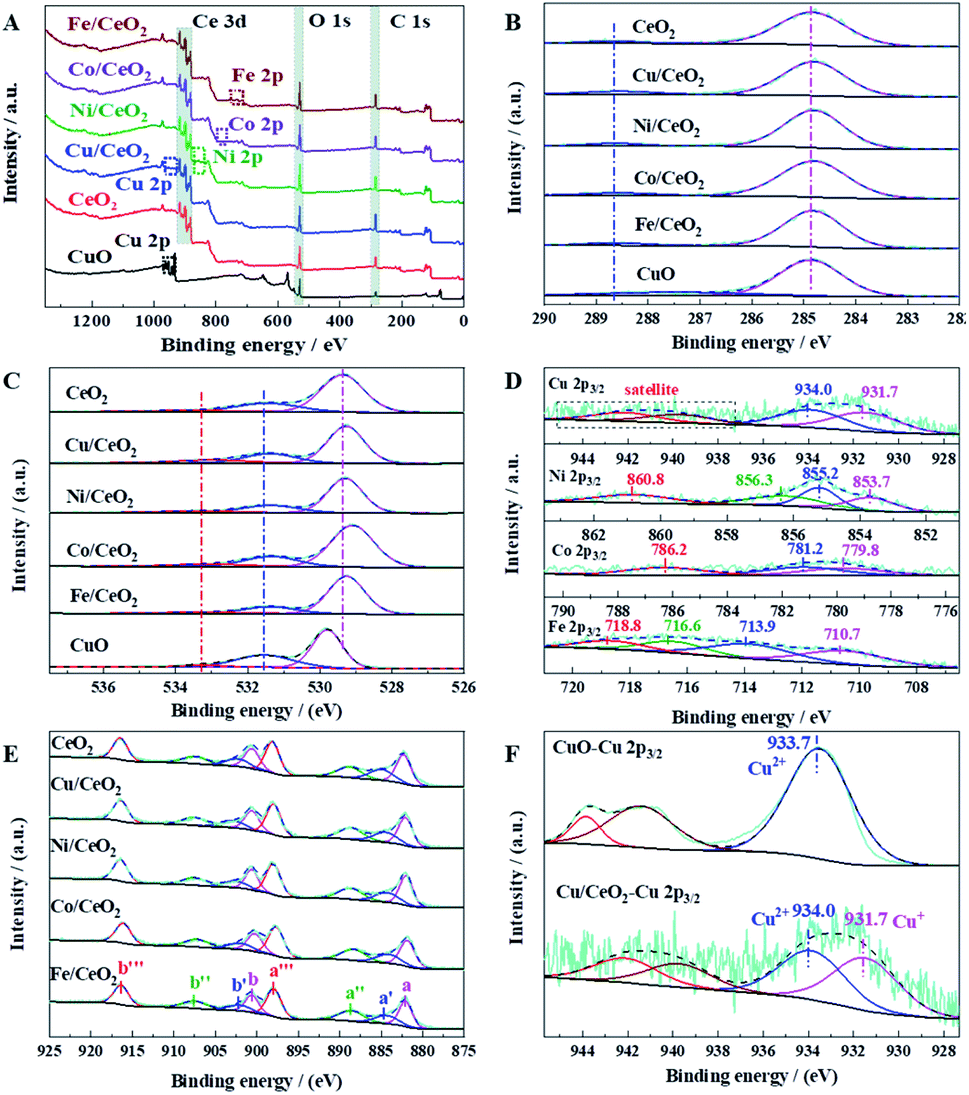 | ||
| Fig. 7 XPS characterization results: (A) survey XPS spectra, (B) C 1s XPS spectra, (C) O 1s XPS spectra, (D) XPS spectra of the doping metals, (E) Ce 3d XPS spectra, (F) Cu 2p3/2 XPS spectra of CuO and Cu/CeO2. | ||
In situ DRIFTS was adopted to study the reaction process of CO oxidation. Fig. 8a displays in situ DRIFTS of CO adsorption, N2 purging, and O2 dose over Cu/CeO2 at 40 °C. Two intensive peaks at 2173 and 2115 cm−1 appear after CO feeding for 30 min, which can be attributed to the gas-phase CO.20,46 It can be found that the intensities of the two peaks decrease gradually when N2 is introduced, suggesting that the non-chemically adsorbed CO is taken away under the N2 flow. After N2 purging, the characteristic peak of adsorbed CO appears at 2109 cm−1, which reflects that the CO is adsorbed linearly on Cu+ (Cu+–CO).20,47 The peak intensity of adsorbed CO decreases rapidly after the introduction of O2, indicating the rapid conversion of CO on the surface of Cu/CeO2. Besides, the IR peaks in the range of 1700–1000 cm−1 are due to the diverse vibrations of carbonates and formates. For example, the peak at 1526 cm−1 represents the asymmetric stretch of formate species νas(COO), and the symmetric stretch of carbonate species νs(CO) and formate species νs(COO) are characterized by the peaks at 1627 and 1353 cm−1, respectively. Fig. 8b depicts IR absorbance at 2115–2109 cm−1 along with time of N2 purge over Cu/CeO2 at different temperatures. It can be seen that at each temperature, the absorbance decreases with the increase of N2 purge time, suggesting CO is constantly being taken away under the N2 flow. The absorbance also decreases in the sequence of T = 40 °C > T = 70 °C > T = 100 °C, which reveals that the high temperature is unfavourable for the formation of Cu+–CO, being in conformity with thermodynamic law. However, the high temperature can promote the reaction of CO and O2. As shown in Fig. 8c, when O2 is introduced into the system, the change rate of absorbance follows the sequence of T = 100 °C > T = 70 °C > T = 40 °C, which indicates that as the temperature increases, the conversion rate of CO to CO2 increases, being in accordance with the law of reaction kinetics. The comprehensive effects of thermodynamics (CO absorption) and reaction kinetics (CO reaction) make CO conversion increase with the increase of temperature (Fig. 2A). The absorbance at 2115–2109 cm−1 along with time of N2 purge over different samples at 40 °C were exhibited in Fig. 8d. It can be seen clearly that the absorbance decreases in the sequence of Cu/CeO2 > Ni/CeO2 > Co/CeO2 > Fe/CeO2 > CeO2, suggesting the CO adsorption capacity of the investigated samples follows the above order. All of M/CeO2 (Cu/CeO2, Ni/CeO2, Co/CeO2, and Fe/CeO2) show the higher absorption capacity of CO than that of CeO2, indicating the introduction of M promotes CO accumulation degree on the catalyst surface. Interestingly, the CO adsorption capacity is consistent with their catalytic activity in CO oxidation, which indicates CO adsorption capacity of doping metal determines the oxidation performance directly. In addition, compared to CuO, Cu/CeO2 exhibits a better absorption capacity for CO, which is due to the stable existence of Cu+ derived from the strong interaction between CuOx and CeO2. Generally, in the reaction process of CO oxidation over Cu/CeO2, the dispersed Cu+ promotes CO adsorption, and thus combines with oxygen on adjacent oxygen vacancy rapidly to form CO2.
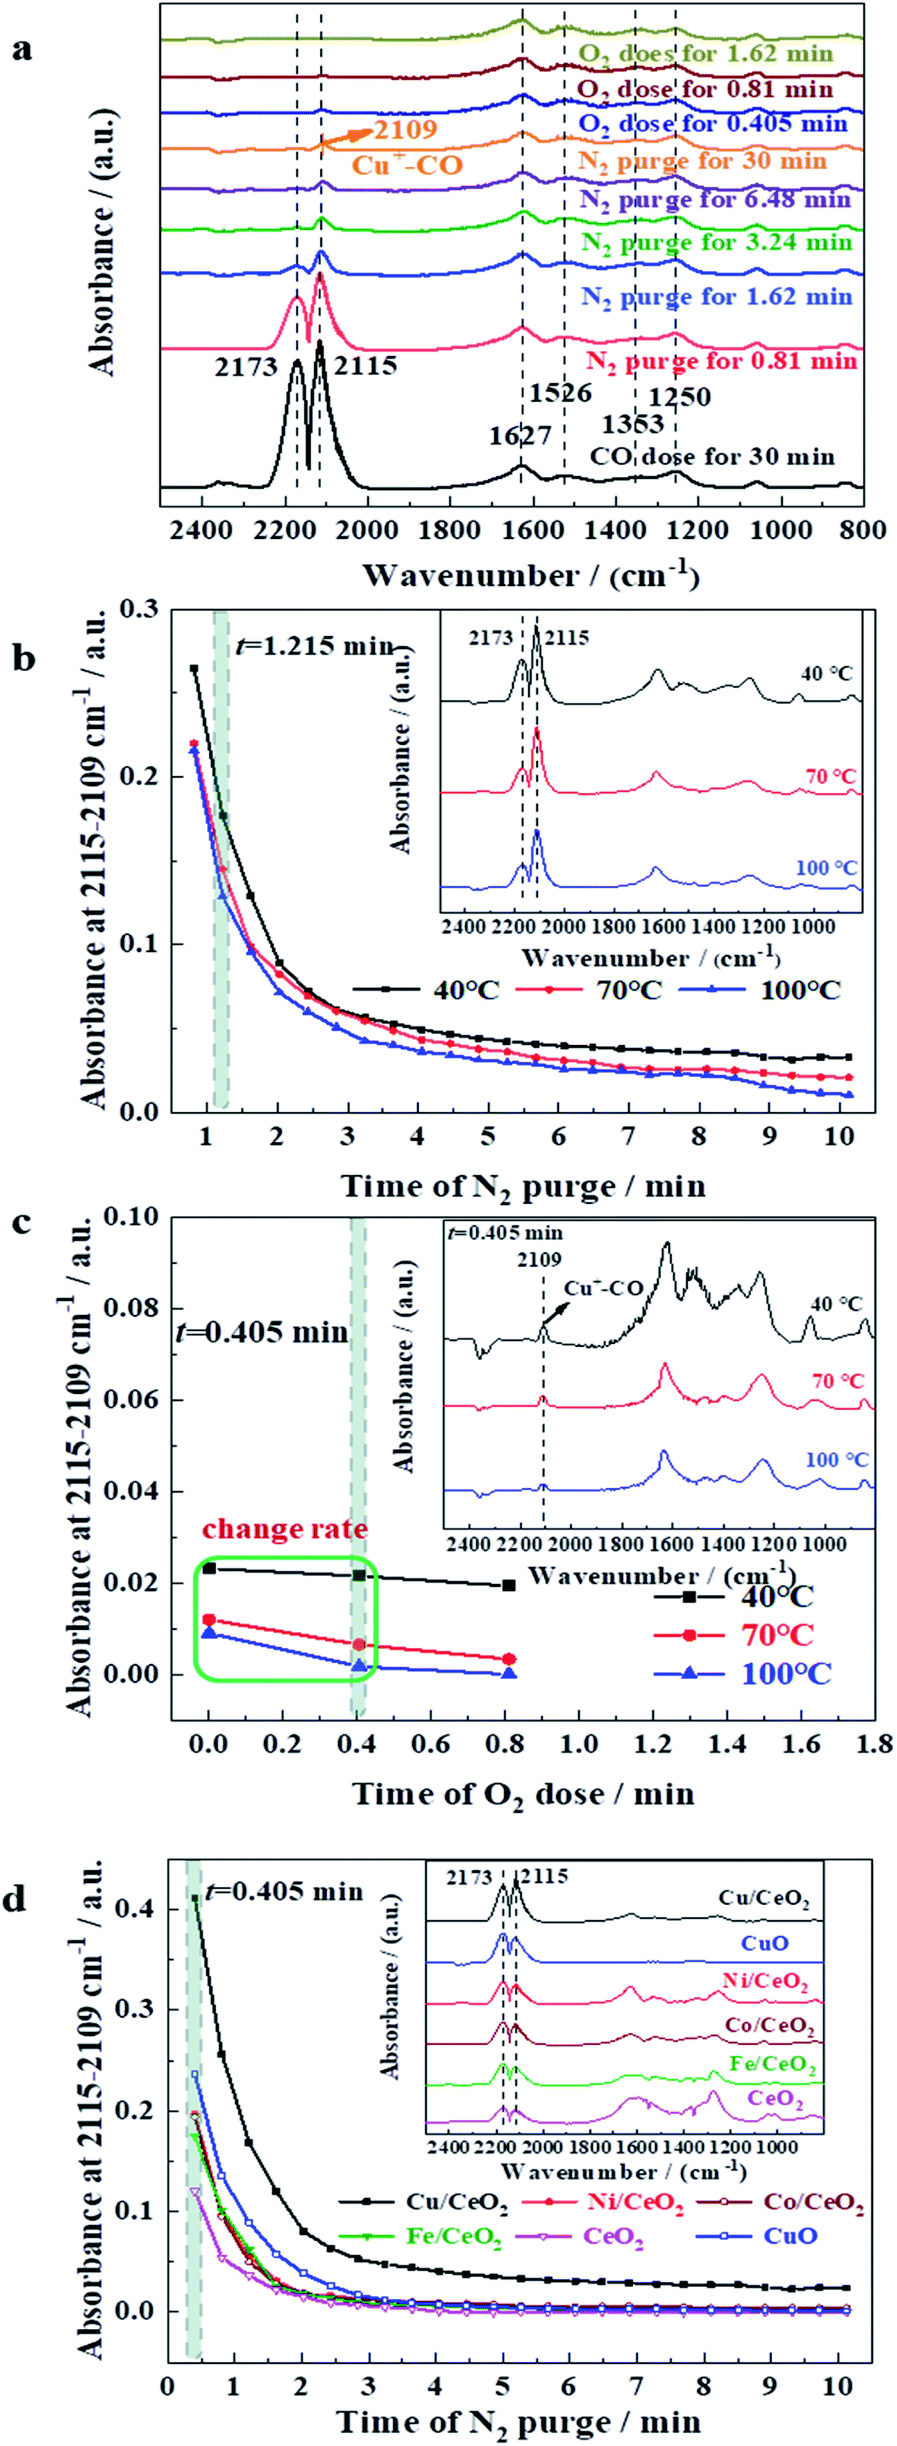 | ||
| Fig. 8 (a) In situ DRIFTS of CO adsorption, N2 purging, and O2 dose over Cu/CeO2 at 40 °C. (b) Absorbance at 2115–2109 cm−1 along with N2 purge over Cu/CeO2 at different temperatures. (c) Absorbance at 2115–2109 cm−1 along O2 dose over Cu/CeO2 at different temperatures. (d) Absorbance at 2115–2109 cm−1 along N2 purge over different samples at 40 °C. | ||
H2-TPR, XPS, and in situ DRIFTS have revealed that the electron exchanges of Cu2+/Cu+ and Ce3+/Ce4+ pairs promote the oxygen vacancy and lead to the stable existence of Cu+ (improve CO absorption), which benefit the CO oxidation. Based on the results, we proposed a plausible mechanism for CO oxidation over Cu/CeO2, as illustrated in Fig. 9, which involves four consecutive steps: (I) CO is adsorbed on the Cu+ to form Cu+–CO. (II) The chemisorbed CO (Cu+–CO) migrates to the metal–support interface. (III) O2 is activated on oxygen vacancy of CeO2 to form O2− (active oxygen) or O2− (lattice oxygen). (IV) The chemisorbed CO reacts with active oxygen to form CO2, and CO2 diffuses from the catalyst surface to gas bulk.
 | ||
| Fig. 9 A plausible mechanism for CO oxidation over Cu/CeO2. | ||
4. Conclusions
In this work, we have reported an effective method to prepared M/CeO2 bimetallic oxides for catalytic oxidation of CO, by calcination of Ce-BTC adsorbing with M(acac)x. The results of XRD, ICP-OES, and XPS indicate that the transition metals (M, M = Cu, Ni, Co, and Fe) are successfully doped into CeO2. TGA reveals that M/CeO2 catalysts possess high thermal stability. Among the prepared M/CeO2, Cu/CeO2 performs the most excellent activity and high stability in CO oxidation under four different gas atmospheres. H2-TPR, XPS, and in situ DRIFTS suggest that the electron exchanges of Cu2+/Cu+ and Ce3+/Ce4+ (Ce4+ + Cu+ ⇆ Ce3+ + Cu2+) facilitate the formation of active oxygen species and stabilize the Cu+ species (which improves CO adsorption), which make Cu/CeO2 perform high catalytic activity in CO oxidation. In summary, this work has successfully designed the highly active and stable bimetallic oxide nanocomposites for CO oxidation, which has important implications for the development of clean energy and environmental protection.Conflicts of interest
There are no conflicts to declare.Acknowledgements
This work was supported by the National Natural Science Foundation of China (no. 21908073) and Start-Up Scientific Research Funds for Newly Recruited Talents of Huaqiao University (no. 605-50Y20015).References
- M. Carltonbird, S. Eaimsumang, S. Pongstabodee, S. Boonyuen, S. M. Smith and A. Luengnaruemitchai, Chem. Eng. J., 2018, 344, 545–555 CrossRef CAS.
- I. Lee and F. Zaera, J. Catal., 2014, 319, 155–162 CrossRef CAS.
- M. Wilklow-Marnell and W. D. Jones, Mol. Catal., 2017, 439, 9–14 CrossRef CAS.
- C. R. Jung, A. Kundu, S. W. Nam and H.-I. Lee, Appl. Catal., B, 2008, 84, 426–432 CrossRef CAS.
- M.-C. Jo, G.-H. Kwon, W. Li and A. M. Lane, J. Ind. Eng. Chem., 2009, 15, 336–341 CrossRef CAS.
- M. P. Woods, P. Gawade, B. Tan and U. S. Ozkan, Appl. Catal., B, 2010, 97, 28–35 CrossRef CAS.
- X. Guo and R. Zhou, Catal. Sci. Technol., 2016, 6, 3862–3871 RSC.
- S. Dey, G. C. Dhal, D. Mohan and R. Prasad, Materials Discovery, 2017, 8, 26–34 CrossRef.
- S. Dey and G. C. Dhal, Inorg. Chem. Commun., 2019, 110, 107614 CrossRef CAS.
- R. Khobragade, D. Yearwar, N. Labhsetwar and G. Saravanan, Int. J. Hydrogen Energy, 2019, 44, 28757–28768 CrossRef CAS.
- T. M. Nyathi, N. Fischer, A. P. E. York, D. J. Morgan, G. J. Hutchings, E. K. Gibson, P. P. Wells, C. R. A. Catlow and M. Claeys, ACS Catal., 2019, 9, 7166–7178 CrossRef CAS PubMed.
- S. D. Senanayake, N. A. Pappoe, T.-D. Nguyen-Phan, S. Luo, Y. Li, W. Xu, Z. Liu, K. Mudiyanselage, A. C. Johnston-Peck, A. I. Frenkel, I. Heckler, D. Stacchiola and J. A. Rodriguez, Surf. Sci., 2016, 652, 206–212 CrossRef CAS.
- M. D. Porosoff, B. Yan and J. G. Chen, Energy Environ. Sci., 2016, 9, 62–73 RSC.
- J. Liu, A. Zhang, M. Liu, S. Hu, F. Ding, C. Song and X. Guo, J. CO2 Util., 2017, 21, 100–107 CrossRef CAS.
- G. Zhu, S. Wang, Z. Yu, L. Zhang, D. Wang, B. Pang and W. Sun, Res. Chem. Intermed., 2019, 45, 3777–3793 CrossRef CAS.
- W. Xie and F. Wan, Chem. Eng. J., 2019, 365, 40–50 CrossRef CAS.
- D. Liu, G. Li and H. Liu, Appl. Surf. Sci., 2018, 428, 218–225 CrossRef CAS.
- X. Ge, Z. Li, C. Wang and L. Yin, ACS Appl. Mater. Interfaces, 2015, 7, 26633–26642 CrossRef CAS PubMed.
- Z. Huang, L. Fan, F. Zhao, B. Chen, K. Xu, S. F. Zhou, J. Zhang, Q. Li, D. Hua and G. Zhan, Adv. Funct. Mater., 2019, 29, 1903774 CrossRef CAS.
- B. Chen, X. Yang, X. Zeng, Z. Huang, J. Xiao, J. Wang and G. Zhan, Chem. Eng. J., 2020, 397, 125424 CrossRef CAS.
- P. Kuśtrowski, L. Chmielarz, R. Dziembaj, P. Cool and E. F. Vansant, J. Phys. Chem. B, 2005, 109, 11552–11558 CrossRef PubMed.
- A. Valente, A. M. Botelho do Rego, M. J. Reis, I. F. Silva, I. F. Ramos and J. Vital, Appl. Catal., A, 2001, 207, 221–228 CrossRef CAS.
- L. Fan, F. Zhao, Z. Huang, B. Chen, S.-F. Zhou and G. Zhan, Appl. Catal., A, 2019, 572, 34–43 CrossRef CAS.
- A. Arango-Diaz, J. A. Cecilia, J. Marrero-Jerez, P. Nuñez, J. Jiménez-Jiménez and E. Rodríguez-Castellón, Ceram. Int., 2016, 42, 7462–7474 CrossRef CAS.
- A. Arango-Díaz, E. Moretti, A. Talon, L. Storaro, M. Lenarda, P. Núñez, J. Marrero-Jerez, J. Jiménez-Jiménez, A. Jiménez-López and E. Rodríguez-Castellón, Appl. Catal., A, 2014, 477, 54–63 CrossRef.
- I. Dobrosz-Gómez, I. Kocemba and J. M. Rynkowski, Catal. Lett., 2008, 128, 297–306 CrossRef.
- Z. Huang, F. Zhao, L. Fan, W. Zhao, B. Chen, X. Chen, S.-F. Zhou, J. Xiao and G. Zhan, Mater. Des., 2020, 194, 108881 CrossRef CAS.
- X. Zhang, F. Hou, Y. Yang, Y. Wang, N. Liu, D. Chen and Y. Yang, Appl. Surf. Sci., 2017, 423, 771–779 CrossRef CAS.
- M. M. Peng, M. Ganesh, R. Vinodh, M. Palanichamy and H. T. Jang, Arabian J. Chem., 2019, 12, 1358–1364 CrossRef CAS.
- Y. Wang, Y. Yang, N. Liu, Y. Wang and X. Zhang, RSC Adv., 2018, 8, 33096–33102 RSC.
- X. Zhang, F. Hou, H. Li, Y. Yang, Y. Wang, N. Liu and Y. Yang, Microporous Mesoporous Mater., 2018, 259, 211–219 CrossRef CAS.
- M. Lykaki, E. Pachatouridou, E. Iliopoulou, S. A. C. Carabineiro and M. Konsolakis, RSC Adv., 2017, 7, 6160–6169 RSC.
- M. Lykaki, E. Pachatouridou, S. A. C. Carabineiro, E. Iliopoulou, C. Andriopoulou, N. Kallithrakas-Kontos, S. Boghosian and M. Konsolakis, Appl. Catal., B, 2018, 230, 18–28 CrossRef CAS.
- M. Konsolakis, Appl. Catal., B, 2016, 198, 49–66 CrossRef CAS.
- L. Qi, Q. Yu, Y. Dai, C. Tang, L. Liu, H. Zhang, F. Gao, L. Dong and Y. Chen, Appl. Catal., B, 2012, 119–120, 308–320 CrossRef CAS.
- L. Fan, K. Wang, K. Xu, Z. Liang, H. Wang, S. F. Zhou and G. Zhan, Small, 2020, e2003597, DOI:10.1002/smll.202003597.
- J. Ouyang, Z. Zhao, S. L. Suib and H. Yang, J. Colloid Interface Sci., 2019, 539, 135–145 CrossRef CAS PubMed.
- E. Moretti, L. Storaro, A. Talon, M. Lenarda, P. Riello, R. Frattini, M. d. V. M. de Yuso, A. Jiménez-López, E. Rodríguez-Castellón, F. Ternero, A. Caballero and J. P. Holgado, Appl. Catal., B, 2011, 102, 627–637 CrossRef CAS.
- A. Cárdenas-Arenas, A. Quindimil, A. Davó-Quiñonero, E. Bailón-García, D. Lozano-Castelló, U. De-La-Torre, B. Pereda-Ayo, J. A. González-Marcos, J. R. González-Velasco and A. Bueno-López, Appl. Catal., B, 2020, 265, 118538 CrossRef.
- B. Li, B. Zhang, Q. Guan, S. Chen and P. Ning, Int. J. Hydrogen Energy, 2018, 43, 19010–19018 CrossRef CAS.
- L. Óvári, S. Krick Calderon, Y. Lykhach, J. Libuda, A. Erdőhelyi, C. Papp, J. Kiss and H. P. Steinrück, J. Catal., 2013, 307, 132–139 CrossRef.
- H. Ali-Löytty, M. W. Louie, M. R. Singh, L. Li, H. G. Sanchez Casalongue, H. Ogasawara, E. J. Crumlin, Z. Liu, A. T. Bell, A. Nilsson and D. Friebel, J. Phys. Chem. C, 2016, 120, 2247–2253 CrossRef.
- Y. Cui and W.-L. Dai, Catal. Sci. Technol., 2016, 6, 7752–7762 RSC.
- C. Wang, Q. Cheng, X. Wang, K. Ma, X. Bai, S. Tan, Y. Tian, T. Ding, L. Zheng, J. Zhang and X. Li, Appl. Surf. Sci., 2017, 422, 932–943 CrossRef CAS.
- Y. Huang, B. Long, M. Tang, Z. Rui, M.-S. Balogun, Y. Tong and H. Ji, Appl. Catal., B, 2016, 181, 779–787 CrossRef CAS.
- Y. Wang, D. Li, K. Li and R. Farrauto, Appl. Catal., B, 2020, 267, 118363 CrossRef CAS.
- H. Wan, Z. Wang, J. Zhu, X. Li, B. Liu, F. Gao, L. Dong and Y. Chen, Appl. Catal., B, 2008, 79, 254–261 CrossRef CAS.
Footnote |
| † Electronic supplementary information (ESI) available: Reactor image, pore size distribution, FT-IR, SEM images and TEM images. See DOI: 10.1039/d1ra03319k |
| This journal is © The Royal Society of Chemistry 2021 |