
 Open Access Article
 This Open Access Article is licensed under a Creative Commons Attribution-Non Commercial 3.0 Unported Licence
Synthesis of vertical WO3 nanoarrays with different morphologies using the same protocol for enhanced photocatalytic and photoelectrocatalytic performances†
Jingjing Liab,
Chenpeng Guoab,
Lihua Liab,
Yongjun Guab,
BoK.-Hee Kimac and
Jinliang Huang *ab
*ab
aSchool of Materials Science and Engineering, Henan University of Science and Technology, Luoyang 471023, China. E-mail: huangjl@haust.edu.cn
bProvincial and Ministerial Co-construction of Collaborative Innovation Center for Non-ferrous Metal New Materials and Advanced Processing Technology, Luoyang 471023, China
cDivision of Advanced Materials Engineering, Hydrogen and Fuel Cell Research Center, Chonbuk National University, Jeonbuk, South Korea
First published on 6th July 2021
Abstract
Tungsten trioxide (WO3) nanoarrays with different morphologies were successfully synthesized by a hydrothermal method on an FTO substrate. Various nanostructures of WO3 including nanoflakes, nanoplates, nanoflowers and nanorods were obtained by adjusting only the acidity of the precursor solution. XRD patterns confirmed that the as-prepared orthorhombic WO3·0.33H2O transformed to the monoclinic WO3 phase under annealing at 500 °C. UV-Vis absorbance spectroscopy indicated that the absorption edge of WO3 nanoflowers exhibited a slight red-shift compared to other morphologies of WO3. The obtained WO3 nanoflower arrays exhibit the highest photocurrent density and photocatalytic degradation activity towards methylene blue. Finally, the mechanism of the photocatalytic degradation of methylene blue by WO3 is discussed.
1 Introduction
Methylene blue (MB) is a type of water-soluble polycyclic aromatic dye, which is extensively used in dyestuff, textile and dyeing industry.1 The dye wastewater with large chromaticity and high organic concentration discharged from the dyestuff and textile industry is considered a dangerous pollutant to the environment. Semiconductor photocatalysis (PC) and photoelectrocatalysis (PEC) have been proved to be efficient and promising for the degradation of organic contaminants.2–4 It is worth noting that PEC is the combination of photocatalysis with electrocatalysis technologies by applying a biased voltage, which can maximize the utilization of photocatalysts and is a more attractive method in degrading organic pollutants.5 Tungsten trioxide (WO3) as a promising n-type semiconductor has been extensively researched in the photocatalysis field due to its remarkable stability in acid aqueous solutions, high electron mobility, resistibility to light corrosion, moderate band gap and low cost.6The morphology and structure of the WO3 materials have critical influence on the photocatalytic and electrocatalytic properties.7 Extensive research efforts have been done to synthesize numerous morphological WO3 materials via different methods, such as one-dimensional (1D) nanostructured nanorods (NRs), nanowires (NMs) and nanotubes (NTs),8–10 two-dimensional (2D) nanostructured nanoflakes (NFs), and nanoplates (NPs).11,12 However, there are relatively fewer studies on the synthesis of three-dimensional (3D) materials. Also, the effects of the WO3 array crystal morphology with various dimensions on the photocatalytic properties have not been systematically studied.
At present, WO3 crystals with different morphologies are typically obtained by selecting different synthesis methods,13–16 or by changing the operation parameters, including modifications to the precursor, structure-directing agents, surfactants and solvents.17–20 Due to the composition of precursors and the change in the chemical reaction environment, the obtained WO3 crystals showed poor reproducibility on the array film quality, photocatalytic and photoelectrocatalytic performances.21,22 Therefore, it is necessary to develop an efficient and highly reproducible method to produce morphology-controlled WO3 crystals. The metatungstate anion [H2W12O40]6− of the ammonium metatungstate (AMT), known as a KEGGIN anion structure with a “tetrahedral cavity” in its center, endows the AMT with exceptional structural configurations.23 The unique molecular structure makes AMT relatively stable under ambient conditions.24
In this study, chemically stable AMT was used as the tungsten source, and a series of diversified morphology WO3 photocatalysts were successfully synthesized in the same reaction system. The WO3 with different morphologies including nanoflakes, nanoplates, nanoflowers, and nanorods were obtained by only adjusting the acidity of the hydrothermal precursor solution. Their photoelectric and photocatalytic properties were investigated. Moreover, the mechanism of photocatalytic degradation was investigated.
2 Materials and methods
2.1 Preparation of WO3 arrays with different morphologies
All reagents were of analytical grade and used without any further purification. An FTO glass substrate (2 × 5 cm2) was cleaned using acetone, absolute ethanol and deionized water, separately. 0.5 g of ammonium metatungstate hydrate ((NH4)6H2W12O40·xH2O) was dissolved in 40 mL deionized water by magnetic stirring. 1–7 mL of 3 M concentrated hydrochloric acid (HCl) was slowly added to the above solution and stirred for 5 min. 2 mL of hydrogen peroxide (H2O2, 30%) was dropped into the solution and adjusted its volume to 50 mL using deionized water, followed by stirring for 1 h. The reaction solution was then poured into a 43 mL Teflon-lined stainless steel autoclave with the FTO substrate and kept at 160 °C for 4 h. After reaction, the autoclave was cooled down to room temperature. The product was filtered and dried at 60 °C for 10 h. Finally, the samples were annealed at 500 °C for 1 h. The as-prepared WO3 arrays were referred to as W-x (x (mL) = 1, 2, 4, 5, 6, and 7), where x is the volume of HCl.2.2 Characterization
X-ray diffraction (XRD) measurements were conducted on a Bruker D8 Advanced diffractometer with Cu Kα radiation. Field emission scanning electron microscopy (FESEM) and energy dispersive X-ray spectroscopy (EDS) were determined using JEOL JSM-7800F instruments. UV-Vis diffuse reflectance spectra (UV-Vis DRS) were recorded using a UV-2600 spectrometer. Photoluminescence (PL) spectra were obtained on a Hitachi F-280 fluorescence spectrophotometer at the excitation wavelength at 325 nm.2.3 Photoelectrochemical measurements
The photoelectrochemical measurements of WO3 arrays were performed in a CHI660E electrochemical workstation using a standard three-electrode cell. The as-synthesized WO3 arrays were used as the working electrodes, a platinum net was used as the counter electrode and Ag/AgCl was used as the reference electrode. The aqueous solution of 0.5 M Na2SO4 was used as an electrolyte. The illumination source used was a 500 W Xe arc lamp (CEL-HXF300) with a AM 1.5 G filter. The measured potentials vs. Ag/AgCl were converted to the potentials vs. reversible hydrogen electrode (RHE) using the following Nernst equation:25| ERHE = EAg/AgCl + 0.059pH + E0Ag/AgCl |
2.4 Photocatalytic and photoelectrocatalytic degradation measurements
The degradation experiment was carried out using the same three-electrode system described above. The photocatalytic and photoelectrocatalytic activity of these WO3 arrays with different morphologies were evaluated by the degradation of methylene blue (MB). The initial concentration of MB was 10 mg L−1, and the electrolyte was 0.1 mol L−1 Na2SO4. First, magnetic stirring was carried out in dark for 30 min to achieve the equilibrium of adsorption and desorption. After certain time intervals during irradiation, 3 mL of the degradation was taken to analyze the concentration MB using a UV-Vis spectrophotometer. The main active species in the photodegradation process were analyzed by adding different radical scavengers. Here, 1 mmol ammonium oxalate (AO), methanol (MT), and p-benzoquinone (p-BQ) were used as a hole (h+) scavenger, hydroxyl radical (·OH) scavenger, and superoxide radical (·O2−) scavenger, respectively.3 Result and discussion
3.1 Morphology and structure
The WO3 arrays with different morphologies after being annealed were confirmed by FESEM, as shown in Fig. 1. It can be seen that the WO3 nanoarrays are nearly vertically aligned on the FTO substrates, and exhibited strong adhesion to the FTO substrate. When the volume of HCl was 1 mL, it showed a uniform array of nanoflake structure. The widths and thicknesses of the nanoflakes were about 2.5 μm and 150 nm, respectively (Fig. 1a). With an increase in the volume of HCl, the thicknesses of the nanoflakes increased, while the morphology changed to a nanoplate array structure (Fig. 1b–d). When the volume of HCl is 5 mL, regular uniform WO3 nanoplates were obtained, and the thicknesses increased to 300 nm (Fig. 1d). As the volume of HCl is added up to 6 mL, the morphology of WO3 turned into nanoflowers and each nanoflower is regularly composed of six nanoplates of equal size (Fig. 1e). However, when the amount of HCl increases to 7 mL, the morphology of WO3 turns into a nanorod array structure (Fig. 1f).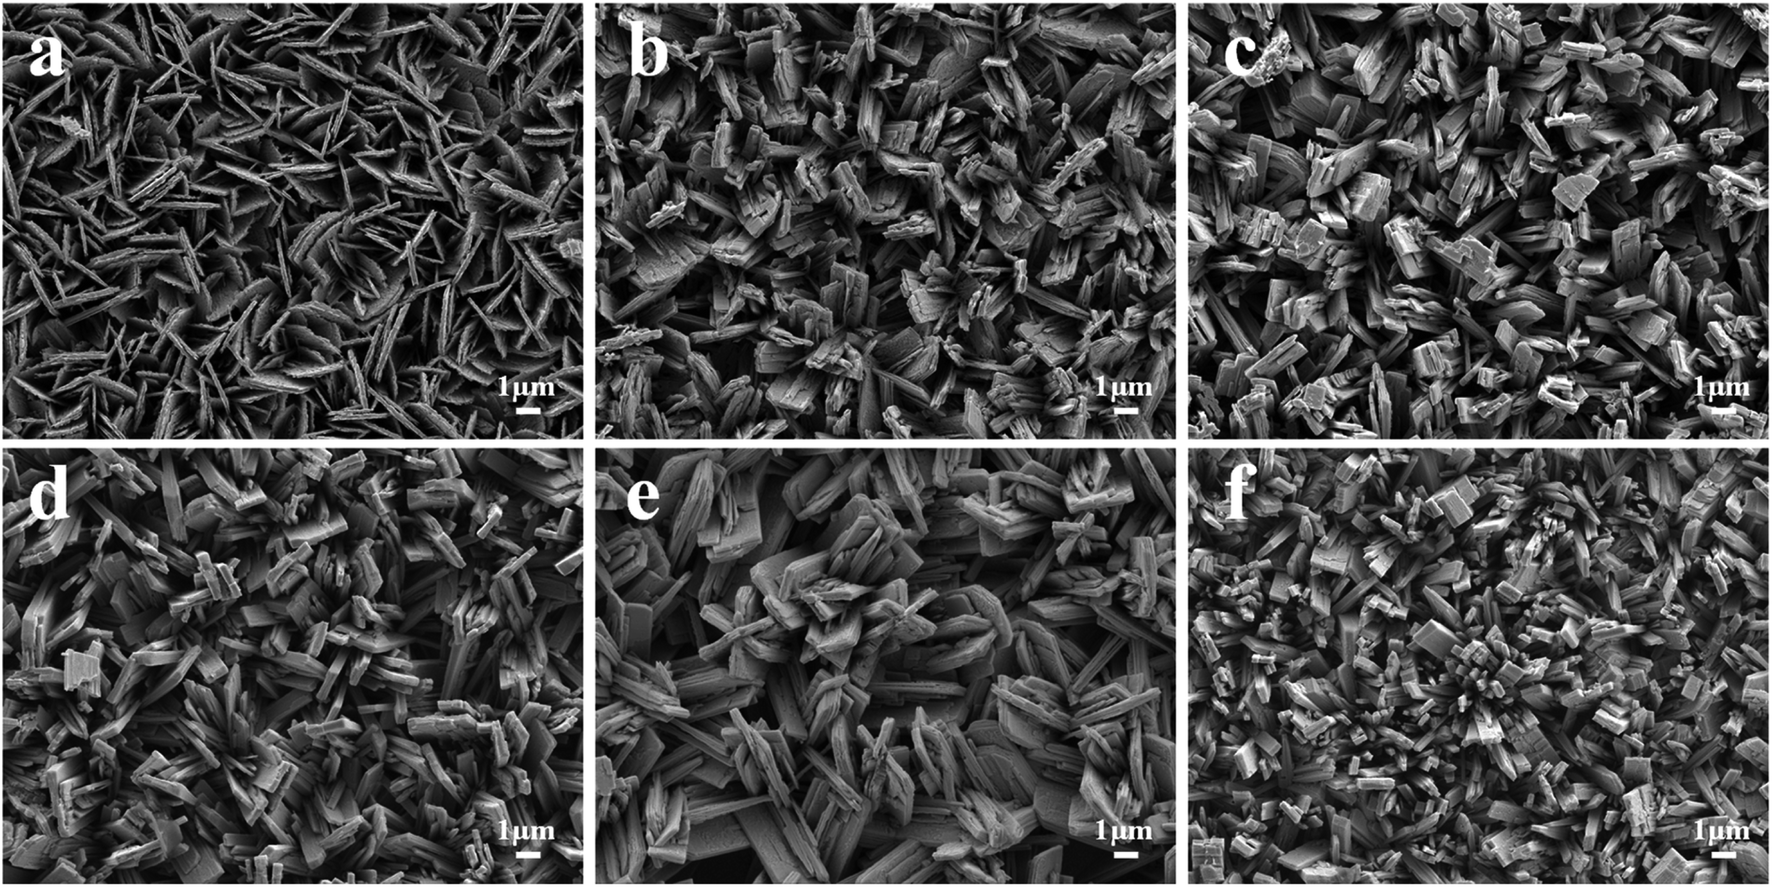 | ||
| Fig. 1 FESEM images of (a) W-1, (b) W-2, (c) W-4, (d) W-5, (e) W-6, (f) W-7. | ||
Fig. 2 shows the low-magnification FESEM image and the EDS pattern of the W-6 sample. As shown in Fig. 2b, there were no impurity elements except W and O, indicating that the sample prepared by the hydrothermal reaction is tungsten oxide. The preparation of WO3 with different morphologies on FTO is illustrated in Fig. 3. The pH value affects the solubility of a substance and influences the growth of the crystal in a hydrothermal reaction.26 Therefore, different WO3 morphologies were obtained by adjusting the pH values of the precursor solutions.
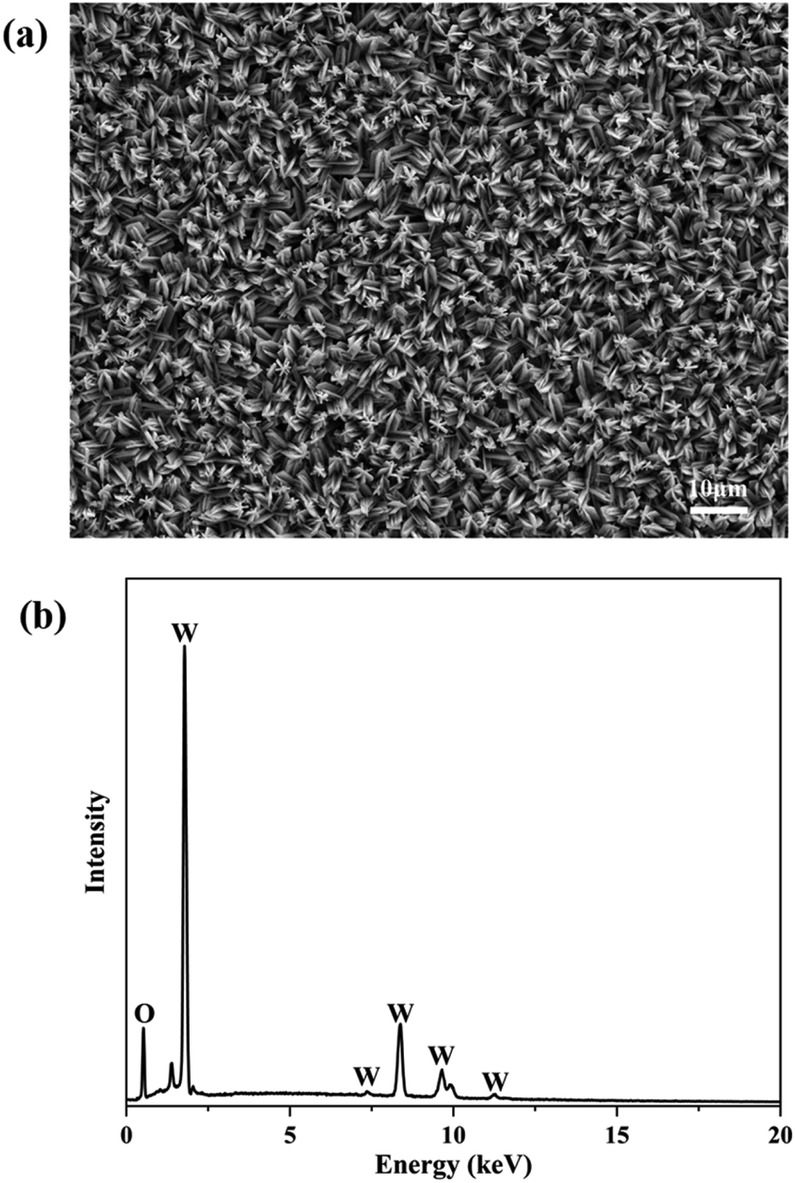 | ||
| Fig. 2 (a) Low-magnification FESEM image and (b) EDS pattern of W-6. | ||
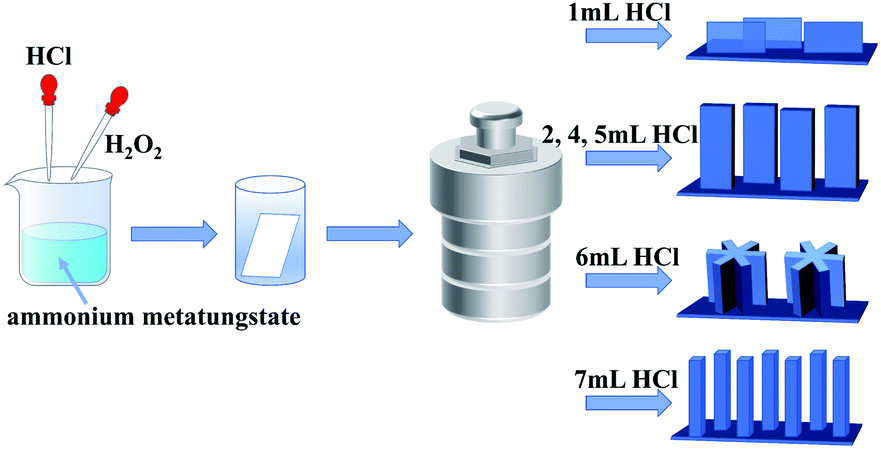 | ||
| Fig. 3 Schematic of the WO3 arrays on FTO. | ||
Fig. 4 shows the XRD patterns of the as-prepared and annealed WO3 nanoarrays. All the as-prepared arrays obtained by the hydrothermal reaction with different pH values were orthorhombic WO3·0.33H2O (JCPDS no. 54-1012). The diffraction peaks with 2θ values at 18.1°, 22.9°, 24.1°, 28.1° and 36.6° were indexed to the (111), (020), (002), (202) and (222) facets, respectively (Fig. 4a). After being annealed, the diffraction peaks of all samples are indexed to the monoclinic WO3 (JCPDS no. 43-1035), and three peaks at 23.1°, 23.5° and 24.3° corresponded to the (002), (020) and (200) facets (Fig. 4b). The intensive and sharp diffraction feature of WO3 samples showed excellent crystallinity.27 The chemical composition of orthorhombic WO3·0.33H2O changed and transformed to a stable monoclinic WO3 after annealing.28 According to the XRD patterns, the (002), (020) and (200) facets are the main features in monoclinic WO3. The surface energy order was (002) > (020) > (200), which indicates that the (002) facet in monoclinic WO3 has the largest surface energy as the most reactive surface.29 Based on the peak areas of the (002), (020) and (200) facets, the proportion of the (002) facet was calculated. The calculated proportions of the exposed (002) facet of WO3 are about 6.96% (W-1), 9.77% (W-2), 9.53% (W-4), 13.06% (W-5), 14.81% (W-6), 6.92% (W-7). Therefore, the hexagonal flower-like (W-6) WO3 exposes more (002) facets.
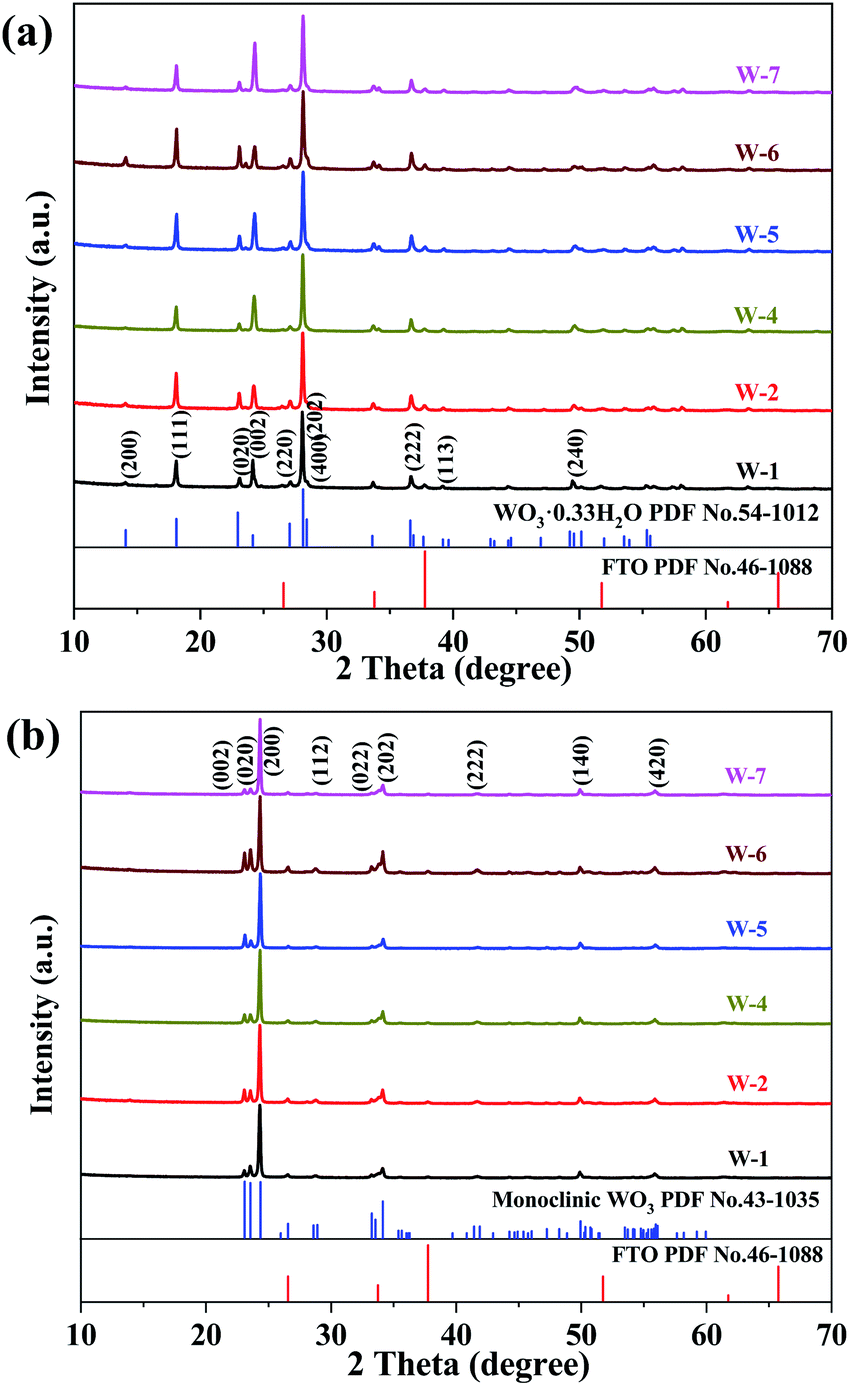 | ||
| Fig. 4 XRD patterns of the WO3 arrays (a) as-prepared and (b) annealed. | ||
3.2 Optical properties
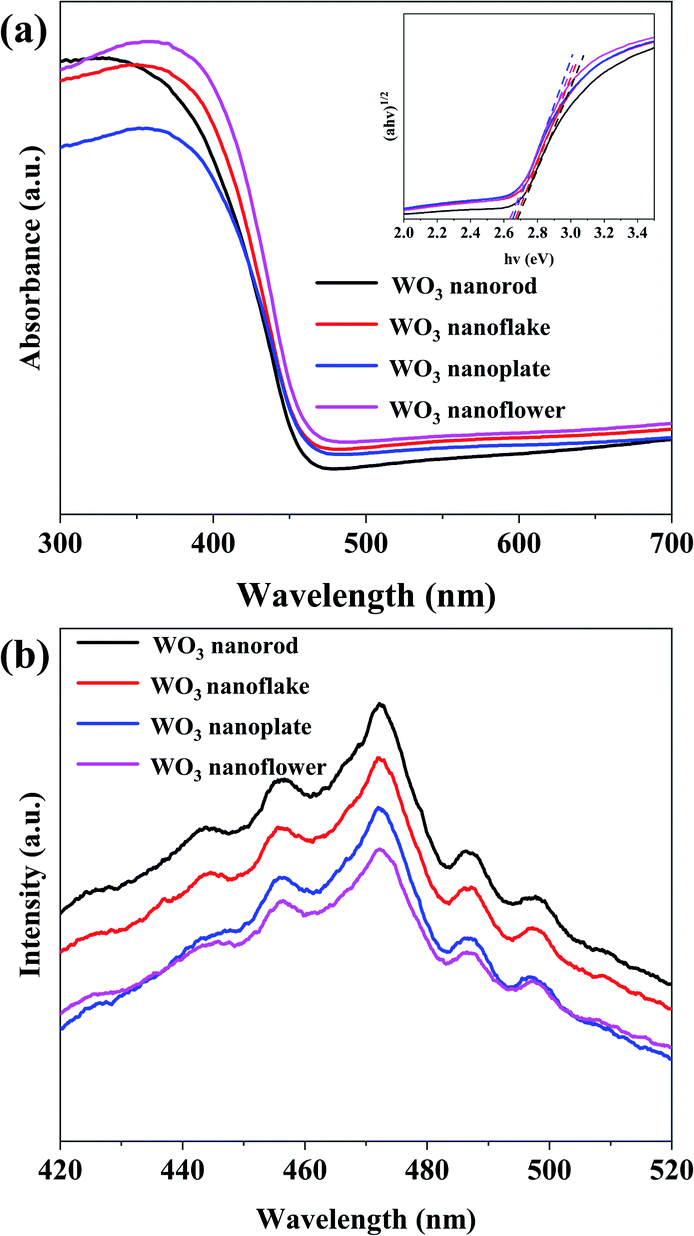
The UV-Vis absorption spectra and PL spectra of the annealed WO3 arrays are illustrated in Fig. 5. The inset in Fig. 5a is the corresponding Tauc plots of band gap. These four different morphology arrays with nanoflake (W-1), nanoplate (W-5), nanoflower (W-6), and nanorod (W-7) have almost similar absorption spectra, and the absorption edges is at ca. 466 nm. The optical band gap (Eg) of the WO3 samples could be calculated using the equation:30| (αhν)1/2 = A(hν − Eg) |
 | ||
| Fig. 5 (a) UV-Vis absorption spectra and (b) room temperature PL spectra of the annealed WO3 arrays. | ||
The recombination of photogenerated charge carriers was evaluated via PL measurements.32 Fig. 5b shows the PL spectra of WO3 arrays excited at 325 nm light at room temperature. It can be seen that the WO3 nanoflowers (W-6) showed a lower fluorescence peak, indicating that the recombination probability of photo-excited electron hole pairs is lower. In one word, the more (002) facet of the WO3 nanoflower (W-6) is beneficial to the separation of photo-excited electrons and holes, and more photogenerated carriers participate in the photoelectrocatalytic reaction.
3.3 Photoelectrochemical performances
The linear sweep voltammograms (LSV) (Fig. 6a) and amperometry I–t curve (Fig. 6b) of the annealed WO3 were measured as photoanode materials. The photocurrent density of the WO3 nanorod (W-7) photoanode is 0.43 mA cm−2 at 1.23 V vs. RHE, while that of the nanoflake (W-1) and nanoplate (W-5) were 0.67 and 0.72 mA cm−2, indicating that the morphology engineering of the WO3 arrays has important implications on PEC performance. Moreover, the nanoflower (W-6) exhibits the highest photocurrent density, reaching 1.10 mA cm−2 at 1.23 V vs. RHE. The photocurrent increase is mainly due to the higher exposed (002) facets, and 3D nanoflowers exhibit unique optical properties, which provide more reaction sites and enhanced charge transport.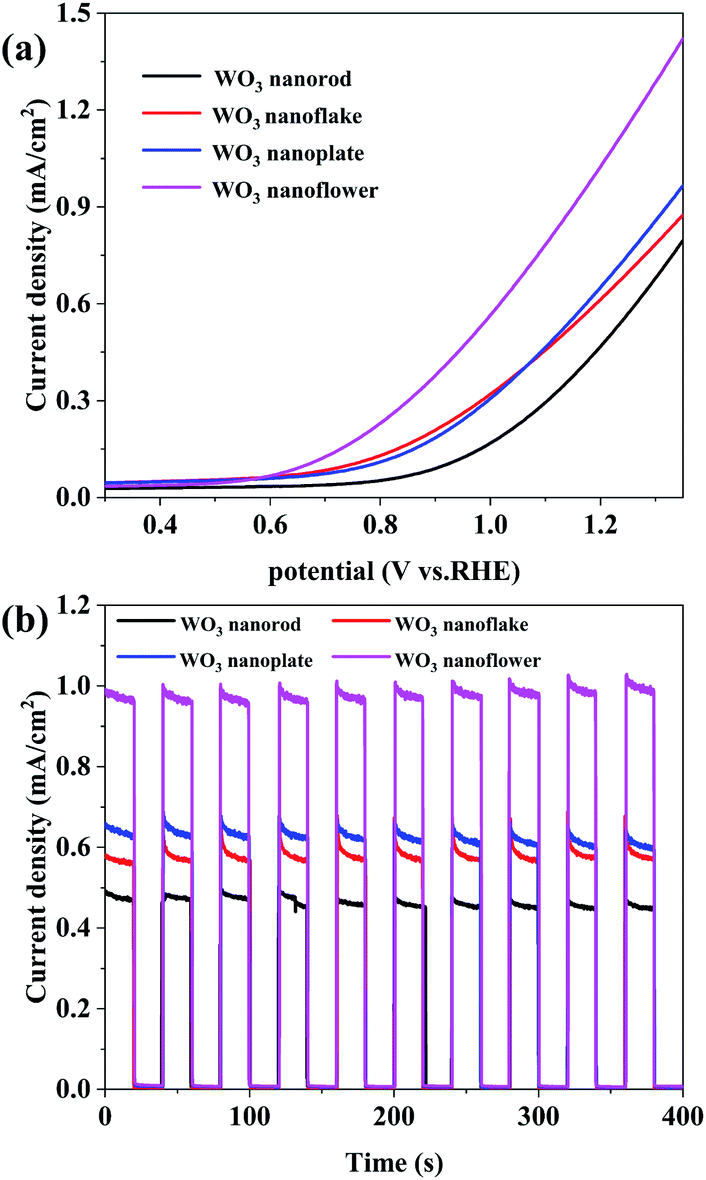 | ||
| Fig. 6 (a) Linear sweep voltammetry (LSV) curves of the WO3 arrays. (b) Amperometric I–t curve of the WO3 arrays at 1.2 V vs. RHE. | ||
The photocurrent density–time (I–t) curves shown in Fig. 6b are obtained to determine the photocurrent stability of the WO3 arrays. Clearly, the photocurrent densities get close to zero when the light is off, and they increase rapidly and stabilize at a certain value under illumination. All WO3 arrays showed fast and uniform photocurrent response.33 The four photoanode have similar curves and more photocurrent stability, indicating that it a good method to obtain stable WO3 arrays with ammonium metatungstate. Fig. S1† shows the electrochemical impedance spectroscopy (EIS) of the WO3 arrays, and the semicircle radius in the Nyquist curve reflects the charge transfer at the electrode/electrolyte interface. The WO3 nanoflower shows a smaller semicircle radius, which indicates lower charge transfer resistance and higher separation efficiency of photogenerated electron hole pairs.
3.4 Photocatalytic and photoelectrocatalytic activity
The results of MB degradation are shown in Fig. 7. Fig. 7a and b show the photocatalytic (PC) activity (illumination without bias) of the WO3 arrays and the first order kinetics curve fitting. It can be seen that the WO3 nanoflowers have the highest photocatalytic activity, which degrade 66.39% of MB within 80 min. The degradation efficiencies of WO3 nanoplates, nanoflakes and nanorods are 58.64%, 55.09% and 45.59%, respectively, proving that the photocatalytic activity is decided by the morphology. The photocatalytic degradation of MB by WO3 arrays follow the linear first-order kinetics equation:34| ln(C0/C) = kt |
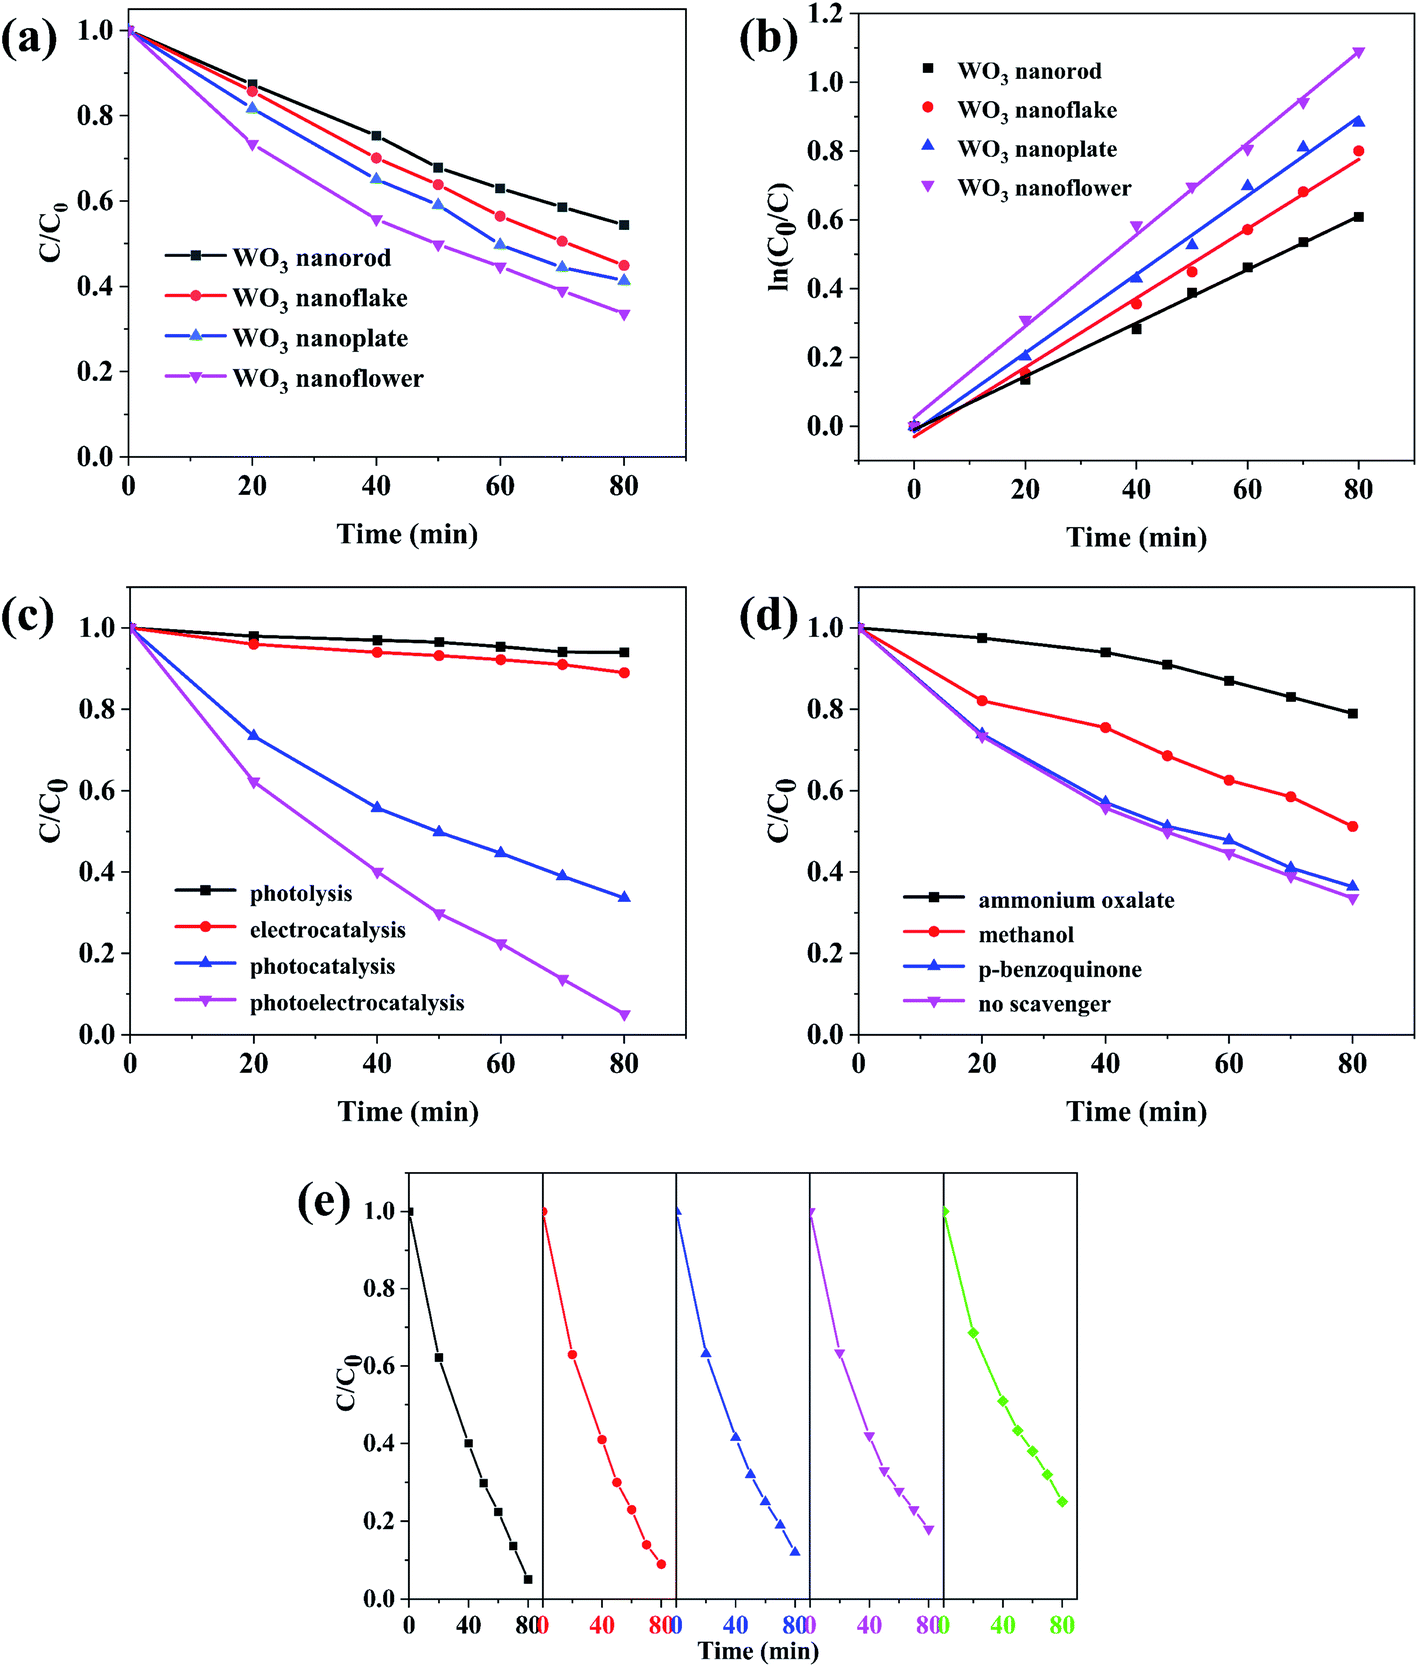 | ||
| Fig. 7 (a) PC degradation of MB and (b) the corresponding kinetic curves by different WO3 morphology films. (c) Degradation of MB via various techniques using WO3 nanoflowers. (d) Photocatalytic degradation of MB over WO3 nanoflowers using different scavengers. (e) Durability of the WO3 nanoflower photoanode for the degradation of MB. | ||
Fig. 7c shows the degradation of MB with various techniques using WO3 nanoflowers. After 80 min, only 6% of MB was removed by direct photolysis, showing that MB is not easy to degrade under solar illumination. The photoelectrocatalysis (PEC) degradation rate of the MB increased to 94.9% after applying an electrical bias potential of 0.8 V to the WO3 nanoflower array electrode, which can be attributed to avoid the recombination of electron–hole by electrical bias potentials. Therefore, the synergistic effects of photocatalysis (PC) and electrooxidation (EC) can significantly improve the degradation efficiency of MB.
The effects of different radical scavengers on the photocatalytic degradation of MB are shown in Fig. 7d. The photocatalytic efficiency noticeably decreased after adding ammonium oxalate, indicating that h+ was the dominant active species. The degradation efficiency of MB decreased by 17.59% (to 48.8%) after methanol addition, this suggests that ·OH could have some effects on photocatalytic efficiency. When p-benzoquinone was added to the reaction solution, the photocatalytic activity was similar to that of the sample without scavengers, confirming that ·O2− was not an active species for MB degradation. The main reason may be that the conduction band of WO3 is more positive than that of E(O2/·O2−) (−0.33 eV/NHE),37 so electrons could not react with O2 to generate ·O2−. The valence band of WO3 is more positive than E(·OH/OH−) and E(·OH/H2O), and the holes in the VB of WO3 can react with OH− and H2O2 to generate ·OH.38 Moreover, the photogenerated holes generated by WO3 can degrade MB directly.
The photoelectrocatalysis stability of the WO3 nanoflower array for MB degradation was measured by the cyclic experiment (Fig. 7e). After five cycles, the degradation rate of WO3 array was 79%, decreased by 16.7%. Moreover, the XRD spectra and FESEM images of WO3 after cyclic degradation are shown in Fig. S2.† There is no difference in phase and morphology before and after catalysis. The results indicate that the WO3 arrays is stable.
4 Conclusions
Different morphologies of vertically WO3 nanoarrays were successfully synthesized on FTO substrates via a one-step hydrothermal process. The morphology of WO3 was sensitive to the acidity of the solution and changed from nanoflakes, nanoplates and nanoflowers to nanorods as the volume of HCl increased from 1 mL to 7 mL. Particularly, WO3 nanoflowers demonstrated the highest photocurrent density performance compared to other morphologies. The enhanced charge transport and the specific WO3 hexagonal nanoflower contributes to the significant PEC activity. Moreover, the WO3 nanoflower array exhibited better performance than other morphologies in MB photocatalytic degradation, which demonstrated that the morphology of WO3 plays an important role in the PEC and photocatalytic performance. The different scavenger degradation MB in WO3 nanoflowers confirm that the h+ radical species play a vital role in the reaction.Conflicts of interest
There are no conflicts to declare.Acknowledgements
This work has been financially supported by the Provincial and Ministerial Co-construction of Collaborative Innovation Center for Non-ferrous Metal New Materials and Advanced Processing Technology.References
- M. Rafatullah, O. Sulaiman, R. Hashim and A. Ahmad, J. Hazard. Mater., 2010, 177, 70–80 CrossRef CAS PubMed.
- S. Pal, S. Maiti, U. N. Maiti and K. K. Chattopadhyay, CrystEngComm, 2015, 17, 1464–1476 RSC.
- W. Zhang, B. S. Naidu, J. Z. Ou, A. P. O'Mullane, A. F. Chrimes, B. J. Carey, Y. Wang, S.-Y. Tang, V. Sivan, A. Mitchell, S. K. Bhargava and K. Kalantar-zadeh, ACS Appl. Mater. Interfaces, 2015, 7, 1943–1948 CrossRef CAS.
- B. M. Pirzada, Pushpendra, R. K. Kunchala and B. S. Naidu, ACS Omega, 2019, 4, 2618–2629 CrossRef CAS.
- N. Baram, D. Starosvetsky, J. Starosvetsky, M. Epshtein, R. Armon and Y. Ein-Eli, Electrochem. Commun., 2007, 9, 1684–1688 CrossRef CAS.
- G. Zheng, J. Wang, H. Liu, V. Murugadoss, G. Zu, H. Che, C. Lai, H. Li, T. Ding and Q. Gao, Nanoscale, 2019, 11, 18968–18994 RSC.
- B. Miao, W. Zeng, Y. Mu, W. Yu, S. Hussain, S. Xu, H. Zhang and T. Li, Appl. Surf. Sci., 2015, 349, 380–386 CrossRef CAS.
- J. Wang, E. Khoo, P. S. Lee and J. Ma, J. Phys. Chem. C, 2008, 112, 14306–14312 CrossRef CAS.
- K. Zhu, H. He, S. Xie, X. Zhang, W. Zhou, S. Jin and B. Yue, Chem. Phys. Lett., 2003, 377, 317–321 CrossRef CAS.
- P. M. Rao, I. S. Cho and X. Zheng, Proc. Combust. Inst., 2013, 34, 2187–2195 CrossRef CAS.
- G. Zhang, W. Guan, H. Shen, X. Zhang, W. Fan, C. Lu, H. Bai, L. Xiao, W. Gu and W. Shi, Ind. Eng. Chem. Res., 2014, 53, 5443–5450 CrossRef CAS.
- D. Chen, X. Hou, H. Wen, Y. Wang, H. Wang, X. Li, R. Zhang, H. Lu, H. Xu and S. Guan, Nanotechnology, 2009, 21, 035501 CrossRef PubMed.
- M. B. Johansson, B. Zietz, G. A. Niklasson and L. Österlund, J. Appl. Phys., 2014, 115, 213510 CrossRef.
- H. Habazaki, Y. Hayashi and H. Konno, Electrochim. Acta, 2002, 47, 4181–4188 CrossRef CAS.
- J.-H. Ha, P. Muralidharan and D. K. Kim, J. Alloys Compd., 2009, 475, 446–451 CrossRef CAS.
- N. Le Houx, G. Pourroy, F. Camerel, M. Comet and D. Spitzer, J. Phys. Chem. C, 2010, 114, 155–161 CrossRef CAS.
- S. G. Kumar and K. K. Rao, Appl. Surf. Sci., 2017, 391, 124–148 CrossRef CAS.
- S. Adhikari, D. Sarkar and H. S. Maiti, Mater. Res. Bull., 2014, 49, 325–330 CrossRef CAS.
- A. Yan, C. Xie, D. Zeng, S. Cai and M. Hu, Mater. Res. Bull., 2010, 45, 1541–1547 CrossRef CAS.
- T. Zhang, J. Su and L. Guo, CrystEngComm, 2016, 18, 8961–8970 RSC.
- J. Feng, X. Zhao, B. Zhang, G. Yang, Q. Qian, S. S. K. Ma, Z. Chen, Z. Li and Y. Huang, Sci. China Mater., 2020, 63, 2261–2271 CrossRef CAS.
- M. Rashad and A. Shalan, Appl. Phys. A: Mater. Sci. Process., 2014, 116, 781–788 CrossRef CAS.
- J. Pavlov, W. Braida, A. Ogundipe, G. O'connor and A. B. Attygalle, J. Am. Soc. Mass Spectrom., 2009, 20, 1782–1789 CrossRef CAS.
- S. K. Biswas, J.-O. Baeg, S.-J. Moon, K.-j. Kong and W.-W. So, J. Nanopart. Res., 2012, 14, 1–12 CrossRef.
- F. Cui, Y. Zhang, H. A. Fonseka, P. Promdet, A. I. Channa, M. Wang, X. Xia, S. Sathasivam, H. Liu and I. P. Parkin, 2020, arXiv preprint arXiv:2012.09149.
- X. Su, F. Xiao, J. Lin, J. Jian, Y. Li, Q. Sun and J. Wang, Mater. Charact., 2010, 61, 831–834 CrossRef CAS.
- H. J. Ensikat, M. Boese, W. Mader, W. Barthlott and K. Koch, Chem. Phys. Lipids, 2006, 144, 45–59 CrossRef CAS PubMed.
- S. S. Kalanur, Y. J. Hwang, S. Y. Chae and O. S. Joo, J. Mater. Chem. A, 2013, 1, 3479–3488 RSC.
- Y. P. Xie, G. Liu, L. Yin and H.-M. Cheng, J. Mater. Chem., 2012, 22, 6746–6751 RSC.
- Y. Peng, Q.-G. Chen, D. Wang, H.-Y. Zhou and A.-W. Xu, CrystEngComm, 2015, 17, 569–576 RSC.
- J. Y. Zheng, G. Song, J. Hong, T. K. Van, A. U. Pawar, D. Y. Kim, C. W. Kim, Z. Haider and Y. S. Kang, Cryst. Growth Des., 2014, 14, 6057–6066 CrossRef CAS.
- G. Plechinger, P. Nagler, A. Arora, R. Schmidt, A. Chernikov, A. G. Del Águila, P. C. Christianen, R. Bratschitsch, C. Schüller and T. Korn, Nat. Commun., 2016, 7, 1–9 Search PubMed.
- Y. Hou, F. Zuo, A. P. Dagg, J. Liu and P. Feng, Adv. Mater., 2014, 26, 5043–5049 CrossRef CAS PubMed.
- F. Liang and Y. Zhu, Appl. Catal., B, 2016, 180, 324–329 CrossRef CAS.
- R. Wadhene, A. Lamouchi, I. B. Assaker, J. B. Naceur, M. Martínez-Huerta and R. Chtourou, Inorg. Chem. Commun., 2020, 122, 108298 CrossRef CAS.
- M. H. Elsayed, T. M. Elmorsi, A. M. Abuelela, A. E. Hassan, A. Z. Alhakemy, M. F. Bakr and H.-H. Chou, J. Taiwan Inst. Chem. Eng., 2020, 115, 187–197 CrossRef CAS.
- H. Liang, C. Lv, H. Chen, L. Wu and X. Hou, RSC Adv., 2020, 10, 45171–45179 RSC.
- X. Li, J. Yu and M. Jaroniec, Chem. Soc. Rev., 2016, 45, 2603–2636 RSC.
Footnote |
| † Electronic supplementary information (ESI) available. See DOI: 10.1039/d1ra03149j |
| This journal is © The Royal Society of Chemistry 2021 |