 Open Access Article
A novel electronic nose for the detection and classification of pesticide residue on apples
Yong Tang†
 *a,
Kunli Xu†
 *a,
Bo Zhao
 a,
Meichao Zhang
 ab,
Chenhui Gong
 a,
Hailun Wan
 a,
Yuanhui Wang
 a and
Zepeng Yang
 a
a
aSchool of Food and Biological Engineering, University of Xihua, Chengdu, Sichuan 610039, China
bBureau of Science, Technology, Agriculture and Livestock, MaoXian, Aba Qiang and Tibetan Autonomous Prefecture, Sichuan 623200, China
First published on 11th June 2021
Abstract
Excessive pesticide residues are a serious problem faced by food regulatory authorities, suppliers, and consumers. To assist with this challenge, this work aimed to develop a method of detecting and classifying pesticide residue on fruit samples using an electronic nose, through the application of three different data-recognition algorithms. The apple samples carried various concentrations of two known pesticides, namely cypermethrin and chlorpyrifos. Data collection was performed using a PEN3 electronic nose equipped with 10 metal oxide semiconductor (MOS) sensors. In order to classify and analyze these pesticide residues on the apple samples, principal component analysis (PCA), linear discriminant analysis (LDA), and support vector machine (SVM) results were combined with sensor output responses to realize MOS sensor array data visualization. The results indicated that all three data-recognition algorithms accurately identified the pesticide residues in the apple samples, with the PCA algorithm exhibiting the best classification and discrimination ability. Consequently, this work has shown that the MOS electronic nose, in combination with data-recognition algorithms, can provide support for the rapid and non-destructive identification of pesticide residues in fruits and can provide an effective tool for the detection of pesticide residues in agricultural products.
1 Introduction
Pesticides are indispensable for the prevention and control of pests, diseases, and weeds, which could otherwise extensively damage agricultural crops. Agricultural industrialization has led to increasing dependence on exogenous control substances such as pesticides, antibiotics, and hormones, however, excessive use of these substances is not only harmful to the environment, but can also lead to excess pesticide residue on agricultural products. The long-term consumption of such pesticide residues in food leads to their accumulation in the human body and, ultimately, the risk of chronic or acute poisoning1 and even carcinogenesis, teratogenesis, and mutation.2Pesticide residue monitoring and detection on fruits is, therefore, among those quality controls that has becoming increasingly in demand before agricultural products enter the market. The technologies related to the detection of pesticide residues have developed rapidly. At present, the detection technology of pesticide residues includes gas chromatography-tandem mass spectrometry,3 and high-performance liquid chromatography,4 liquid and gas chromatography coupled to tandem mass spectrometry5 among others. Physical and chemical detection methods offer high accuracy, but are costly, time-consuming, and require professional detection personnel. Therefore, a simple, quick, nondestructive, inexpensive, and specific detection method must be developed, with good reproducibility and repeatability.6,7
Electronic noses can meet many of these requirements. They offer the advantages of strong objectivity, fast detection speed, simple operation, good reproducibility, and require no complicated pre-treatment of samples. The electronic nose can not only analyze trace odorants and compare odor similarities in samples, but also establish corresponding databases by pre-collecting standard samples, thereby enabling the prediction and evaluation of unknown samples, especially those with complex odor components or odor synergies.8 The electronic nose has been widely used in medicine,9–11 agriculture,12–14 industry,15,16 and environmental protection,17–19 among other fields. Its use in food production has particularly involved in-authenticity identification,20–22 grade identification,23,24 food quality evaluation,25–27 food process monitoring,28–30 microbial contamination research,31–33 shelf-life research,34–36 origin and species identification,37–39 and other aspects of research.
Nonetheless, there is currently a paucity of published research on the applications of electronic nose combined with chemometric methods to determine pesticide residue on fruits and vegetables. Tan et al.40 used a custom-designed electronic nose (e-nose) combined with Principal Component Analysis (PCA) and Fuzzy C Means (FCM) techniques to successfully detect and identify Chilli samples containing different concentrations of profenofos pesticides. Marco et al.41 used a self-made electronic nose system to firstly realize qualitative responses to different pesticides. Tang et al.42 used PEN3 electronic nose combined with partial least square method (PLS) and back propagation (BP) neural network technology to detect and quantify pyrethroid pesticides in tea. Bordbar et al.43 developed an optical-electronic nose, in which the colorimetric sensor array has successfully realized the quantitative detection of low concentration pesticide aerosol. Considering the aforementioned statements, this research aimed to evaluate the residue levels of two pesticides commonly found in apples, namely cypermethrin and chlorpyrifos, by means of an electronic nose.
2 Materials and methods
2.1. Apple samples and chemical materials
Sichuan MaoYuan apple is one of the most popular and best-selling apples in Southwest China. For this study, 400 apple samples of uniform texture, similar weight (150–180 g, transverse diameter 6.5–7.2 cm, vertical diameter 7.7–8.3 cm) and devoid of soft spots were hand-harvested from an organic ecological orchard in MaoYuan, Sichuan Province, China, in the autumn season, October 2019. These apple samples have not been previously contaminated by pesticides and were transported directly to the laboratory of Xihua University after harvest. Forty from the 400 apple samples were then randomly selected for the collection and analysis of fingerprint data with the electronic nose, during which no significant differences were found between them. Then all apples were contaminated with two known pesticides, cyhalothrin and chlorpyrifos.Cypermethrin and chlorpyrifos (Beijing Aobox Biotechnology Co., Ltd. (Beijing, China)), were used throughout the study. Forty-well airtight 600 ml bottles (diameter 9.5 cm, height 12 cm) were obtained from Sichuan Kangchen Plastic Packing Co. Ltd (Pengzhou, China).
2.2. Test design
In China, as in many other countries in the world, the permitted quantity of agricultural residues on fruits and vegetables has been determined to ensure health safety. According to GB2763-2019,44 the maximum permitted residue amounts of cypermethrin and chlorpyrifos on apples are 0.2 ppm and 1 ppm, respectively. The research methodology was as follows:(1) Classification and analysis of blank apple samples, the maximum residues of two kinds of pesticides(cypermethrin 0.2 ppm, chlorpyrifos 1 ppm), and the compound ratio (cypermethrin![[thin space (1/6-em)]](https://www.rsc.org/images/entities/char_2009.gif) :
:![[thin space (1/6-em)]](https://www.rsc.org/images/entities/char_2009.gif) chlorpyrifos = 1
chlorpyrifos = 1![[thin space (1/6-em)]](https://www.rsc.org/images/entities/char_2009.gif) :
:![[thin space (1/6-em)]](https://www.rsc.org/images/entities/char_2009.gif) 9) on apples under the maximum residue of the national standard, by the electronic nose;
9) on apples under the maximum residue of the national standard, by the electronic nose;
(2) Classification and analysis of the two different pesticide residues on apples by electronic nose. Two distinct pesticides and apples were prepared in different concentrations. Five treatments of cypermethrin were set at 0.2, 1, 2, 3, and 4 ppm, respectively. Chlorpyrifos treatments were set at 1, 2, 4, and 8 ppm, respectively.
For data collection with the electronic nose, 40 apple samples were used for each concentration gradient. Therefore, 440 tests were employed for sampling.
2.3. Electronic nose system
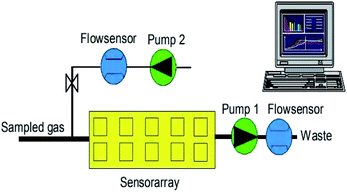
The electronic nose, a device to rapidly detect odors and flavors, is a simplified model of the biological olfactory system. The electronic nose system includes an analytical instrument capable of identifying the volatile odor fingerprint information of a tested substance after an appropriate training period, so as to realize the identification of the substance.The PEN3 electronic nose system (Airsense Analytics, Germany) was used in this experiment. Its main components are a sensor chamber, an array of 10 partially selective metal-oxide semiconductors (MOS) gas sensors (the features of which are listed in Table 1), two positioned pumps (shown in Fig. 1) of which one is used to monitoring the sample gas compounds being sucked through the sensor array, while the other transmits filtered clean air to the sensor array to flush the system, two flow sensors and a pattern recognition system. The PEN3 electronic nose sucks air directly through its internal pump. By using zero-gas and comparing it to the signals from the analyzed sample gas, the effect of the possible drift of the sensor is reduced (differential measuring technique) and, therefore, it requires no pre-treatment.
| Sensor number | Sensor name | Main applications (gas detector) |
|---|---|---|
| S1 | W1C | Aroma component |
| S2 | W5S | Oxynitride |
| S3 | W3C | Ammonia (aromatic component) |
| S4 | W6S | Hydrogen |
| S5 | W5C | Aromatic components of alkane |
| S6 | W1S | Methane |
| S7 | W1W | Sulfide |
| S8 | W2S | Alcohols, aldehydes and ketones |
| S9 | W2W | Aromatic and organic sulfide |
| S10 | W3S | Alkanes |
The experimental conditions for the PEN3 electronic nose were three-phased, as follows: first, the sensor chamber was cleaned with fresh dry air before exposure to the sample volatiles. Next, the volatile of the tested substance was inhaled to saturation and circulated throughout the sensor chamber. When the sensors were exposed to the sample volatiles, their responses changed. During this period, the headspace gas circulated in the sensor chamber until the response of the sensor reached saturation. After a baseline trim, the responses were measured. The sensor values were registered continuously. Finally, the signal was processed by the pattern recognition subsystem and the output was determined.
Before the experiment, a small hole (diameter 1 cm) was drilled into each le buckle bottle, covered over with a sticky silicone patch (diameter 2 cm) to make it airtight. The condition of the equipment was checked before detection began. In this experiment, the headspace suction method was adopted for data collection, and the injection needle was inserted directly into the sample bottle. Apple samples were put into the 600 ml le buckle bottles and left at room temperature for 30 minutes for electronic nose data collection, detection, and analysis. The laboratory temperature was 25 ± 2 °C, the humidity was 50% ± 5%, and the air pressure was consistent with the atmospheric pressure of 101.325 kPa. Detection parameters were set as follows: pre-sampling time 5 s; flush time 120 s; zero-point trim time 10 s; measuring interval time 1 s; chamber flow 300 ml min−1; initial flow 300 ml min−1; measurement time 120 s; in order to ensure the same apple sealing time, a bottle cap was put on every 255 s. After each test, the system conducted zero clearings and standardization before the next headspace sampling began.
PEN3 electronic nose sensor is divided into the forward sensor and the reverse sensor, in which the electrical conductivity of the forward sensor increases with the increase of the concentration of volatile matter in the headspace gas, while the electrical conductivity of the reverse sensor decreases with the increase of the concentration of volatile matter in the headspace gas. The data detected by the electronic nose were the conductivity between G0 (the conductivity of zero gas blowing through the sensor) and G (the conductivity of the sample gas blowing through the sensor). The expression of the response value of the electronic nose sensor was as follows:
 | (1) |
 | (2) |
2.4. Data analysis
The statistical analysis of the raw data collected by the electronic nose sensor. Heat map analysis provided by HEMI software (2014 version, Shanghai Realbio Technology Co., Ltd., Shanghai, China). Loading analysis, principal component analysis (PCA), and linear discriminant analysis (LDA) were provided by the data processing software that came with the PEN3 electronic nose system, and the support vector machine (SVM) method provided by MATLAB software (2014b version, Math Works Ltd, Natick, USA).3 Results and discussion
3.1. Sensor response analysis
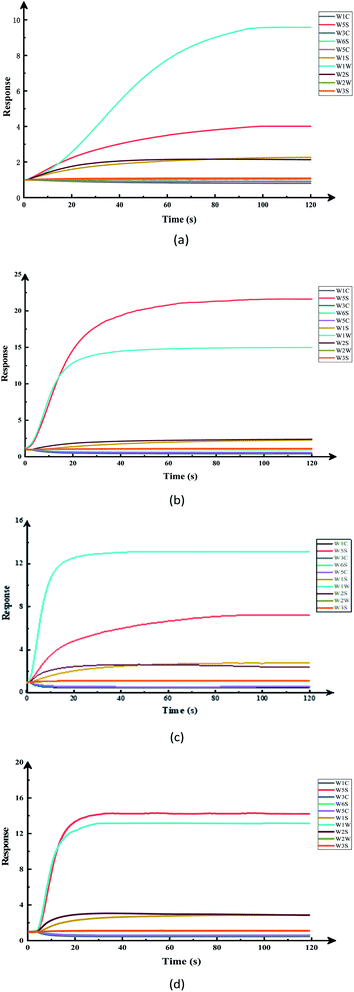
The response values of the different sample sensors of the electronic nose were used as important bases for data analysis. Gas collected from the headspace was identified by the electronic nose MOS sensor and, after noise elimination and data normalization, the relative conductivity of the output value was used for modeling and analysis.Fig. 2 was the original signal response diagram of the electronic nose sensor exposed to different pesticide-treated apple samples, which shows the change of the conductivity of each sensor in the array with the time when the volatile components of the sample reach the measurement chamber. As for the pesticide residues in apples, it was difficult to distinguish them by human senses, and the use of electronic noses can easily show these subtle differences. It can be seen from the figure that after a short initial stage of low conductivity, the response signal of the electronic nose sensor increases dramatically and stabilizes after a period of time, but the stabilization time varies with different samples. Based on the response of all the sensor samples, the conductivity stabilizes after 95 s, and when the response signals of all the sensors were stable, they can be considered for electronic nose data analysis. In this study, the stationary signals of the electronic nose at the time point 115–117 s have been used for electronic nose analysis. This showed that e-nose technology can be used to distinguish the pesticide residues in apples and provide some objective data for them.
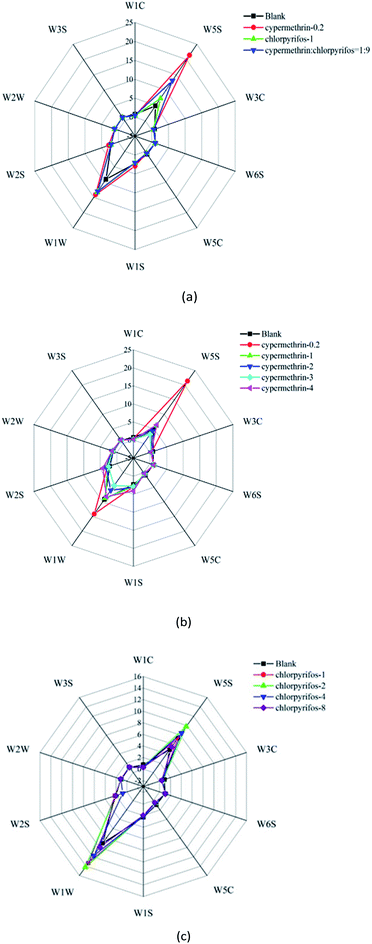
It is evident in Fig. 3(a) that the responses of the sensors to the blank apple sample were smaller than those to the apple samples with pesticide application. Furthermore, it can be seen in Fig. 3(b) and (c) that the response values of the sensors to the pesticides with different concentrations were different, although there appears to be no obvious rule. Therefore, the pattern difference between samples cannot be easily distinguished by the radar chart representation.
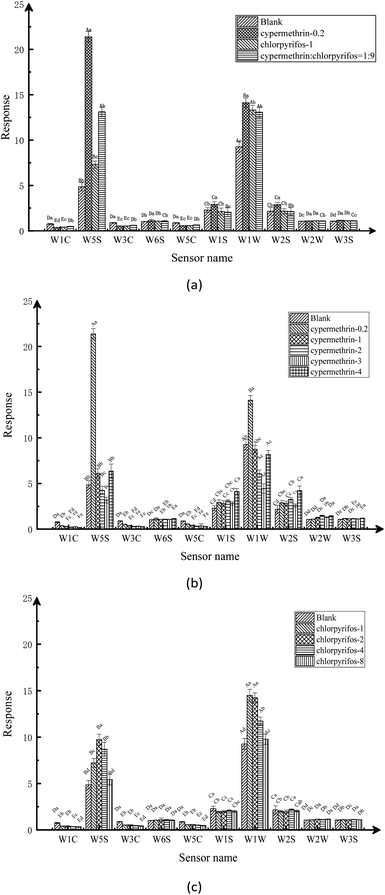
By analyzing the response of the electronic nose sensor, it is recognized from the original signal response graph that there are obvious differences in the response of the sensor array to different samples. The radar maps and bar charts show significant differences in the volatile components of the blank apple samples and the maximum residues of the two kinds of pesticides, the compound ratio on apples under the maximum residue of the national standard, and the two different pesticide residues on the apples, as distinguished by electronic nose. From the radar graph, it can be clearly seen that apple samples treated with different types of pesticides at different concentrations exist obvious model differences. From the bar chart, it can be distinguished that the main volatile components of pesticide residues in apple samples are nitrogen oxides, alkanes, alcohols and sulfides. After stabilization, the absolute value of the odor intensity of the blank apple sample was significantly lower than the absolute value of the pesticide-treated apple sample, which indicates that the stabilization time and response characteristics of the response signal of the electronic nose sensor vary with the sample.
3.2. Heat map clustering analysis
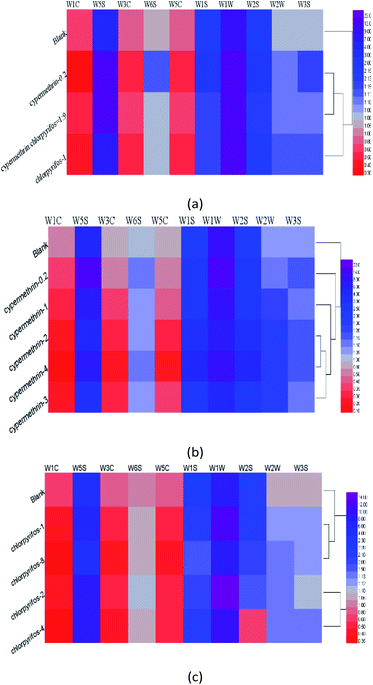
Analysis of the responses of the electronic nose sensors by radar map and bar chart revealed differences between the apple samples without pesticide, and those with different concentrations and different kinds of pesticides. Therefore, further visual clustering analysis was carried out in combination with a heat map. In Fig. 5, each row in the heat maps represents a sample, and each column represents a sensor response strength. Colors ranging from red to purple indicate sensor response intensities from low to high, thus clearly showing the differences between the apple samples through these colour gradients.As shown in Fig. 5(a), there were significant differences between the apple samples without pesticide residues and those different concentrations and types of pesticides. Among all apple samples, the responses to those coded cypermethrin-0.2 and cypermethrin![[thin space (1/6-em)]](https://www.rsc.org/images/entities/char_2009.gif) :
:![[thin space (1/6-em)]](https://www.rsc.org/images/entities/char_2009.gif) chlorpyrifos = 1
chlorpyrifos = 1![[thin space (1/6-em)]](https://www.rsc.org/images/entities/char_2009.gif) :
:![[thin space (1/6-em)]](https://www.rsc.org/images/entities/char_2009.gif) 9 were most similar. In Fig. 5(b) it can be seen that the responses to apple samples with 2 ppm, 3 ppm, and 4 ppm cypermethrin were similar. As shown in Fig. 5(c), the concentrations of chlorpyrifos in apple samples were 1 ppm and 8 ppm, 2 ppm, and 4 ppm, which were different from those in the apple samples without pesticides.
9 were most similar. In Fig. 5(b) it can be seen that the responses to apple samples with 2 ppm, 3 ppm, and 4 ppm cypermethrin were similar. As shown in Fig. 5(c), the concentrations of chlorpyrifos in apple samples were 1 ppm and 8 ppm, 2 ppm, and 4 ppm, which were different from those in the apple samples without pesticides.
3.3. Loading analysis
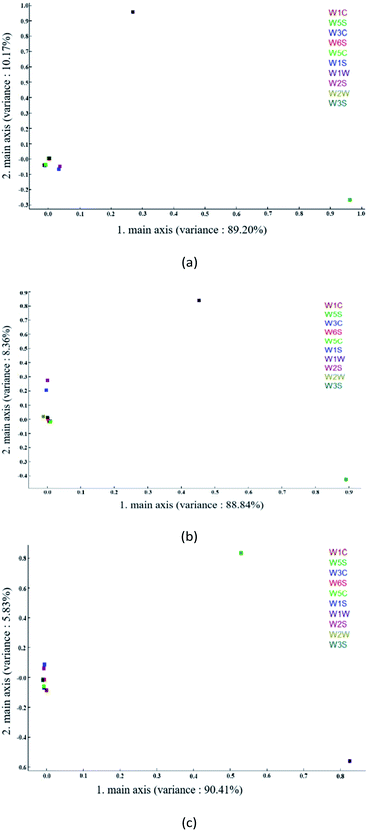
Loading analysis is used to characterize the contribution rate of each sensor in the current discrimination mode. The coordinate distance from the origin point (0,0) explains the contribution rate of each sensor to the sample.46 As can be seen from Fig. 6(a) below, W5S and W1W have higher contribution rates on the first and second principal components, respectively, while W1S and W2S have slightly stronger contributions on the first principal component than the other six sensors. It can be seen from Fig. 6(b) that W5S and W1W have greater contribution rates on the first and second principal components, respectively, and W1S and W2S have slightly stronger contribution rates on the second principal components than the other six sensors. It can be seen from Fig. 6(c) that W1W and W5S have larger contribution rates on the first and second principal components, respectively, while W1S and W2S have slightly stronger contribution rates on the second principal components than the other six sensors. Since LDA performs supervised dimensionality reduction classification, in this study, the classification effect of LDA was poor if the sensors with a small contribution rate were eliminated.3.4. Principal component analysis (PCA)
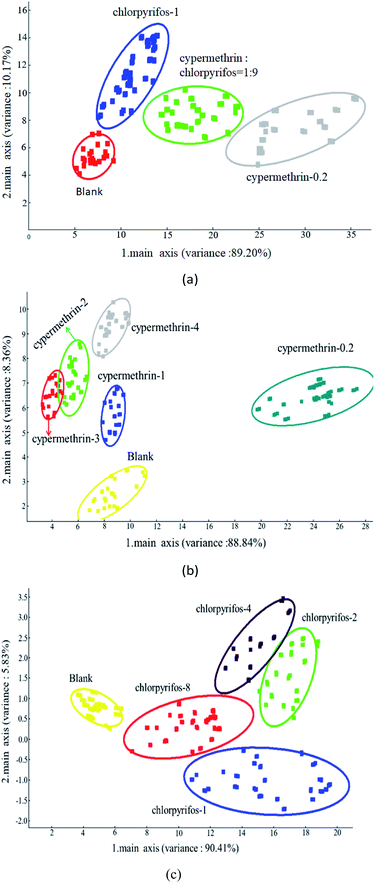
PCA, also popularly known as the dimensionality reduction analysis method, is an analytical method of unsupervised learning based on maximum variance and minimum correlation, in which the principal component extraction (data reduction) of the most important information in the database is performed to reduce multidimensional data. The feature vector direction is reduced to low-dimensional (two-dimensional or three-dimensional) and projected to the visualization space to realize dimensionality reduction classification of the cube. After the training transformation, similar samples will be projected to be close to each other by dimensionality reduction to determine the difference between sample groups. For highly collinear data, some PCA retain the same information as many of the original variables, and allow the distribution of samples and variables to be easily plotted and visually analyzed. This unsupervised exploratory technique is usually applied prior to any other prediction method.47–49 In an electronic nose, PCA is applied to extract the principal components from the odor fingerprint information database detected by the MOS sensor for reduction, and the visual data analysis graph is displayed on the interface after training and transformation.The classification of samples without pesticide and with the maximum pesticide residue of the national standard revealed significant differences between the various apple samples. PC1 and PC2 were 89.20% and 10.17%, respectively, and explained 99.37% of data variance overall. As shown in Fig. 7(a), the sensors could detect these types of apple samples, which were clearly discriminable from each other, and the sensor responses did not overlap. In classifying apple samples without pesticide and those with different concentrations of cypermethrin residue, PC1 and PC2 were 88.84% and 8.36%, respectively, accounting for 97.20% of the variance in the data overall. As shown in Fig. 7(b), all apple samples were well detected; apple samples without pesticide and with different concentrations of cypermethrin were discriminable from each other, and only apple samples with 2 ppm and 3 ppm cypermethrin were not discriminated as the sensors were incapable of discriminating them.
In addition, in order to classify apple samples without pesticide and with different concentrations of chlorpyrifos residue, PC1 and PC2 were 90.41% and 5.83%, respectively, accounting for 96.24% of the variance in the data overall. As shown in Fig. 7(c), all apple samples were well detected; apple samples without pesticide and with different concentrations of chlorpyrifos were discriminable from each other, among all apple samples, only apple samples with 2 ppm and 4 ppm chlorpyrifos were not discriminated as the sensors were incapable of discriminating them.
3.5. Linear discriminant analysis (LDA)
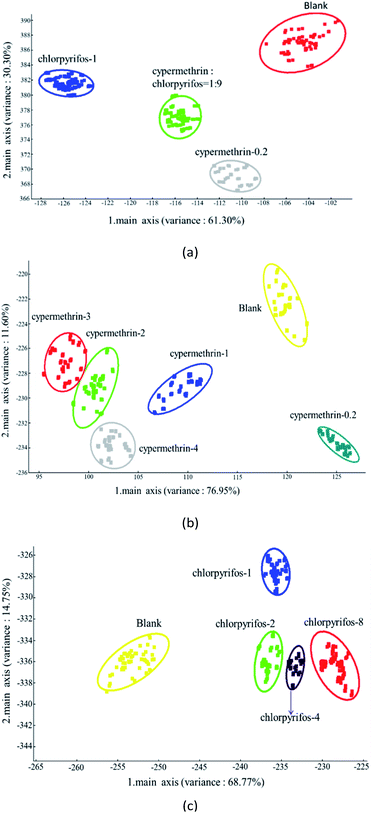
LDA is a dimensionality reduction classification technique that makes full use of prior knowledge. Its classification principle is to maximize the ratio between inter-class variance and intra-class variance using linear combinations of the original variables to achieve class discrimination. The goal is to project a dataset onto a lower-dimensional space with good class separability to avoid overfitting and to reduce computational costs. LDA is a linear transformation technique that is commonly used for dimensionality reduction.38,39The results of the analysis using the LDA method are shown in Fig. 8, which presents LDA-1 and LDA-2 components. The LDA method is highly capable of investigating the odor pattern caused by sample headspace.50 Fig. 8(a) demonstrates the LDA results of the apple samples with the maximum pesticide residue of the national standard. Using the LDA method, LDA-1 and LDA-2 were found to be 61.30% and 30.30%, respectively, with the overall odor pattern of the apple samples 91.60% accurately classified. The odor pattern of apple samples without pesticide and with the maximum pesticide residue of the national standard was completely discriminate.
Fig. 8(b) illustrates the results of the LDA classification of apple samples with different concentrations of cypermethrin residue. Using the LDA method, LDA-1 and LDA-2 were found to be 76.95% and 11.60%, respectively, and overall the odor pattern of the samples were classified with an accuracy of 88.55%. The odor patterns of the apple samples without pesticide and with 0.2 ppm, 1 ppm, and 4 ppm cypermethrin were completely different from each other. As with the PCA analysis, shown in Fig. 8(b), there was a little overlap between apple samples with 2 ppm and 3 ppm cypermethrin.
Furthermore, in classifying apple samples with different concentrations of chlorpyrifos residue by LDA, as shown in Fig. 8(c), LDA-1 and LDA-2 were 68.77% and 14.75%, respectively, and overall the odor pattern of the apple samples were classified with an accuracy of 83.52%. Unlike the PCA analysis in Fig. 7(c), however, the odor patterns of the apple samples without pesticide and with different concentrations of chlorpyrifos residue were completely discriminate.
3.6. Support vector machine analysis (SVM)
Support vector machine (SVM) learning is a supervised technique, widely used in statistical classification and regression analysis. The statistical learning theory created by SVM is based on Vapnik–Chervonenkis (VC) dimension theory and structural risk minimization principle. The underlying principle of SVM is the creation of an optimal hyperplane that would separate the data belonging to opposite classes, with the highest possible margin of confidence.51In order to classify the odor patterns of the pesticide residues in the apple samples, all 440 data of this study were used for training and prediction using the SVM technique. The average sensor response at 115–117 time points of each group of 40 parallel samples was selected as the input value in SVM pattern recognition, and the pesticide concentration of the processed sample is the output value for analysis. 70% of the samples of apples in each pesticide group were randomly selected for the training model, and the remaining 30% were used for testing and evaluation (28 for training and 12 for evaluation). Moreover, the type of core was RBF, the type of classification was C-SVM, the C value was 2, the gamma value was 0.25.
In the classification and detection of apple samples with blank and maximum residues of different pesticides using the SVM method, the results indicated that the classification accuracy of the SVM method for training set samples and validation set samples were 97.32% and 93.75%, respectively, and only 3 samples of 112 sets of the training set and 48 sets of the validation set were misclassified. In the classification and detection of apple samples with different concentrations of cypermethrin residue using the SVM method, the results indicated that the classification accuracy rates of the SVM method for training set samples and validation set samples were 94.64% and 90.28%, respectively. Among them, 9 of the 168 samples in the training set were misclassified, and 7 of the 72 samples in the validation set were misclassified. In the classification and detection of apple samples with different concentrations of chlorpyrifos residue using the SVM method, the results indicated that the classification accuracy rates of the SVM method for the training set samples and the validation set samples were 96.43% and 91.67%, respectively. Among them, only 5 sets of samples were misclassified for the 140 sets of samples in the training set and 60 sets of samples in the validation set (Table 2).
| Sample | Training | Validation | ||||||
|---|---|---|---|---|---|---|---|---|
| Total | Wrong | Right | Accuracy rate/% | Total | Wrong | Right | Accuracy rate/% | |
| a Note 1. Apple samples with blank and maximum residues of different pesticides; 2. apple samples with different concentrations of cypermethrin residue; and 3. apple samples with different concentrations of chlorpyrifos residue. | ||||||||
| 1a | 112 | 3 | 109 | 97.32 | 48 | 3 | 45 | 93.75 |
| 2a | 168 | 9 | 159 | 94.64 | 72 | 7 | 65 | 90.28 |
| 3a | 140 | 5 | 135 | 96.43 | 60 | 5 | 55 | 91.67 |
4 Results
In this research, the odor components of different kinds and concentrations of pesticide residues on apples were analyzed by electronic nose technology. Through a combination of PCA, LDA, SVM, and other analytical methods, a rapid model for the identification of pesticide residues on apple samples was established and verified. The electronic nose technology may be used to obtain different kinds of pesticides and their residues used currently on other fruits and vegetables.Conflicts of interest
The authors declare no conflict of interest.Acknowledgements
This work was supported by the Chunhui Project of the Ministry of Education (Grant No. Z2016142); the Key R&D projects of Department of Science and Technology of Sichuan Province (Grant No. 2020YFN0022); the Key R&D projects of Department of Science and Technology of Zhejiang Province (Grant No. 2019C02075). Thanks to the School of Food and Bioengineering, Xihua University for providing the equipment to conduct this research.References
- S. Mostafalou and M. Abdollahi, Toxicol. Appl. Pharmacol., 2013, 268, 157–177 CrossRef CAS PubMed.
- S. S. Sternberg, Pharmacol. Ther., 1979, 6, 147–166 CrossRef CAS PubMed.
- X. S. Chen, Z. Y. Bian, H. W. Hou, F. Yang, S. S. Liu, G. L. Tang and Q. Y. Hu, J. Agric. Food Chem., 2013, 61, 5746–5757 CrossRef CAS PubMed.
- Y. Z. Shuang, T. C. Zhang and L. S. Li, J. Chromatogr. A, 2020, 1614, 460702 CrossRef CAS PubMed.
- O. Golge, S. Cinpolat and B. Kabak, J. Food Compos. Anal., 2021, 96, 103755 CrossRef CAS.
- W. S. Jia, G. Liang, Z. J. Jiang and J. H. Wang, Food Anal. Methods, 2019, 12, 2226–2240 CrossRef.
- S. Q. Cui, P. Ling, H. P. Zhu and H. M. Keener, Sensors, 2018, 18, 378–390 CrossRef PubMed.
- P. Boeker, Sens. Actuators, B, 2014, 204, 2–17 CrossRef CAS.
- H. Q. Zou, Y. Han, S. Xing and Q. Y. Lin, World J. Sci. Technol., 2012, 14, 2120–2125 CrossRef.
- A. Kononov, B. Korotetsky, I. Jahatspanian, A. Gubal, A. Vasiliev, A. Arsenjev, A. Nefedov, A. Barchuk, I. Gorbunov, K. Kozyrev, A. Rassadina, E. Iakovleva, M. Sillanpää, Z. Safaei, N. Ivanenko, N. Stolyarova, V. Chuchina and A. Ganeev, J. Breath Res., 2019, 14, 016004 CrossRef PubMed.
- S. Bosch, J. P. Lemmen, R. Menezes, R. V. D. Hulst, J. Kuijvenhoven, P. C. Stokkers, T. G. D. Meij and N. K. D. Boer, J. Breath Res., 2019, 13, 046001 CrossRef CAS PubMed.
- J. Perkowski, M. Buśko, J. Chmielewski, T. Góral and B. Tyrakowska, Int. J. Food Microbiol., 2008, 126, 127–134 CrossRef CAS PubMed.
- W. G. Henderson, A. Khalilian, Y. J. Han, J. K. Greene and D. C. Degenhardt, Comput. Electron. Agric., 2010, 70, 157–162 CrossRef.
- B. D. Lampson, Y. J. Han, A. Khalilian, J. K. Greene, D. C. Degenhardt and J. O. Hallstrom, Comput. Electron. Agric., 2014, 108, 87–94 CrossRef.
- K. Mahmudi, M. Mostafaei and E. Mirzaee-Ghaleh, Fuel, 2019, 258, 116114 CrossRef.
- A. Romero-Flores, L. L. McConnell, C. J. Hapeman, M. Ramirez and A. Torrents, Chemosphere, 2017, 186, 151–159 CrossRef CAS PubMed.
- A. Lamagna, S. Reich, D. Rodríguez, A. Boselli and D. Cicerone, Sens. Actuators, B, 2008, 131, 121–124 CrossRef CAS.
- A. D. Wilson, Procedia Technology, 2012, 1, 453–463 CrossRef.
- S. Lavanya, B. Deepika, S. Narayanan, V. K. Murthy and M. V. Uma, Comput. Electron. Agric., 2017, 139, 198–203 CrossRef.
- M. Nurjuliana, Y. B. C. Man, D. M. Hashim and A. K. S. Mohamed, Meat Sci., 2021, 88, 638–644 CrossRef PubMed.
- Q. Wang, L. Li, W. Ding, D. Q. Zhang, J. Y. Wang, K. Reed and B. Zhang, Food Control, 2019, 98, 431–438 CrossRef CAS.
- A. Kalinichenko and L. Arseniyeva, Sens. Actuators, B, 2020, 303, 127250 CrossRef CAS.
- Z. H. Qin, X. L. Pang, D. Chen, H. Cheng, X. S. Hu and J. H. Wu, Food Res. Int., 2013, 53, 864–874 CrossRef CAS.
- X. H. Lu, J. Wang, G. D. Lu, B. Lin, M. Z. Chang and W. He, Sens. Actuators, B, 2019, 301, 127056 CrossRef CAS.
- Z. B. Wei, J. Wang and W. L. Zhang, Food Chem., 2015, 177, 89–96 CrossRef CAS PubMed.
- X. Z. Gu, Y. Sun, K. Tu and L. Q. Pan, Meat Sci., 2017, 133, 1–9 CrossRef CAS PubMed.
- J. C. R. Gamboa, E. S. Albarracin, A. J. d. Silva, L. L. D. A. Lima and T. A. E. Ferreira, LWT--Food Sci. Technol., 2019, 108, 377–384 CrossRef.
- Y. Xiong, X. H. Xiao, X. Y. Yang, D. Yan, C. G. Zhang, H. Q. Zou, H. Lin, L. Peng, X. Xiao and Y. H. Yan, J. Pharm. Biomed. Anal., 2014, 91, 68–72 CrossRef CAS PubMed.
- R. Upadhyay, S. Sehwag and H. N. Mishra, Food Chem., 2017, 221, 379–385 CrossRef CAS PubMed.
- S. M. Yimenu, J. Y. Kim and B. S. Kim, Poult. Sci., 2017, 96, 3733–3746 CrossRef CAS PubMed.
- E. Gobbi, M. Falasconi, G. Zambotti, V. Sberveglieri, A. Pulvirenti and G. Sberveglieri, Sens. Actuators, B, 2015, 207, 1104–1113 CrossRef CAS.
- Q. Liu, N. Zhao, D. D. Zhou, Y. Sun, K. Sun, L. Q. Pan and K. Tu, Food Chem., 2018, 262, 226–234 CrossRef CAS PubMed.
- S. Gu, J. Wang and Y. W. Wang, Food Chem., 2019, 292, 325–335 CrossRef CAS PubMed.
- A. H. Gómez, J. Wang, G. X. Hu and A. G. Pereira, LWT--Food Sci. Technol., 2007, 40, 681–689 CrossRef.
- A. H. Gómez, J. Wang, G. X. Hu and A. G. Pereira, J. Food Eng., 2008, 85, 625–631 CrossRef.
- S. Jiang and J. Wang, Postharvest Biol. Technol., 2016, 118, 17–25 CrossRef CAS.
- S. Trirongjitmoah, Z. Juengmunkong, K. Srikulnath and P. Somboon, Comput. Electron. Agric., 2015, 113, 148–153 CrossRef.
- R. S. Ciptohadijoyo, W. S. Litananda, M. Rivai and M. H. Purnomo, Comput. Electron. Agric., 2016, 121, 429–435 CrossRef.
- M. Ghasemi-Varnamkhasti, M. Tohidi, P. Mishra and Z. Izadi, Postharvest Biol. Technol., 2018, 138, 134–139 CrossRef.
- S. L. Tan, H. S. Teo and J. Garcia-Guzman, IEEE Electronics, Robotics and Automotive Mechanics Conference, 2010, pp. 592–596 Search PubMed.
- F. L. Marco, C. Sabino, G. S. Tuti, I. Luisetto, E. Petritoli, A. Pecora, L. Maiolo, R. Đurović-Pejčev, T. Đorđević, A. Tomašević, V. Bursić, V. Arenella, P. Gabriele and E. D. Francesco, 2017 IEEE International Workshop on Metrology for AeroSpace, MetroAeroSpace, 2017, pp. 403–407 Search PubMed.
- X. Y. Tang, W. M. Xiao, S. Tao, S. Y. Zhang, X. Y. Han, Y. L. Wang and H. W. Sun, Chemosensors, 2020, 8(2) DOI:10.3390/chemosensors8020030.
- M. M. Bordbar, T. A. Nguyen, A. Q. Tran and H. Bagheri, Sci. Rep., 2020, 10, 17302 CrossRef CAS PubMed.
- National Food Safety, Maxium residue limets for pesiticide in food, GB 2763, 2019 Search PubMed.
- W. A. N. G. Shaojie, H. O. U. Liang, J. Lee and B. U. Xiangjian, Autom. Constr., 2017, 84, 42–49 CrossRef.
- H. M. Zhang, J. Wang, X. J. Tian, H. C. Yu and Y. Yu, J. Food Eng., 2007, 82, 403–408 CrossRef.
- W. Huang, T. Xu, K. S. Li and J. He, Swarm Evol. Comput., 2019, 50, 100571 CrossRef.
- C. J. Zhou, L. Wang, Q. Zhang and X. P. Wei, Optik, 2013, 124, 5599–5603 CrossRef.
- D. C. Rich, K. M. Livingston and S. L. Morgan, Forensic Chem., 2020, 18 DOI:10.1016/j.forc.2020.100213.
- M. Ghasemi-Varnamkhasti, A. Mohammad-Razdari, S. H. Yoosefian, Z. Izadi and M. Siadat, LWT--Food Sci. Technol., 2019, 111, 85–98 CrossRef CAS.
- H. Lian, Pattern Recognit. Lett., 2012, 33, 1027–1031 CrossRef.
Footnote |
| † These authors contributed equally to this work. |
| This journal is © The Royal Society of Chemistry 2021 |

