
 Open Access Article
 This Open Access Article is licensed under a
 Creative Commons Attribution 3.0 Unported Licence
pH assists simultaneous determination of folic acid and vitamin D3 in biological fluids using a novel Tb3+–acyclovir optical biosensor
Sarah Alharthia,
M. S. Attia *b and
M. N. Abou-Omarc
*b and
M. N. Abou-Omarc
aDepartment of Chemistry, Collage of Science, Taif University, P. O. BOX 11099, Taif 21944, Saudi Arabia
bChemistry Department, Faculty of Science, Ain Shams University, Cairo 11566, Egypt. E-mail: Mohd_mostafa@sci.asu.edu.eg; Mohamed_sam@yahoo.com; Tel: +202 1229867311 Tel: +202 1060819022
cDepartment of Chemistry, Faculty of Women for Arts, Science and Education, Ain Shams University, Cairo, Egypt
First published on 11th June 2021
Abstract
An innovative, simple and cost effective Tb3+–acyclovir photo probe was designed and used as a core for a spectrofluorometric approach to sensitively determine two vital biological compounds in different matrices. The Tb3+–acyclovir complex displays a characteristic electrical band with λem at 545 nm with significant luminescence intensity, which is quenched in the presence of folic acid and vitamin D3 at pH 5.0 and 9.0, respectively. The conditions were optimized and the best solvent for operation was found to be acetonitrile and λex at 340 nm. folic acid was successfully estimated in tablet dosage form, urine and serum in the concentration range of 2.28 × 10⁻⁶ to 1.49 × 10⁻⁹ mol L−1. Vitamin D3 was also assessed in serum samples using the same optimal conditions within the concentration range of 3.2 × 10⁻⁹ to 1.0 × 10⁻⁶ mol L −1. The proposed luminescence method was validated in accordance with ICH guidelines and found to be accurate, precise and specific and free from any interferences. The cost effectiveness and applicability of the method make it a good choice for routine analysis of the two compounds and early diagnosis of chronic diseases associated with abnormalities in their physiological levels.
1. Introduction
Folic acid (FCA), vitamin B9, is one of the water-soluble vitamins1 found naturally in various types of foods such as legumes, leafy green vegetables, wheat germs, beets, broccoli, citrus fruits, fermented products, beef liver and eggs. FCA is an essential supplement for pregnant women in the first trimester to avoid birth abnormalities including congenital heart diseases and neural tube defects and autism.2,3 FCA is essential for DNA and RNA production and amino acid metabolism.4,5 Untreated deficiency of FCA is linked with different health problems, including neurological and psychological manifestations like psychosis, depression, insomnia and Alzheimer's disease, and an increased risk of cancer and osteoporosis.6,7 Elevated levels of homocysteine, a biomarker for arteriosclerosis, are also associated with FCA deficiency. Other symptoms include poor cognitive performance, hearing loss and other symptoms including fatigue, heart palpitations, shortness of breath, hair and skin discoloration, mouth sores, and a swollen tongue.5,6 Different analytical techniques were reported in the literature for FCA determination in dosage form, dietary supplements, beverages and biological samples including spectroscopy8,9 and chromatography10,11 and electrochemistry.12,13 The chemical structure of folic acid is presented in (Fig. 1).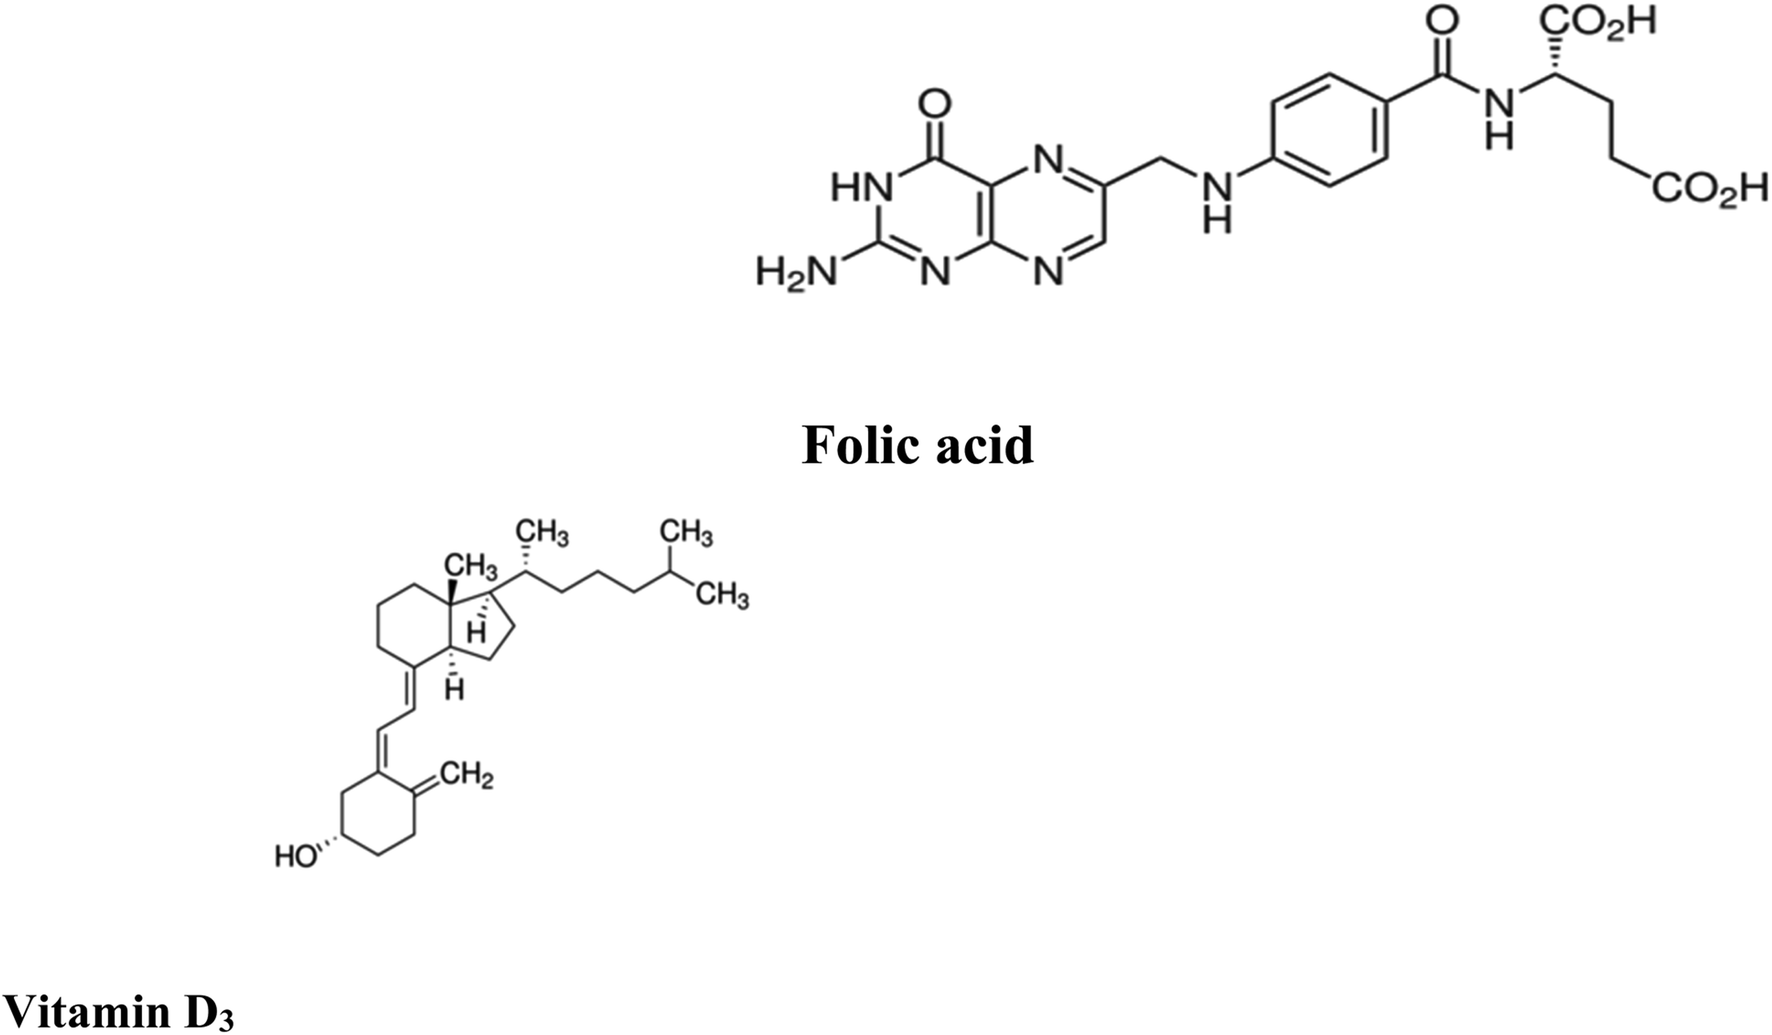 | ||
| Fig. 1 Chemical structure of folic acid and vitamin D3. | ||
Vitamin D3, one of fat-soluble vitamins, is naturally found in different types of foods as oily or fatty fish, dairy products, beefy liver and egg yolk and synthetized endogenously in human body upon exposure to sun. Vit. D3 is converted to its active form through two successive hydroxylation steps forming calcidiol (25-hydroxyvitamin D) in liver followed by calcitriol (1,25-dihydroxyvitamin D) in kidney. It has a major role in regulation concentration of phosphate and calcium in serum and essential in bone remodeling and growth.14,15 It is also used to improve the cognitive functions and in treatment of specific type of psoriasis. In addition, it contributed in the management of Covid-19 by reducing the cytokine storms and thrombotic episodes associated with the infection.16 The deficiency of Vit. D may lead to serious conditions as rickets and osteomalacia in young and adults, respectively.17 Low levels of Vit. D is also associated with increased risk of colon and pancreatic cancer respiratory acute infections.18,19 On the other hand, the excessive intake of Vit. D may increase the levels of calcium both in soft tissues (calcinosis) and blood (hypercalcemia). To evaluate the status of Vit. D in human body, calcidiol level in blood is used as best indicator. The chemical structure of Vit. D is displayed in (Fig. 1). In the last decade, several methods have been routinely used in the quantification of vitamin D, including competitive protein-binding (CPB) assays, radioimmunoassays (RIA), chemiluminescence immunoassays (CLIA), liquid chromatography (LC) with UV detection, and liquid chromatography-mass spectrometry (LC-MS) or tandem mass spectrometry (LC-MS/MS). In clinical practice, CPB, RIA and CLIA remain the most widely applied assays.20–25 The reported methods showed relatively high limits of detection which restricts their practical applications. Moreover, the measurement of low concentrations of folic acid and vitamin D3 in biological samples along with interference from some biomolecules such as uric acid (UA), ascorbic acid (AA), and different hormones requires to efficiently improve the sensitivity of chromatographic methods and the electrochemical sensors for practical applications. Therefore, developing a simple method for accurate determination of folic acid and vitamin D3 in the presence of each other in the same sample is still of great significance. Today, the research field in which the lanthanide complexes were used as biosensors has a great interest.26–48 Luminescent optical biosensor Tb–acyclovir (Tb–ACV) complex embedded in PEG matrix have many advantages over the mentioned traditional methods. Terbium ion has sharp and precise emission bands in green light region. The terbium ion is used as photo probe for many analytes with a high selectivity depends on the excitation wavelength of terbium–analyte complex, pH and the type of solvent of the test solution. Doping of the optical sensors in the polymer matrix increases its stability and durability.29–39 The sensor can provide a constant signal response for two years, which makes it 24-fold better balance compared to the lifetime warranted for the chromatographic and electrochemical methods. The source of error of the present work eliminated as it more stables for a long time; it gives a low standard deviation value. The higher stability of the current sensor can be attributed to the doping of the optical sensor in the polymer matrix (Fig. 2).
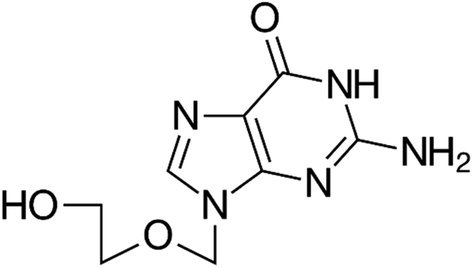 | ||
| Fig. 2 Chemical structure of acyclovir. | ||
2. Experimental
2.1. Instrumentation
A double beam UV-visible spectrophotometer (PerkinElmer Lambda 25), fluorescence spectrometer (Thermo Scientific Lumina, Meslo-PN; 222-263000). pH meter (Jenway; 33300).2.2. Materials and reagents
Pure folic acid standard was kindly supplied by the National Organization for Drug control and Research (Giza, Egypt). Pharmaceutical preparation of folic acid tablets dosage form labelled to contain 500 μg manufactured by Mepaco-Medifood (Arab Company for Pharmaceutical and Medicinal plants, Egypt) was purchased from community pharmacy in the Egyptian market. vitamin D3, solvents including ethanol, acetonitrile, dimethylformamide (DMF), chloroform and dimethyl sulfoxide (DMSO) were purchased from Sigma Aldrich. Analytical grade ammonium hydroxide (NH4OH), hydrochloric acid (HCl), Tb(NO3)3·5H2O, acyclovir and polyethylene glycol (PEG) were purchased from Sigma Aldrich.The human real samples were gathered from both Ain Shams Specialized and Teaching New Al-Kasr-El-Aini Hospitals, Cairo, Egypt in accordance with the approved protocol of World Health Organization (WHO) for the collection of human specimens and the use of the clinically related information and data for the purpose of research. The patients approved and were all consented before using their samples. All serum samples collection and separation procedures were performed in accordance with the Guidelines for Care and Use of Clinical Laboratory of Ain Shams University and approved by the Clinical Ethics Committee of Faculty of Medicine, Ain Shams University.
2.3. Preparation of standard solutions
Stock solutions of Tb(NO3)3·5H2O and acyclovir; were prepared separately by accurately weighing and transferring 0.11 g and 0.039 g, respectively of their authentic pure forms into separate 25 mL volumetric flasks by the aid of the least amount of ethanol till dissolution and completing the volume with the same solvent to obtain final concentration of (10−2 mol L−1) for each of them.Tb3+–Acyclovir complex solution; was prepared by mixing 0.1 mL of Tb(NO3)3 stock solution with 0.3 mL of acyclovir stock solution in 10 mL volumetric flask and completing the volume to the mark with acetonitrile.
For the four compounds under study, all stock solutions were separately prepared in 10 mL volumetric flasks in concentration of solution (10−2 mol L−1). This was achieved by dissolving 0.044 g of FCA in least amount of DMF and then completing the volume to the mark using acetonitrile. For Vit. D3 0.033 g was dissolved in small amount of ethanol and then volume was diluted to the mark with acetonitrile. Further dilutions for the stock solutions using acetonitrile were performed to obtain working solutions with concentrations of 1.0 × 10⁻⁴ to 1.0 × 10⁻⁹ mol L−1 of FCA and Vit. D3.
0.1 mol L−1 of NH4OH and HCl were used to adjust the pH to 9.0 and 5.0 for FCA and Vit. D, respectively. All of the prepared solutions should be kept at low temperature (2–8 °C) to remain stable.
2.4. Preparation of FCA pharmaceutical dosage form solution
Ten tablets of folic acid 500 μg were weighed and grinded into fine homogenous powder. The average weight of one tablet was calculated and dissolved in few mL of DMF and sonicated for 20 minutes. The solution was then filtered using Whatman filter papers (12 mm) into 10 mL volumetric flask to obtain final concentration of FCA equivalent to 1.1 × 10⁻³ mol L−1. Further dilution was performed to obtain different solutions with concentration range of (1.0 × 10⁻⁴ to 1.0 × 10⁻⁷ mol L−1) was prepared by appropriate dilution with acetonitrile.2.5. Preparation of urine sample spiked with FCA
The urine sample was collected from a healthy volunteer who didn't administer any previous medications, it was then manipulated in the lab as follows; 10 mL of the collected urine sample were centrifuged at 4000 rpm for 15 min to remove all interferants including crystals, salts, pus and red blood cells. 1.0 mL of urine was spiked with 1.0 mL of previously prepared drug solution with concentration of 1.0 × 10⁻⁶ mol L−1 and completed by acetonitrile to the mark in 10 mL measuring flask.2.6. Preparation serum samples spiked with FCA and Vit. D3
A 1.0 mL of samples of blood collected from healthy volunteers was centrifuged for 15 min at 4000 rpm to remove proteins. 0.1 mL of the serum sample was added to 1.0 mL of each drug working solution of concentration 1.0 × 10⁻⁶ mol L−1 and the volume was complete to 10 mL by acetonitrile to obtain 1.0 × 10⁻⁷ mol L−1 for each drug in four separate 10 mL measuring flasks.2.7. Preparation of Tb–ACV biosensor embedded in PEG
Tb–ACV complex was prepared in the solid state by mixing an equal volume of 1.0 × 10⁻⁴ mol L−1 Tb ion and 3.0 × 10⁻⁴ mol L−1 acyclovir in ethanol, then evaporation near the dryness of the solution, a pale pink solid was obtained after cooling in air. The thin film was prepared by dissolving 0.1 g of the solidified and seamless complex in 3 mL ethanol and then adding 10 mL of viscose freshly prepared PEG with stirring for about one hour until a homogenous solution was obtained. A thin film was fabricated by spin-coating on a small quartz slide (width 8.5 mm, height 25 mm) to quick fit in the cuvette of the spectrofluorometer.2.8. Recommended procedure
An appropriate volume (100 μL) of various standard concentrations of folic acid and vitamin D3 should be diluted to 3 mL with acetonitrile. The dilute solution was mixed with a thin film of biosensor Tb–ACV doped in PEG matrix in the quartz cell of a spectrofluorometer. The luminescence spectra were recorded at the excitation wavelength λex = 340 nm. After each measurement, the optical sensor was washed with acetonitrile, and the calibration curve was built by applying the Stern's Volmer equation by plotting (F/F0) the at λem = 545 nm on the y-axis versus the folic acid and vitamin D3 concentration in mol L−1 on the x-axis.2.9. Determination of FCA in tablet dosage form
The tablet dosage form solutions previously prepared under (2.4) were analyzed using the following procedures: in the spectrofluorimeter cell, 1.0 mL of the tablet solutions was separately added followed by the 1.5 mL of acetonitrile in presence of the biosensor film. After mixing, the obtained solutions were scanned and luminescence spectra were recorded at λex/λem = 340/545 nm. The concentrations of the real samples were calculated using corresponding regression equation.2.10. Determination of FCA in spiked urine samples
The luminescence spectra of the previously prepared spiked urine samples as detailed under (2.5) were scanned at λex/λem = 340/545 nm and the concentration of spiked FCA was determined using the corresponding regression equation adopting the standard addition technique.2.11. Determination of FCA and vitamin D3 in serum samples
The luminescence spectra of the serum samples previously prepared as described under (Section 2.6) were measured adopting the same procedures followed under (Section 3.2). The concentrations of each real sample were calculated using corresponding regression equation.3. Result and discussion
3.1. General features of absorption and emission spectra of Tb–ACV complex
Owing to the f–f transition forbiddance of trivalent ion (Tb3+), there is a restriction to directly absorb light which could be overcome through the antenna effect via the coupling between Tb3+ and a prominently absorbing organic ligand leading to efficient energy transfer and light absorption processes. Regarding the proposed photo probe, Tb3+ is surrounded covalently by 3 molecules of acyclovir ligand responsible for efficient absorption of light and transfer of energy to populate 5D4 state of Tb3+.44The emission of the formed complex Tb–ACV exhibited four specific and intense bands because of the 5D4–7FJ transitions (J = 6, 5, 4 and 3).44
3.2. Absorption and emission spectra
The absorption spectra of 1.0 × 10⁻⁴ mol L−1 acyclovir (spectrum 1), 3.0 × 10⁻⁴ mol L−1 acyclovir + 1.0 × 10⁻⁴ mol L−1 Tb3+ (spectrum 2) and 1.0 × 10⁻⁴ mol L−1 acyclovir + 3.0 × 10⁻⁴ mol L−1 Tb3+ (spectrum 3) are shown in Fig. 3. The spectrum contains three peaks at 250 nm, 286 nm and 382 nm due to π → π* and n → π* transitions in organic moiety of acyclovir. Peaks at 250 and 286 nm are red shifted by 2 nm and the absorbance value is enhanced denoting that acyclovir could form a stable complex with Tb3+. The absorption spectra of FCA and Vit. D3 were scanned alone and in the presence of the optical sensor are shown in Fig. 4. Upon addition of FCA and Vit. D3 to the optical sensor Tb–acyclovir the two peaks at 250 and 286 are disappeared and a red shift by 5 nm at 382 nm was obtained. The emission spectra of Tb3+–acyclovir complex after adding different concentrations of FCA and Vit. D3 using acetonitrile as solvent are shown in Fig. 5 and 6, respectively. The characteristic electrical emission band of Tb3+ exhibited at λem 545 nm was quenched due to energy transfer from the optical sensor to FCA and Vit. D3.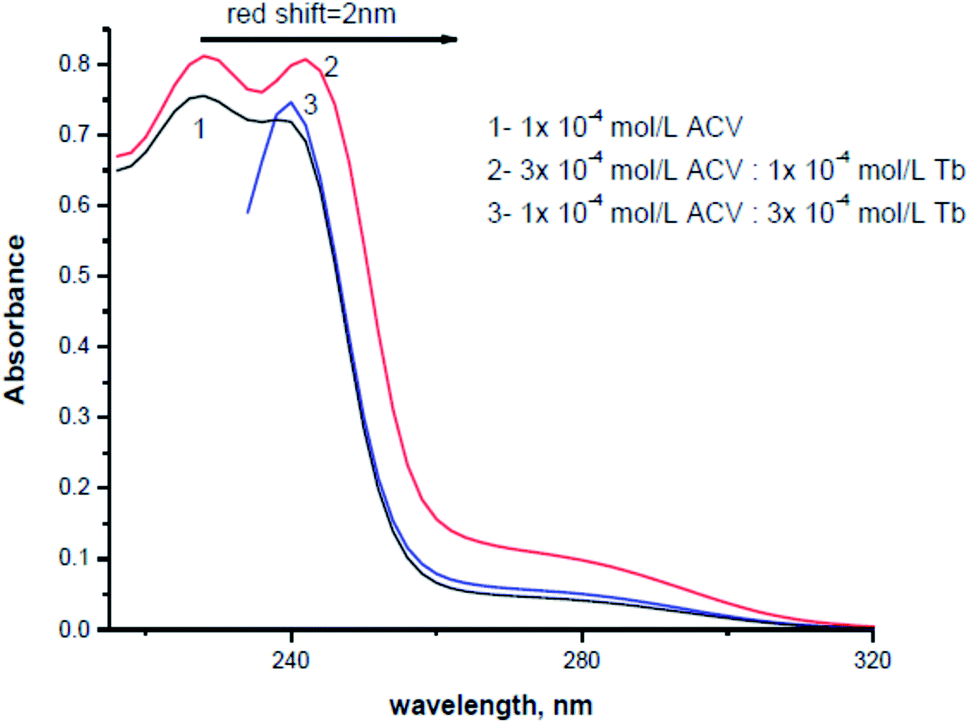 | ||
| Fig. 3 The absorption spectra of (1) acyclovir (1.0 × 10⁻⁴ mol L−1), (2) acyclovir (3.0 × 10⁻⁴) + Tb3+ (1.0 × 10⁻⁴ mol L−1) and (3) acyclovir (1.0 × 10⁻⁴) + Tb3+ (3.0 × 10⁻⁴ mol L−1) complex in acetonitrile. | ||
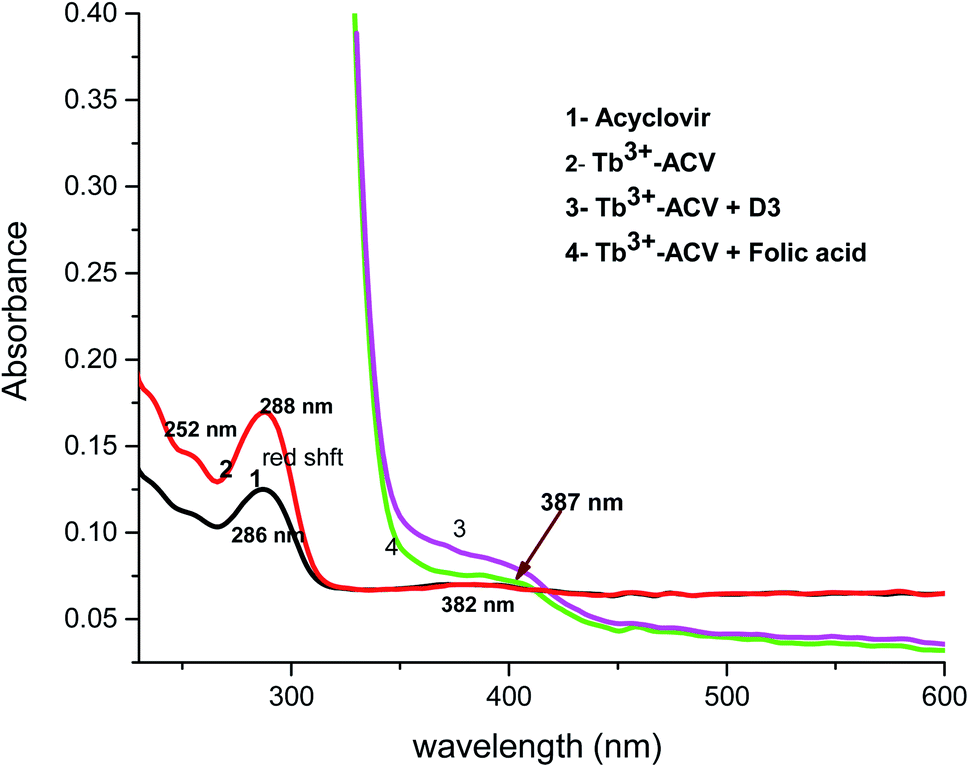 | ||
| Fig. 4 The absorption spectrum of (1) ACV, (2) Tb3+–ACV complex, (3) Tb3+–ACV + Vit. D3 and (4) Tb3+–ACV + folic acid in acetonitrile. | ||
 | ||
| Fig. 5 The emission spectra of Tb3+–ACV complex at λex = 340 nm and pH 5.0 in presence of different folic acid concentrations using acetonitrile as a solvent. | ||
 | ||
| Fig. 6 The emission spectra of Tb3+–ACV complex at λex = 340 nm and pH 9.0 in presence of different vitamin D3 concentrations using acetonitrile as a solvent. | ||
3.3. Experimental variables
![[thin space (1/6-em)]](https://www.rsc.org/images/entities/char_2009.gif) :3L indicating that the metal coordinates to the ligand at different sites of coordination not via oxygen only, Fig. 7.
:3L indicating that the metal coordinates to the ligand at different sites of coordination not via oxygen only, Fig. 7.
 | ||
| Fig. 7 Luminescence emission spectra of Tb3+ with different molar ratio of ACV in acetonitrile at λex = 340 nm and pH 10.0. | ||
 | ||
| Fig. 8 Emission spectra of Tb3+–ACV optical sensor in different solvents at λex = 340 nm and pH 10.0. | ||
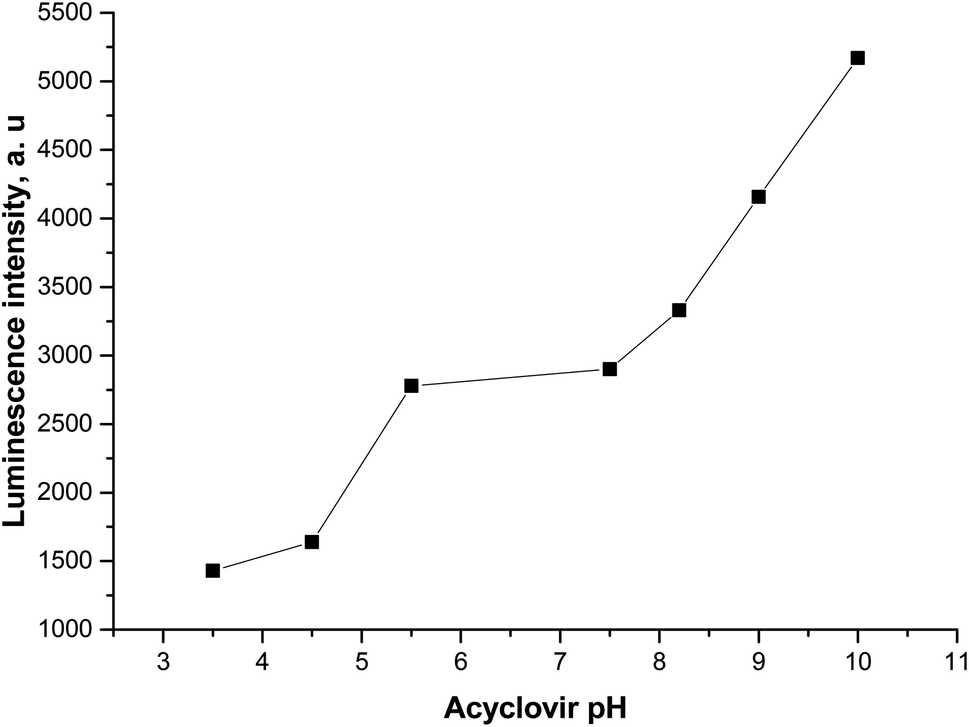 | ||
| Fig. 9 Emission spectra of Tb3+–ACV optical sensor in acetonitrile at λex = 340 nm and different pHs. | ||
3.4. Mechanism of emission quenching
Upon adding different concentrations of FCA and Vit. D3 to the Tb–ACV photo probe a notified quenching in its luminescent intensity occurs owing to the approach of the analytes under study and formation of H-bond between the hydroxyl group in Vit. D3 and carboxylic group in FCA with the acyclovir. The formation of H-bonding lead to the depression or decrease in the transfer of energy to the Tb3+ ion and consequently the luminescence intensity is significantly quenched.The pH effect on the luminescence intensity after the addition of the studied analytes to the proposed photoprobe was studied and the luminescence quenching was observed at pH 5.0 and 9.0 for FCA and Vit. D3, respectively.
4. Analytical performance49
4.1. Linearity
Correlations between the luminescence of emission intensity of optical sensor at λem 545 nm and FCA and Vit. D3 within concentration ranges of (2.28 × 10⁻⁶ to 1.49 × 10⁻⁹) and (3.2 × 10⁻⁹ to 1.0 × 10⁻⁶) mol L−1 respectively were found to be linear as presented in respective calibration graphs, Fig. 10 and 11 obtained by applying the Stern–Völmer plot.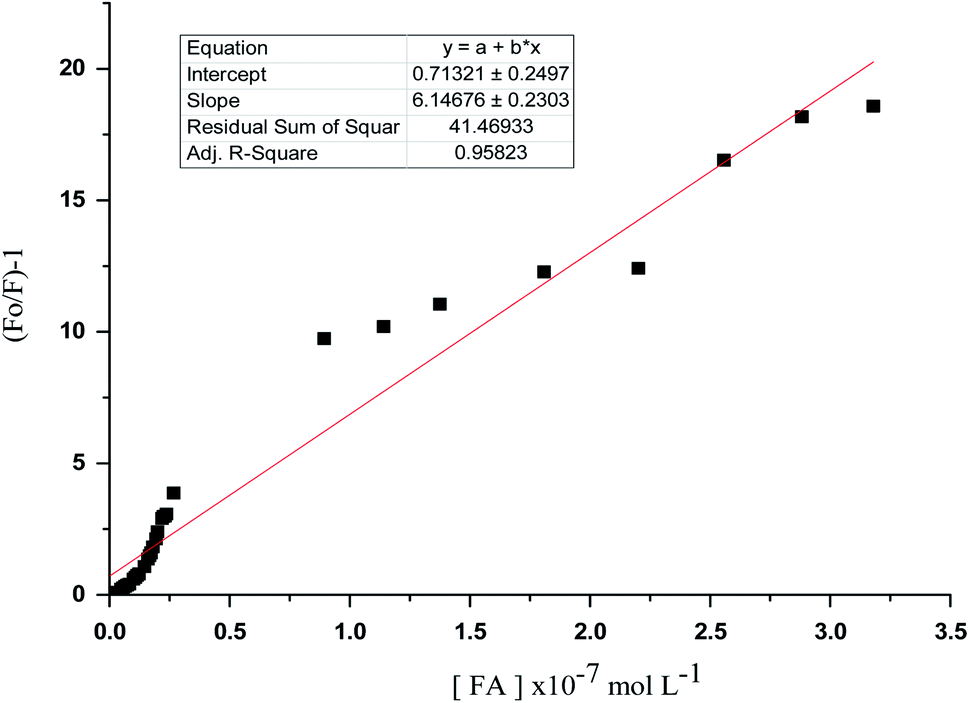 | ||
| Fig. 10 Stern volmer plot (F0/F) − 1 against corresponding concentrations of folic acid. | ||
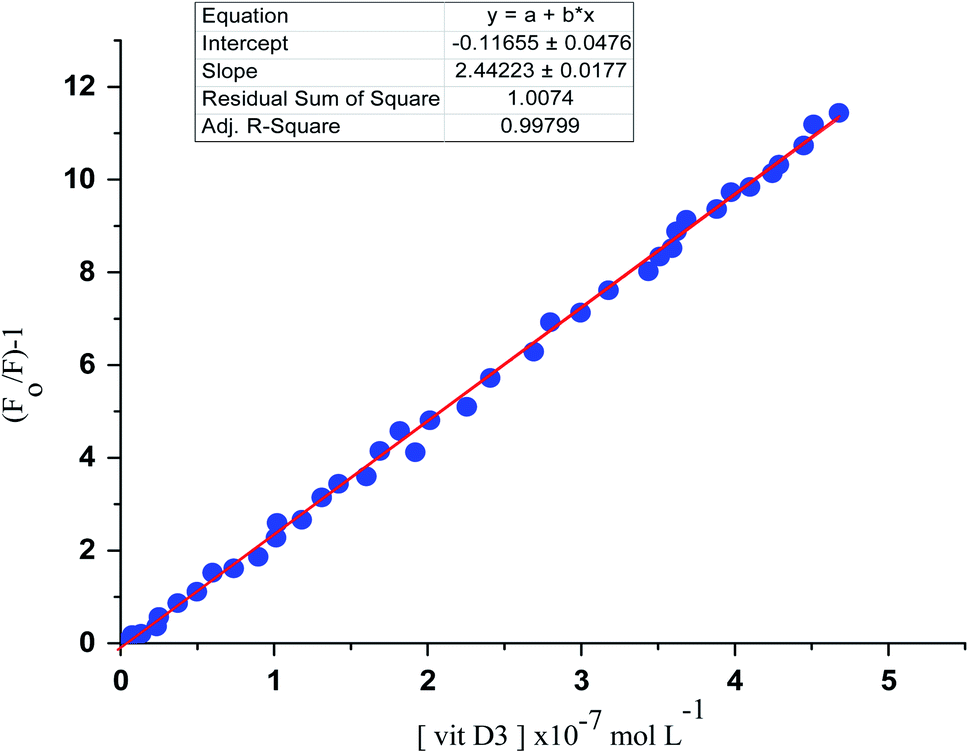 | ||
| Fig. 11 Stern volmer plot (F0/F) − 1 against corresponding concentrations of vitamin D3. | ||
The Stern–Völmer constant and critical concentration of FCA and Vit. D3 values are (κsv = 3.21 and 1.40) and (0.005 × 10⁻⁷ to 3.18 × 10⁻⁷ and 4.9 × 10⁻¹⁰ to 4.8 × 10⁻⁷) mol L−1 respectively. The distance between the cited compounds and the ionophore is 3.16 Å indicating the electron transfer mechanism of quenching. The regression equations were computed and the regression parameters in addition the LOD and LOQ were calculated and results were presented in Table 1.
| Parameter | Folic acid | Vitamin D3 |
|---|---|---|
| λem = 545 nm | ||
| a a is the intercept; b is the slope; X is the concentration of analyte in mol L−1; Y is the intensity of luminescence. | ||
| Linearity (mol L−1) | 2.28 × 10⁻⁶ to 1.49 × 10⁻⁹ | 3.2 × 10⁻⁶ to 1.0 × 10⁻⁹ |
| LOD (mol L−1) | 2.99 × 10⁻⁹ | 1.19 × 10⁻⁹ |
| LOQ (mol L−1) | 8.94 × 10⁻⁹ | 3.57 × 10⁻⁹ |
|
||
| Regression equationa X = a + bY | ||
| Intercept (a) | 0.71 | 0.11 |
| Slope (b) | 6.17 | 2.44 |
| Standard deviation | 0.24 | 0.032 |
| Variance (S2) | 0.057 | 0.001 |
| Regression coefficient (r) | 0.958 | 0.997 |
4.2. Accuracy and precision
The accuracy of the developed method was further investigated via applying the standard addition technique and calculating the recovery %. Assessing the obtained recovery was performed through determination of agreement extent between the measured and actual added standard concentration of analyte. All assays were repeated 3 times within the same day and different days to assess the repeatability and intermediate precision, respectively. Three different levels of the analyte concentrations were used in the assays and the results were summarized and presented in (Table 2).| Sample | Concentration taken (×10−7 mol L−1) | Repeatability | Intermediate precision | ||||
|---|---|---|---|---|---|---|---|
| Average found ± CLb | %REc | %RSDd | Drug average found ± CL | %RE | %RSD | ||
| a n = 3.b CL: confidence limits.c %RE: percent relative error.d RSD: relative standard deviation. | |||||||
| Vitamin D3 in serum | 1.0 | 1.06 ± 0.23 | 6.00 | 2.42 | 1.07 ± 0.21 | 7.00 | 2.11 |
| 2.0 | 2.05 ± 0.28 | 2.25 | 2.35 | 2.09 ± 0.36 | 4.50 | 4.15 | |
| 4.0 | 4.09 ± 0.48 | 1.25 | 1.25 | 4.10 ± 0.31 | 2.00 | 2.11 | |
| Tablet, 500 μg of folic acid MEPACO | 3.0 | 3.01 ± 0.024 | 0.33 | 0.23 | 3.07 ± 0.052 | 2.33 | 0.18 |
| 6.0 | 6.03 ± 0.050 | 0.50 | 0.15 | 6.08 ± 0.070 | 1.33 | 0.27 | |
| 9.0 | 9.04 ± 0.025 | 0.44 | 0.21 | 9.09 ± 0.062 | 1.00 | 0.18 | |
| Folic acid in serum | 4.0 | 4.01 ± 0.20 | 0.25 | 0.28 | 4.08 ± 0.038 | 2.00 | 0.27 |
| 6.0 | 6.08 ± 0.15 | 1.33 | 0.41 | 6.09 ± 0.080 | 1.33 | 0.43 | |
| 9.0 | 9.03 ± 0.22 | 0.33 | 0.13 | 9.06 ± 0.062 | 0.66 | 0.38 | |
| Folic acid in urine | 4.0 | 3.98 ± 0.20 | 0.50 | 0.20 | 4.06 ± 0.043 | 1.25 | 0.22 |
| 6.0 | 6.05 ± 0.15 | 0.83 | 0.46 | 6.07 ± 0.070 | 1.30 | 0.41 | |
| 9.0 | 9.03 ± 0.22 | 0.33 | 0.34 | 9.04 ± 0.066 | 0.44 | 0.48 | |
4.3. Selectivity
The selectivity of the proposed method was investigated through analyzing placebo blank and synthetically prepared mixtures. All possible interfering inactive compounds were used to prepare a placebo containing; 50 mg calcium carbonate, 20 mg calcium dihydrogen orthophosphate, 30 mg lactose, 100 mg magnesium stearate, 40 methyl cellulose, 70 mg sodium alginate, 300 mg starch and 250 mg Talc. Extraction was performed using water and the solution was manipulated as detailed under 2.4. A suitable aliquot of the obtained solution was analyzed after the addition of the optical sensor Tb3+–acyclovir and the luminescence spectra were recorded at λex/λem = 340/545 nm following the optimized conditions.The validity and selectivity were further assessed in presence of some proteins and hormones that may interfere as cortisol, thyroid stimulating hormone, norepinephrine, dopamine and albumin within concentration range of 0.08 g L−1. The interference of 0.06 g L−1 urea, 0.08 g L−1 glucose, uric acid and folic acid was also studied and the resulting data revealed that there was no significant effect on the observed luminescence activity of the proposed photo probe under optimized conditions.
In addition, the proposed optical probe was successfully applied for selective determination of FCA and Vit. D3 either as single or in combination in synthetically prepared mixtures. Two synthetic mixtures were prepared by adding different concentrations of FCA and Vit. D3 within their linearity range in 2 similar sets of 10 mL volumetric flasks containing 1.0 ml of the serum sample as mentioned under 2.6.
The pH of the first set was adjusted to 5.0 for selective determination of FCA in presence of Vit. D3 and the pH of the second set was adjusted to 9.0 for the determination of Vit. D3 in presence of FCA and the volume was completed with acetonitrile for the two sets. Thus, each mixture was prepared 2 times but at different pH (5.0 and 9.0) for selective estimation of FCA and Vit. D3, respectively. Each solution was in triplicates and yielded recovery % of 99.60 ± 0.47 and 101.9 ± 2.20 for FCA and Vit. D3, respectively.
Also, the data obtained upon assaying single Vit. D3 separately in serum sample and FCA in serum, urine and dosage form, without any interference from inactive excipients, was processed and results were tabulated as shown in Table 3. The results of the proposed method were comparable to that obtained from the reference chromatographic methods mentioned in the British pharmacopeia.50
| Sample | Added (×10−7 mol L−1) | Found (×10−7 mol L−1) | Averagea (×10−7 mol L−1) | Average recovery ± RSD% | BP (LC) |
|---|---|---|---|---|---|
| a Average of nine measurements. | |||||
| Vitamin D3 serum sample | 3.5 | 3.49, 3.49, 3.58 | 3.52 | 100.57 ± 1.9 | 99.4 ± 0.5 |
| 7.0 | 6.75, 6.79, 6.78 | 6.77 | 96.71 ± 2.8 | ||
| 9.5 | 9.61, 9.65, 9.68 | 9.61 | 96.42 ± 4.1 | ||
| Tablet, 500 μg of folic acid MEPACO-MEDIFOOD | 3.0 | 3.14, 3.15, 3.13 | 3.14 | 101.33 ± 1.33 | 99.8 ± 0.055 |
| 6.0 | 6.12, 6.08, 5.89 | 6.03 | 99.83 ± 2.35 | ||
| 9.0 | 9.07, 9.06, 9.05 | 9.06 | 99.66 ± 1.11 | ||
| Folic acid serum sample | 4.0 | 4.08, 4.06, 4.10 | 4.08 | 99.5 ± 1.38 | 99.6 ± 0.050 |
| 6.0 | 6.01, 5.97, 5.95 | 5.98 | 99.66 ± 2.61 | ||
| 9.0 | 8.88, 8.94, 8.91 | 8.91 | 99.77 ± 1.33 | ||
| Folic acid urine sample | 4.0 | 4.09, 3.87, 4.01 | 3.99 | 99.75 ± 1.10 | 99.5 ± 0.050 |
| 6.0 | 6.12, 5.88, 5.99 | 5.99 | 99.83 ± 2.66 | ||
| 9.0 | 8.79, 9.07, 9.10 | 8.99 | 99.88 ± 1.44 | ||
4.4. Comparison with previously reported methods
The results obtained from the proposed spectrofluorometric technique was compared with obtained from other previously reported methods51–61 assuring the applicability, accuracy and precision of the proposed method as presented in Table 4.| Analyte | Methods | Linearity | Limit of detection | Ref. |
|---|---|---|---|---|
| Vitamin D3 | HPLC | 15–200 nmol L−1 | 3 nmol L−1 | 48 |
| LC-MS/MS | 3.5 to 75 ng mL−1 | 14 ng mL−1 | 49 | |
| LC/MS/MS | 4.8 to 67.8 nmol L−1 | 1 nmol L−1 | 50 | |
| HPLC-APCI-MS | 5–400 nmol L−1 | 1–4 nmol L−1 | 51 | |
| Spectrofluorometric using Tb3+–ACV | 2.2 × 10⁻⁶ to 1.0 × 10⁻⁹ mol L−1 | 1.6 × 10⁻⁹ mol L−1 | ||
| Folic acid | LC-MS/MS | 4.5 × 10⁻⁸ to 5 × 10⁻¹⁰ mol L−1 | 5 × 10⁻¹⁰ mol L−1 | 52 |
| Chemiluminometric and fluorimetric determination | 114–6.0 μg mL−1 | 2.0 μg mL−1 | 53 | |
| 1.10–0.022 μg mL−1 | 0.002 μg mL−1 | |||
| Chemiluminescence | 8 × 10⁻⁷ to 6 × 10⁻⁹ mol L−1 | 6 × 10−103 mol L−1 | 54 | |
| HPLC method | 2500 to 50 μg mL−1 | 1.3 ng mL−1 | 55 | |
| Spectrofluorometric method: FA–Tb3+–ACV | 2.28 × 10⁻⁶ to 1.49 × 10⁻⁹ mol L−1 | 1.99 × 10⁻⁹ mol L−1 |
5. Conclusion
The proposed analytical method based on the use of Tb3+–acyclovir complex is simple and economic and can be successfully applied for sensitive and accurate determination of folic acid and vitamin D3 in different matrices including dosage forms, urine and serum. The analysis of the FCA and Vit. D3 in biological samples can contribute in early diagnosis of some chronic diseases associated with their abnormal levels.Conflicts of interest
There are no conflicts to declare.Acknowledgements
Sarah Alharthi thanks Taif University Researchers Supporting Project (TURSP-2020/200), Taif University, Taif, Saudi Arabia, for supporting this work.References
- U. Binesh, Y.-L. Yang and S.-M. Chen, Int. J. Electrochem. Sci., 2011, 6, 3224–3227 Search PubMed.
- R. D. Wilson, F. Audibert, J. A. Brock, J. Carroll, L. Cartier, A. Gagnon, J. A. Johnson, S. Langlois, L. Murphy-Kaulbeck, N. Okun, M. Pastuck, P. Deb-Rinker, L. Dodds, J. A. Leon, H. L. Lowel, W. Luo, A. MacFarlane, R. McMillan, A. Moore, W. Mundle, D. O'Connor, J. Ray and M. Van den Hof, Journal of Obstetrics and Gynaecology Canada, 2015, 37, 534–552 CrossRef PubMed.
- D. B. Kirsten, C. G. David, J. C. Susan, W. D. Karina, W. E. John, A. R. G. Francisco, R. K. Alex, H. K. Alex, E. K. Ann, C. Landefeld, M. M. Carol, R. P. William, G. P. Maureen, P. P. Michael, S. Michael and T. Chien-Wen, JAMA, J. Am. Med. Assoc., 2017, 317, 183–189 CrossRef PubMed.
- Y. Feng, S. Wang, R. Chen, X. Tong, Z. Wu and X. Mo, Sci. Rep., 2015, 5, 8506 CrossRef CAS PubMed.
- J. G. LeBlanc, G. S. D. Giori, E. J. Smid, J. Hugenholtz and F. Sesma, Communicating current research and educational topics and trends in applied microbiology, 2007, vol. 1, pp. 329–339 Search PubMed.
- I. M. Ebisch, C. M. Thomas, W. H. Peters, D. D. Braat and R. P. Steegers-Theunissen, Hum. Reprod. Update, 2007, 13, 163–174 CrossRef CAS PubMed.
- S. E. Kim, P. D. Cole, R. C. Cho, A. Ly, L. Ishiguro, K. J. Sohn, R. Croxford, B. A. Kamen and Y. I. Kim, Br. J. Cancer, 2013, 109, 2175–2188 CrossRef CAS PubMed.
- J. A. Luchsinger, M. X. Tang, J. Miller, R. Green and R. Mayeux, Arch. Neurol., 2007, 64, 86–92 CrossRef PubMed.
- A. M. Treon, M. Shea-Budgell, B. Shukitt-Hale, D. E. Smith, J. Selhub and I. H. Rosenberg, Proc. Natl. Acad. Sci. U. S. A., 2008, 105, 12474–12479 CrossRef PubMed.
- M. Jägerstad, Acta Paediatr., 2012, 101, 1007–1012 CrossRef PubMed.
- S. J. Weinstein, T. J. Hartman, R. Stolzenberg-Solomon, P. Pietinen, M. J. Barrett, P. R. Taylor, J. Virtamo and D. Albanes, Biomarkers & Prevention, 2003, 12, 1271–1272 Search PubMed.
- E. Reynolds, Lancet Neurol., 2006, 11, 949–960 CrossRef.
- B. T. Zhang, L. Zhao and J. M. Lin, Talanta, 2008, 74, 1154–1159 CrossRef CAS PubMed.
- A. W. Norman, Am. J. Clin. Nutr., 2008, 88, 491–499 CrossRef PubMed.
- W. Simonson, Geriatric Nursing, 2020, 41, 496–497, DOI:10.1016/j.gerinurse.2020.06.011.
- P. Insel, D. Ross, M. Bernstein and K. McMahon, Discovering Nutrition, Jones & Bartlett Publishers, 5th edn, 2015 Search PubMed.
- V. Tangpricha, C. Spina, M. Yao, T. C. Chen, M. M. Wolfe and M. F. Holick, J. Nutr., 2005, 135, 2350–2354 CrossRef CAS PubMed.
- A. H. Davis-Yadley and M. P. Malafa, Adv. Nutr., 2015, 6, 774–802 CrossRef CAS PubMed.
- A. Valcour, C. Zierold, A. L. Podgorski, G. T. Olson, J. V. Wall, H. F. DeLuca and F. Bonelli, J. Steroid Biochem. Mol. Biol., 2016, 164, 120–126 CrossRef CAS PubMed.
- C. Farrell, J. Soldo, P. Williams and M. Herrmann, 25- Hydroxyvitamin D testing: challenging the performance of current automated immunoassays, Clin. Chem. Lab. Med., 2012, 50(11), 1953–1963 CAS.
- E. W. Holmes, J. Garbincius and K. M. McKenna, Analytical variability among methods for the measurement of 25- hydroxyvitamin D: Still adding to the noise, Am. J. Clin. Pathol., 2013, 140(4), 550–560 CrossRef CAS PubMed.
- S. A. Hsu, J. Soldo and M. Gupta, Evaluation of two automated immunoassays for 25-OH vitamin D: Comparison against LCMS/MS, J. Steroid Biochem. Mol. Biol., 2013, 136, 139–145 CrossRef CAS PubMed.
- C. Le Goff, S. Peeters, Y. Crine, P. Lukas, J. C. Souberbielle and E. Cavalier, Evaluation of the cross-reactivity of 25- hydroxyvitamin D2 on seven commercial immunoassays on native samples, Clin. Chem. Lab. Med., 2012, 50(11), 2031–2032 CAS.
- J. H. Lee, J. H. Choi, O. J. Kweon and A. J. Park, Discrepancy between vitamin D total immunoassays due to various cross-reactivities, J Bone Metab, 2015, 22(3), 107–112 CrossRef PubMed.
- A. C. Heijboer, M. A. Blankenstein, I. P. Kema and M. M. Buijs, Accuracy of 6 routine 25-hydroxyvitamin D assays: influence of vitamin D-binding protein concentration, Clin. Chem., 2012, 58(3), 543–548 CrossRef CAS PubMed.
- G. Snellman, H. Melhus, R. Gedeborg, L. Byberg, L. Berglund, L. Wernroth and K. Michaëlsson, PLoS One, 2010, 5, e11555 CrossRef PubMed.
- U. Turpeinen, S. Linko, O. Itkonen and E. Hämäläinen, Scand. J. Clin. Lab. Invest., 2008, 68, 50–57 CrossRef CAS PubMed.
- J. M. Oberson, S. Bénet, K. Redeuil and E. Campos-Giménez, Anal. Bioanal. Chem., 2020, 412, 365–375, DOI:10.1007/s00216-019-02248-5.
- M. S. Attia, M. H. Khalil, M. S. A. Abdel-Mottaleb, M. B. Lukyanova, Y. A. Alekseenko and B. Lukyanov, Int. J. Photoenergy, 2006, 1–9 CrossRef.
- M. S. Attia, A. A. Essawy, A. O. Youssef and M. S. Mostafa, J. Fluoresc., 2012, 2, 557–564 CrossRef PubMed.
- M. S. Attia, A. M. Othman, A. O. Youssef and E. El-Raghi, J. Lumin., 2012, 132, 2049–2053 CrossRef CAS.
- M. S. Attia, A. O. Youssef and A. A. Essawy, Anal. Methods, 2012, 4, 2323–2328 RSC.
- M. S. Attia, A. O. Youssef and R. H. El-Sherif, Anal. Chim. Acta, 2014, 835, 56–64 CrossRef CAS PubMed.
- M. S. Attia, M. Diab and M. F. El-Shahat, Sens. Actuators, B, 2015, 207, 756–763 CrossRef CAS.
- M. S. Attia, A. O. Youssef, Z. A. Khan and M. N. Abou-Omar, Talanta, 2018, 186, 36–43 CrossRef CAS PubMed.
- M. S. Attia and N. S. Al-Radadi, Biosens. Bioelectron., 2016, 86, 413–419 CrossRef CAS PubMed.
- M. S. Attia and N. S. Al-Radadi, Biosens. Bioelectron., 2016, 86, 406–412 CrossRef CAS PubMed.
- M. S. Attia, Biosens. Bioelectron., 2017, 94, 81–86 CrossRef CAS PubMed.
- M. S. Attia, K. Ali, M. El-Kemary and W. M. Darwish, Talanta, 2019, 201, 185–193 CrossRef CAS PubMed.
- M. S. Attia, W. H. Mahmoud, A. O. Youssef and M. S. Mostafa, J. Fluoresc., 2011, 21, 2229–2235 CrossRef CAS PubMed.
- M. S. Attia, M. N. Ramsis, L. H. Khalil and S. G. Hashem, J. Fluoresc., 2012, 22, 779–788 CrossRef CAS PubMed.
- A. A. Elabd and M. S. Attia, J. Lumin., 2015, 165, 179–184 CrossRef CAS.
- A. A. Elabd and M. S. Attia, J. Lumin., 2016, 87, 165–172 Search PubMed.
- A. A. Essawy and M. S. Attia, Talanta, 2013, 107, 18–24 CrossRef CAS PubMed.
- E. Hamed, M. S. Attia and K. Bassiony, Bioinorg. Chem. Appl., 2009, 1–7 Search PubMed.
- M. S. Attia and M. M. Aboaly, Talanta, 2010, 82, 78–84 CrossRef CAS PubMed.
- M. S. Attia, Spectrochim. Acta, 2009, 74, 972–976 CrossRef CAS PubMed.
- M. S. Attia, E. Bakir, A. A. Abdel-Aziz and M. S. A. Abdel-Mottaleb, Talanta, 2011, 84, 27–33 CrossRef CAS PubMed.
- M. S. Attia, A. O. Youssef and A. A. Essawy, Anal. Methods, 2012, 4, 2323–2328 RSC.
- Y. Cui, G. Qian and B. Chen, Chem. Rev., 2012, 112, 1126–1162 CrossRef CAS PubMed.
- Lanthanide Luminescence: Photophysical, Analytical and Biological Aspects, ed. P. Hänninen and H. Härmä, Springer, 2011 Search PubMed.
- Guideline IHT, Validation of analytical procedures: text and methodology, Q2 (R1), 2005, vol. 1, pp. 1–15 Search PubMed.
- Stationery Office (Great Britain), British pharmacopoeia 2009, Stationery Office, London, 2008 Search PubMed.
- M. V. Ribeiro, I. S. Melo, F. C. Lopes and G. C. Moita, Braz. J. Pharm. Sci., 2016, 52(4), 741–750 CrossRef CAS.
- T. Meropi, A. Panagiotis, M. Triantafillos, S. Magdalini and T. Thalia, Anal. Lett., 2007, 40, 2203–2216 CrossRef.
- A. Lebiedzińska, M. Dąbrowska, P. Szefer and M. Marszałł, Toxicol. Mech. Methods, 2008, 18, 463–467 CrossRef PubMed.
- R. M. Kok, D. E. C. Smith, J. R. Dainty, J. T. V. Akker, P. M. Finglas, Y. M. Smulders, C. Jakobs and K. D. Meera, Anal. Biochem., 2004, 326, 129–138 CrossRef CAS PubMed.
- M. S. Newman, T. R. Brandon, M. N. Groves, W. L. Gregory, S. Kapur and D. T. Zava, J. Diabetes Sci. Technol., 2009, 3, 156–162 CrossRef PubMed.
- D. Eyles, C. Anderson, P. Ko, A. Jones, A. Thomas, T. Burne, P. B. Mortensen, B. Nørgaard-Pedersen, D. M. Hougaard and J. A. McGrath, Clin. Chim. Acta, 2009, 403, 145–151 CrossRef CAS PubMed.
- Z. Cai, Q. Zhang, Z. Xia, S. Zheng, L. Zeng, L. Han, J. Yan, P. Ke, J. Zhuang, X. Wu and X. Huang, Nutr. Metab., 2020, 17, 8, DOI:10.1186/s12986-020-0427-7.
- F. Keyfi, S. Nahid, A. Mokhtariye, S. Nayerabadi, A. Alaei and A. Varasteh, J. Anal. Sci. Technol., 2018, 9 DOI:10.1186/s40543-018-0155-z.
| This journal is © The Royal Society of Chemistry 2021 |