 Open Access Article
Simultaneously enhancing the crystallization rate and fire retardancy of poly(lactic acid) by using a novel bifunctional additive trimethylamine phenylphosphonate†
Qin Jina,
Guo-Qiang Tianb,
Rong Hea,
Hai-Long Gua,
Fang Wu *a and
Jiang Zhu*a
aCollege of Materials Science and Engineering, Chongqing University of Arts and Sciences, Chongqing 402160, P. R. China. E-mail: wfjustdoit@163.com; Fax: +86-023-15123252084, +86-023-49512058; Tel: +86-023-15123252084, +86-023-49512058
bCenter for Degradable and Flame-Retardant Polymeric Materials (ERCPM-MoE), College of Chemistry, State Key Laboratory of Polymer Materials Engineering, National Engineering Laboratory of Eco-Friendly Polymeric Materials (Sichuan), Sichuan University, 29 Wangjiang Road, Chengdu 610064, P. R. China
First published on 10th August 2021
Abstract
Simultaneously regulating the crystallizing and combustion behaviors of poly(lactic acid) (PLA) will be conducive to its further development in the fields of electronic appliances, automotive and rail transit materials. To achieve this goal, a novel bifunctional additive triethylamine phenylphosphonate (TEAP) was synthesized through acid–base neutralization reaction between trimethylamine and phenylphosphonic acid. When TEAP was added into PLA, the crystallization behaviors of PLA/TEAP assessed by differential scanning calorimetry (DSC) and polarized optical microscopy (POM) suggested that TEAP acted as a nucleating agent and plasticizer for PLA, which effectively increased the crystallization rate of PLA. However, PLA with 3 wt% TEAP showed a slower crystallization rate than that of PLA with 1 wt% TEAP due to the filler aggregation of TEAP. Thus, the crystallization rate increased first and then slightly decreased with increasing content of TEAP. Compared with the variation of the crystallization rate, the long period (L) and amorphous layer thickness (La) resulting from SAXS showed opposite trends, while the average crystal thickness (Lc) changed slightly; the reason may relate to the variation of the number of lamellae with increasing the content of TEAP. Meanwhile, the results of WAXD and Raman spectra showed the crystal structure of PLA was not affected by the addition of TEAP. The combustion behaviors of PLA and PLA/TEAP were evaluated by the limiting oxygen index (LOI), UL-94 test, cone calorimetry test (CCT) and thermal gravimetric analyses coupled to Fourier transform infrared spectroscopy (TGA-FTIR). According to the results, TEAP mainly promotes the removal of melt dripping, hence brings away heat and delays the combustion. Besides, the production of phosphorus-containing free radicals can quench hydrogen or oxygen free radicals in the fire. Thus, the fire safety of PLA is significantly improved by adding a very low content of TEAP (1–3 wt%). Only 1 wt% loading of TEAP can increase the LOI value of PLA from 19.5 vol% to 28.6 vol%, pass the UL-94 V-0 rating and have a low peak heat release rate of 404 kW m−2.
1. Introduction
Owing to the excellent biocompatibility, easy processibility, high melting temperature and mechanical properties,1–4 poly(lactic acid) (PLA) is considered to be one of the most promising biodegradable polymers for decreasing environmental pollution caused by the indiscriminate use of non-degradable fossil-based plastics.5–7 However, in many new fields such as electronic appliances, automotive and rail transit materials, its low crystallization rate and flammability restrict its further development.8–15 In order to modify the flammability and crystallization behaviors of PLA, chemical modification and physical blending as the major strategies have been employed.16–22 Although chemical modification effectively improves the intrinsic properties of PLA, it is difficult to achieve large-scale industrial and commercial applications due to the complex synthesis. In comparison with chemical modification, physical blending with retardants is simple, convenient and suitable for industrial popularization.The halogen-free flame retardants have been the major additives for PLA to endow it with flame-retardancy, which are simply classified into nanoparticles, intumescent flame retardants and phosphorus-containing flame retardants.23–31 In most cases, a high loading of these typical flame retardants is needed for PLA to acquire satisfactory anti-flammability,25–30 Yang et al. incorporated a combination of calcium magnesium phytate (CaMg-Ph)/carbon nanotubes (CNT) into PLA; 20 wt% of this combined system are needed to make PLA possess a low peak heat release rate.30 Owing to the poor compatibility between PLA and flame retardants in physical blending, the increase of flame retardants is usually followed by deterioration of other properties. Tawiah et al. synthesized flame retardant phenylphosphonic bis(2-aminobenzothiazole) (P-ABZT) and incorporated it into PLA; the flame retardancy of PLA was obviously improved, but the degree of crystallinity of PLA decreased with increasing P-ABZT content.31 On the other side, for regulating the crystallization ability of PLA, adding nucleating agents into PLA is a direct and effective method. In a general classification, nucleating agents can be categorized as mineral, organic and mineral–organic.32–34 Usually, the loading content of the nucleating agents is lower than 3 wt% due to the incompatibility between PLA and these typical nucleating agents. El-Taweel et al. used YVO4 as the nucleating agent for PLA, and the results show 1 wt% of the nucleating agent is more efficient than 4 wt% due to the filler aggregation.33
Simultaneously modifying the flammability and crystallization behaviors of PLA by simply adding flame retardant and nucleating agent together not only increases the production cost but also exists the incompatibility between PLA, flame retardant and nucleating agent. Besides, to acquire satisfactory anti-flammability, a high loading content (≥10 wt%) of the typical flame retardants is needed, in turn, to endow PLA with fast crystallization, a low loading content (≤3 wt%) of nucleating agent is needed. Owing to the different loading content of the two additives, the cross-influence will happen. Thus, adding a bifunctional additive will be a better way.18 During designing the bifunctional additive, the high efficiency of anti-flammability must be considered to meet the low content requirements as nucleating agents. To date, some ammonium phosphates such as N,N′-diallyl-P-phenylphosphonic diamide (P-AA)35 and dihydroxy-containing ammonium phosphate (DAP)36 have been reported to exert high flame-retardant effect on polymers, which have the possibility to be the bifunctional additive. Herein, inspired by these phenomena, a novel bifunctional phosphorus-based additive triethylamine phenylphosphonate (TEAP) has been synthesized. TEAP not only shows the high flame-retardant effect but also demonstrates the excellent nucleation efficiency.
2. Experimental section
2.1 Materials
Triethylamine (TEA) (AR grade) was purchased from Kelong Chemical Corporation (Chengdu, China). Phenylphosphonic acid (PPOA) was purchased from Adamas (Shanghai, China). PLA (4032D) was purchased from NatureWorks LLC. And other chemicals were purchased from Kelong Chemical Corporation. All the reagents were used without any further purification.2.2 Synthesis of triethylamine phenylphosphonate (TEAP)
TEAP was prepared by an easy one-pot acid base neutralization reaction. The detailed synthetic process of TEAP was as follows: 0.1 mol of PPOA was added into a 100 ml 3-necked round bottom flask equipped with condenser and magnetic stirrer, and kept below 5 °C by the immersion of the flask in an ice-water bath. At this temperature, 0.3 mol of TEA was added into the flask, and then the temperature increased to 50 °C for precipitated product to develop. The precipitated product was filtered and washed several times with ethyl acetate to remove the unreacted TEA. The product was dried at 50 °C for 24 h to obtain a white compound, the product yield was 90 wt%. The melting point of TEAP is 120 °C.2.3 Sample preparation
The PLA composites were prepared by hot pressing at 175 °C. Before the hot pressing, PLA premixed with TEAP in mutual solvent chloroform, and then the solution of polymers was allowed to evaporate in a controlled air stream for one day. In this way, four samples were prepared (see Table 1) and named as PLA/TEAPx. PLA/TEAPx represents that the sample contains x wt% of TEAP, for example, PLA/TEAP1.0 means the sample contains 1 wt% TEAP.| Sample | Tg (°C) | Tcc (°C) | ΔHcc (J g−1) | Tc (°C) | ΔHc (J g−1) | Tm (°C) | ΔHm (J g−1) |
|---|---|---|---|---|---|---|---|
| PLA | 58.5 | — | — | — | — | 166.4 | 2.4 |
| PLA/TEAP0.5 | 52.4 | 106.4 | 12.5 | 100.4 | 13.5 | 167.1 | 18.8 |
| PLA/TEAP1.0 | 47.9 | 93.4 | 13.7 | 105.2 | 21.1 | 163.2 | 20.9 |
| PLA/TEAP3.0 | 53.7 | 102.9 | 12.5 | 98.1 | 10.8 | 164.9 | 19.9 |
2.4 Characterization
1H NMR was recorded on a Brucker AC-P400 MHz spectrometer at ambient temperature in CDCl3 solution with tetramethylsilane as the internal reference.Thermal gravimetric analysis (TGA) was performed on thermogravimetric analyzer (NETZSCH STA 449F3, Germany) in a nitrogen atmosphere at a heating rate of 10 °C min−1 within temperature range from 50 °C to 600 °C.
A TA DSC-Q200 was utilized to study glass transition temperature (Tg), crystallization temperature and enthalpy, and melting temperature and fusion enthalpy of samples. Typically, 5 mg samples in aluminum pans were first melt at 175 °C for 3 min to eliminate any thermal history, and then quenched to amorphous state. After that, the samples were heated from −40 °C to 175 °C at a rate of 10 °C min−1, subsequently cooled to −40 °C at a rate of 10 °C min−1.
The isothermal crystallization kinetics of PLA and PLA/TEAP were studied by DSC. Typically, 5 mg samples were quickly heated to 175 °C and held for 3 min to remove thermal history, then quenched to predetermine crystallization temperature, and then held at this temperature until complete crystallization of the samples.
The spherulitic morphology of PLA and PLA/TEAP were studied with a polarized optical microscope (POM; Nikon Eclipse LV100POL, Nikon, Tokyo, Japan) equipped with a hot stage (HSC621V). The sample films were prepared by casting and evaporation of the polymer chloroform solution on a microscope cover glass. The concentration of the solution was 50 mg ml−1. The samples were first melted at 175 °C for 3 min to remove any previous thermal history and quenched to a predetermined crystallization temperature and maintained at that temperature until the crystallization completed.
Wide-angle X-ray diffraction patterns were recorded with an X-ray diffractometer (Philips X'Pert X-ray diffractometer) with Cu-Kα radiation. The equipment was operated at room temperature with a scan rate of 2° min−1 scanning from 5 to 40°.
The Raman spectroscopy was made using a LabRAM HR Evolution micro-spectrometer (HORIBA). For recording spectra, we used an exciting wavelength (λ = 532 nm) that is provided by a helium-neon laser.
The SAXS experiment was employing synchrotron radiation (λ = 0.150 nm) at the beamline A2 HASYLAB (Hamburg, Germany) and synchrotron radiation with λ = 0.154 nm at beamline 1W2A of Beijing Synchrotron Radiation Facility (Beijing, China). All the data were corrected for background scattering before analysis and treated with software Fit 2D.
Limiting oxygen index (LOI) values were tested on an oxygen index detector (HC-2, Jiangning Analysis Instrument Company, China). According to ASTM D2863-19, composites with measuring 130 mm × 6.5 mm × 3.2 mm were evaluated.
The UL-94 tests were conducted on a vertical flame chamber (CZF-III, Jiang Ning Analysis Instrument Factory, China). According to ASTM D3801, the sizes of samples were 130 mm × 13 mm × 3.2 mm.
The cone calorimetry tests were conducted based on ASTM E1354/ISO 5660. Specimens with dimensions of 100 mm × 100 mm × 3 mm and a 35 kW m−2 external heat flux were chosen.
The flame retardancy index (FRI) was defined as:33,37
 | (1) |
Thermal gravimetric analyses coupled to Fourier transform infrared spectroscopy (TGA-FTIR) measurements were performed with a thermo gravimetric analyzer (209 F1, Netzsch, Germany) coupling with a FTIR spectroscopy (Thermo Nicolet iS10, Thermosher, Germany). The volatiles evolved from TG could be transport to the gas cell of FTIR through a transfer pipe by the suitable gas flow. The test procedure for TGA was 10 °C min−1 from 40 to 700 °C min−1 under N2 atmosphere.
3. Results and discussion
3.1 Synthesis and characterization of TEAP
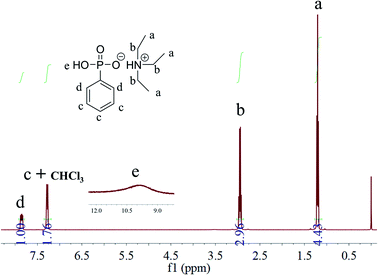
As shown in Scheme 1, TEAP was synthesized through acid–base neutralization reaction. The easy synthesis is more conducive to achieving large-scale industrial. In the reaction system, the molar ratio of TEA and PPOA is 3/1, the main purpose of this molar ratio is to make the reaction of PPOA more thorough, and the excess TEA can be used as the reaction solvent to make the heat transfer more uniform.The chemical structure of TEAP was confirmed by 1H NMR. As shown in Fig. 1, the peaks at 7.85 ppm and 7.29 ppm correspond to the protons in phenyl ring. The peak located at 10.00 ppm belongs to P–OH. The quadruple peak at 2.95 ppm and the triple peak at 1.17 ppm correspond to –CH2–NH– and CH3–CH2, respectively. No extra impurity peaks can be observed in the NMR spectrum, indicating TEAP has high purity. Based on the above analyses, it is confirmed that the bifunctional additive has been successfully synthesized.
3.2 Thermal stabilities of PLA and PLA/TEAP
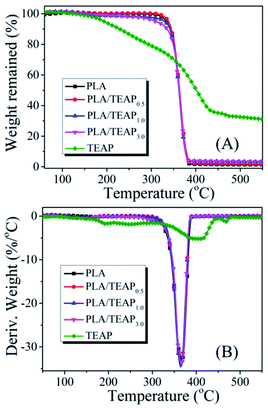
The thermal stabilities of PLA and PLA/TEAP are characterized by TGA and displayed in Fig. 2. It can be evidently observed from TGA and DTG curves that the T5% values of TEAP and PLA are 183 °C and 332 °C, respectively. When TEAP is added into PLA, the T5% values of PLA/TEAP0.5, PLA/TEAP1.0 and PLA/TEAP3.0 are presented at 337, 329 and 308 °C, respectively, indicating that the introduction of TEAP (≤3 wt%) hardly influences the thermal stability of the PLA due to the low addition of TEAP, and these PLA composites can fully meet the thermal stability requirement for the processing and the potential application in electric and electronic. Besides, the Tmax values of PLA and PLA/TEAP are at around 364–367 °C, this phenomenon also suggests the influence of TEAP is little for the thermal stabilities of composites. As shown in Fig. 2A, the corresponding char residues of PLA, PLA/TEAP0.5, PLA/TEAP1.0 and PLA/TEAP3.0 are 1.32 wt%, 1.69 wt%, 3.19 wt% and 3.37 wt%, respectively, meaning that TEAP can exert influence on char-formation of PLA, although the catalyzing charring ability of TEAP for PLA is not remarkable, this result will be further confirmed in the discussion of the combustion behavior.3.3 Thermal transition and crystallization behaviors of samples
The thermal properties of the polymer samples were investigated by differential scanning calorimetry (DSC). Fig. 3A shows the DSC heating scans of PLA and PLA/TEAP at a heating rate of 10 °C min−1 from the melt-quenched amorphous state, and Table 1 summarizes the characteristic thermal parameters of samples. For PLA, its glass transition temperature (Tg) and melting temperature (Tm) are found at 58.5 °C and 166.4 °C, respectively. It can be seen that PLA and PLA/TEAP show similar melting temperature (Tm) at around 165 °C, suggesting that the incorporation of TEAP almost does not change the Tm value of PLA. However, the glass transition temperatures of samples initially decrease and then increase with increasing the content of TEAP, and the lowest Tg is observed for PLA/TEAP1.0. This phenomenon implies that TEAP can enhance the molecular chain mobility of PLA, but the plasticization of TEAP will weaken due to the aggregation of TEAP when the content of TEAP increases to 3 wt%. The aggregation of TEAP in PLA/TEAP3.0 is also observed by SEM (shown in Fig. S1†).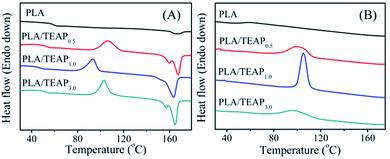 | ||
| Fig. 3 DSC thermograms of samples, first heating scans from melt-quenched state at a rate of 10 °C min−1 (A); cooling scans at a rate of 10 °C min−1 (B). | ||
As shown in Fig. 3A, PLA has no cold crystallization temperature (Tcc) during the first heating scan, whereas when TEAP is added, all samples show a narrow cold crystallization peak. The cold crystallization temperatures of PLA/TEAP0.5, PLA/TEAP1.0 and PLA/TEAP3.0 are presented at 106.4, 93.4 and 102.9 °C, respectively. Compared with PLA, it is worth noting that the enthalpy of melting Table 1 (ΔHm) and the enthalpy of cold crystallization (ΔHcc) of PLA/TEAP composites increase obviously. Meanwhile, Fig. 3B shows the DSC cooling curves of samples at a cooling rate of 10 °C min−1 from their melting state. The values of heat crystallization temperature (Tc) and crystallization enthalpy (ΔHc) are also shown in Table 1. The heat crystallization of PLA is not detected during cooling scan, but the heat crystallization temperatures of PLA/TEAP0.5, PLA/TEAP1.0 and PLA/TEAP3.0 are presented at 100.4, 105.2 and 98.1 °C, respectively, and the enthalpy of heat crystallizations (ΔHc) of PLA/TEAP are much higher than that of PLA. In general, for the same polymer, the lower cold crystallization temperature or the higher heat crystallization temperature indicates a faster crystallization rate.38 Thus, the above results suggest that TEAP has a remarkable influence on the overall crystallization rate of PLA, and PLA/TEAP1.0 shows the optimal crystallizability.
| Samples | Tc (°C) | n | k × 102 (min−1) | t1/2 (min) |
|---|---|---|---|---|
| PLA | 115 | 1.83 | 5.56 | 3.96 |
| 118 | 1.88 | 3.84 | 4.65 | |
| 121 | 1.77 | 2.38 | 6.73 | |
| 124 | 1.82 | 1.07 | 9.97 | |
| PLA/TEAP0.5 | 115 | 2.58 | 40.3 | 1.23 |
| 118 | 2.80 | 23.5 | 1.47 | |
| 121 | 2.31 | 5.91 | 2.91 | |
| 124 | 1.88 | 2.27 | 6.17 | |
| PLA/TEAP1.0 | 115 | 2.66 | 83.7 | 0.93 |
| 118 | 2.93 | 44.9 | 1.16 | |
| 121 | 2.38 | 6.23 | 2.75 | |
| 124 | 1.83 | 2.85 | 5.73 | |
| PLA/TEAP3.0 | 115 | 2.54 | 17.5 | 1.72 |
| 118 | 2.55 | 5.46 | 2.71 | |
| 121 | 1.79 | 3.74 | 5.12 | |
| 124 | 1.58 | 2.41 | 8.34 |
3.4 Isothermal crystallization kinetics of PLA and PLA/TEAP
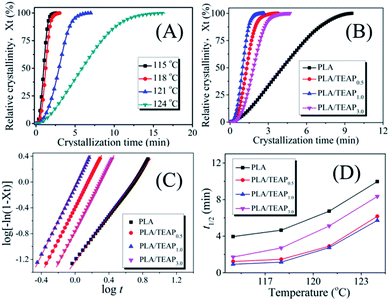
To further study the influence of TEAP on the crystallization behavior of PLA, the isothermal crystallization kinetics of samples were investigated by DSC. Fig. 4A shows the development of relative crystallinity (Xt) with crystallization time (t) for PLA/TEAP1.0 at temperatures of 115–124 °C. As shown in Fig. 4A, the time needed to complete crystallization increases when the crystallization temperature increases, indicating that the crystallization is retarded with increasing temperature. The developments of Xt with t for PLA, PLA/TEAP0.5 and PLA/TEAP3.0 show the similar phenomenon with increasing crystallization temperature; for brevity, the plots are not shown in this study. Focusing on the crystallization behavior of different compositions, the development of Xt with t for samples at the crystallization temperature of 115 °C is shown in Fig. 4B. It can be seen that all of PLA/TEAP composites complete 100% crystallization in a much shorter time; in particular, PLA/TEAP1.0 finishes crystallization almost 4 times faster than PLA. A similar tendency was also obtained at other temperatures. This phenomenon suggests that TEAP plays a very important role in the crystallization behavior of PLA/TEAP.In order to further analysis of crystallization effect of TEAP, the Avrami equation is applied:
| 1 − Xt = exp(−ktn) | (2) |
log[−ln(1 − Xt)] = log![[thin space (1/6-em)]](https://www.rsc.org/images/entities/char_2009.gif) k + n k + n![[thin space (1/6-em)]](https://www.rsc.org/images/entities/char_2009.gif) log log![[thin space (1/6-em)]](https://www.rsc.org/images/entities/char_2009.gif) t t
| (3) |
A plot of log[−ln(1 − Xt)] versus log![[thin space (1/6-em)]](https://www.rsc.org/images/entities/char_2009.gif) t would give a straight line from which both the rate constant and the Avrami exponent can be derived. Typically, Fig. 4C shows the Avrami plots of PLA and PLA/TEAP at 115 °C, a series of straight lines are obtained, similar straight lines are also obtained at other crystallization temperature, indicating the Avrami equation is suitable for treatment isothermal crystallization kinetics of the samples. By calculation, the Avrami parameters n and k are summarized in Table 2. It is obvious that the values of n varied slightly between 1.58 and 2.93 for all the PLA/TEAP composites within the temperature range involved in this study, suggesting that the crystallization kinetics of PLA/TEAP composites correspond to heterogeneous nucleation.38–40 The half-time of crystallization (t1/2) defined as the time needed to achieve 1/2 of the final crystallinity is another important parameter to evaluate crystallization rate of the samples, which can be obtained by t1/2 = (ln
t would give a straight line from which both the rate constant and the Avrami exponent can be derived. Typically, Fig. 4C shows the Avrami plots of PLA and PLA/TEAP at 115 °C, a series of straight lines are obtained, similar straight lines are also obtained at other crystallization temperature, indicating the Avrami equation is suitable for treatment isothermal crystallization kinetics of the samples. By calculation, the Avrami parameters n and k are summarized in Table 2. It is obvious that the values of n varied slightly between 1.58 and 2.93 for all the PLA/TEAP composites within the temperature range involved in this study, suggesting that the crystallization kinetics of PLA/TEAP composites correspond to heterogeneous nucleation.38–40 The half-time of crystallization (t1/2) defined as the time needed to achieve 1/2 of the final crystallinity is another important parameter to evaluate crystallization rate of the samples, which can be obtained by t1/2 = (ln![[thin space (1/6-em)]](https://www.rsc.org/images/entities/char_2009.gif) 2/k)1/n. The values of t1/2 are summarized in Fig. 4D. As shown in Fig. 4D, all PLA/TEAP composites show a shorter t1/2 value than PLA at a given Tc, and the shortest t1/2 is achieved by PLA/TEAP1.0. These results also suggest that the overall crystallization rates of PLA/TEAP composites are much faster than that of PLA, and PLA/TEAP1.0 has the fastest overall crystallization rate.
2/k)1/n. The values of t1/2 are summarized in Fig. 4D. As shown in Fig. 4D, all PLA/TEAP composites show a shorter t1/2 value than PLA at a given Tc, and the shortest t1/2 is achieved by PLA/TEAP1.0. These results also suggest that the overall crystallization rates of PLA/TEAP composites are much faster than that of PLA, and PLA/TEAP1.0 has the fastest overall crystallization rate.
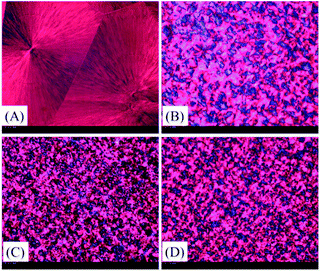
It is well known that crystallization rate is dependent on both nucleation efficiency and crystal growth rate. To estimate the nucleating efficiency (NE) of PLA/TEAP, POM imaging was performed. Fig. 5 shows the POM images for spherulitic morphology of PLA and PLA/TEAP formed at a crystallization temperature of 125 °C. As shown in Fig. 5, all the samples show compact spherulites irrespective of composition. Compared with PLA, the PLA/TEAP composites possess many more nucleation sites and exhibit much smaller spherulite sizes, indicating adding TEAP indeed obviously improves the nucleating efficiency of PLA. The PLA/TEAP1.0 exhibits the highest nucleating efficiency even though it does not have the highest content of TEAP. The nucleating efficiencies of PLA/TEAP composites not only determine by the TEAP concentration but also relate to its aggregation state. When the loading content of TEAP is 3 wt%, the aggregation of TEAP inevitably leads to the formation of nucleation sites larger in size but fewer in number, so the nucleating efficiency of PLA/TEAP3.0 is lower than that of PLA/TEAP1.0.
Since the nucleation efficiency for PLA is improved by blending with TEAP, it is necessary to study if the crystal structure was influenced. WAXD and Raman spectra were used to characterize the crystal modifications of PLA and PLA/TEAP; meanwhile, SAXS was used to characterize microstructure parameters of samples. Before the tests, the samples were melted at 175 °C for 3 min, then quenched to 125 °C and kept at the temperature 4 hours. Fig. 6A shows the WAXD patterns of samples. As shown in Fig. 6A, PLA shows four strong diffraction peaks located at 2θ values of 14.8°, 16.6°, 18.9° and 22.3° corresponding to (010), (110/200), (203) and (105) planes,41 suggesting that the crystal modification of PLA is α form. In the case of PLLA/TEAP composites, no shift has been found for these diffraction peaks, indicating that the addition of TEAP did not affect the crystal structure of PLA. Fig. 6B shows the Raman spectra of samples, the observed wavenumbers of PLA/TEAP composites are the same with PLA, and the Raman bands at 922 cm−1 and 538 cm−1 are also associated with crystalline phase corresponding to a helical conformation (α form),42 this result further confirmed that the addition of TEAP did not affect the crystal structure of PLA when samples complete crystallization at 125 °C. The effect of TEAP on microstructure parameters of PLA was characterized by SAXS. Fig. 6C shows the SAXS patterns of the annealed samples carried out at room. With increasing the content of TEAP, the peak maximum of the SAXS profile initially shifts into the higher q region and then slightly shifts into the lower q region, The long period (L), amorphous layer thickness (La) and the average crystal thickness (Lc) can be calculated from the normalized one-dimensional correlation function, which obtained from the Lorentz-corrected SAXS intensity profile.43 The specific curves for calculating the microstructure parameters of samples were shown in Fig. 6D. When the content of TEAP is no more than 3 wt%, Lc changes slightly, while La and L initially decrease and then slight increase with increasing the content of TEAP. This further leads to the peak maximum of the SAXS profile initially shifts into the higher q region and then slightly shifts into the lower q region with increasing the content of TEAP, and the similar phenomena were also reported by others.44,45 PLA and PLA/TEAP form lamellar crystals with almost the same value of Lc when crystallized at the same crystallization temperature, indicating that no thickening occurs during the isothermal crystallization.44 Based on the result of isothermal crystallization kinetics, it is well know that the crystallization rate of samples initially increase and then slight decrease with increasing the content of TEAP, and PLA/TEAP1.0 has the fastest overall crystallization rate, so the number of lamellae will also initially increases and then slightly decreases with increasing the content of TEAP during stack building, which in turn led to the value of La will show the opposite trend.44,45 Meanwhile, the change of the long period L during crystallization should be attributed to the change of the amorphous layer thickness La.44,45
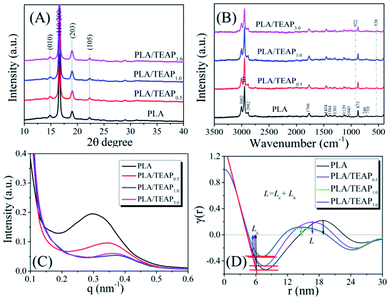 | ||
| Fig. 6 The WAXD patterns (A), Raman spectra (B), SAXS patterns (C), and structure analysis of samples using the normalized one-dimensional correlation function (D). | ||
Via the above analysis, it is found that the designed TEAP plays a significant role in the crystallization processes of PLA composites. For PLA/TEAP, TEAP not only acts as a plasticizer to accelerate crystal growth, but also acts as a heterogeneous nucleation site to improve the nucleation efficiency of PLA. These factors contribute to the result that adding TEAP to PLA significantly improves the crystallization rate of PLA. Meanwhile, when the content of TEAP increases to 3 wt%, the difference in polarity between the PLA matrix and TEAP leads to the aggregation of TEAP, which weakens the influence of TEAP on the crystallization rate of PLA. The crystallization behavior of polymer is an important factor to influence its properties and determines the fields where the polymer can be used in. Tunable crystallization behavior of PLA is achieved through changing the loading content of TEAP in PLA/TEAP, making it is possible to adapt to a variety of processing conditions.
3.5 Combustion behavior of PLA and PLA/TEAP
The flammability properties of PLA and PLA/TEAP composites are examined by UL-94 and LOI, and results are listed in Table 3. PLA is easy to catch fire and cannot extinguish until the specimen burn out, resulting in no rating in UL-94 tests and a low LOI value of 19.5%. However, the burning processes of PLA/TEAP composites have a significant change. The LOI of PLA increases to 24.2% after loading 0.5 wt% TEAP, but this sample does not pass the V-0 rating due to melt flame dripping. The LOI value further increases to 28.6 and 30.0% with the 1 and 3% TEAP loading, respectively, and V-0 rating is attained with faster self-extinguishing ability.| Samples | LOI (%) | Dripping | Cotton ignited | t1 + t2 | UL-94 |
|---|---|---|---|---|---|
| PLA | 19.5 | Y | Y | Burning out | NR |
| PLA/TEAP0.5 | 24.2 | Y | Y | 13 + 2 | V-2 |
| PLA/TEAP1.0 | 28.6 | Y | N | 4 + 2 | V-0 |
| PLA/TEAP3.0 | 30.0 | Y | N | 1 + 1 | V-0 |
This phenomenon implies that loading TEAP in PLA can effectively stop the fire spreading because the burning part will quickly drop off and stop the rest of the polymer from burning. Also, fire accidents caused by melt dripping will be effectively avoided due to the absence of melt flame drips by the PLA/TEAP composites.
Cone calorimeter test (CCT) is widely used for assessing the flammability of materials at the bench scale. PLA, PLA/TEAP1.0 and PLA/TEAP3.0 were tested in the cone calorimeter with a heat flux of 35 kW m−2. The results derived from CCT, such as time to ignition (TTI), heat release rate (HRR), peak heat release rate (pHRR), the time to pHRR (t-pHRR), total heat release (THR), average effective combustion heat (av-EHC) and total smoke production (TSP) are presented in Table 4 and Fig. 7. As shown in Table 4, when TEAP is added into PLA matrix, the TTI values of PLA/TEAP composites are around 53 s, which is basically as the same as pure PLA (53 s), whereas t-pHRR values gradually shift from 165 s to 130 s. The earlier t-pHRR indicates that the TEAP can promote the thermal decomposition of PLA, which play a part in improving the flame retardancy.
| Samples | TTI (s) | pHRR (kW m−2) | THR (MJ m−2) | t-pHRR (s) | FIR | TSP (m2) | av-EHC (MJ kg−1) | Residue (wt%) |
|---|---|---|---|---|---|---|---|---|
| PLA | 53 | 466 | 56.1 | 165 | 1 | 0.4 | 17.5 | 0 |
| PLA/TEAP1.0 | 51 | 417 | 55.6 | 145 | 1.1 | 0.4 | 17.3 | 3.2 |
| PLA/TEAP3.0 | 54 | 404 | 51.9 | 130 | 1.3 | 1.0 | 16.9 | 4.9 |
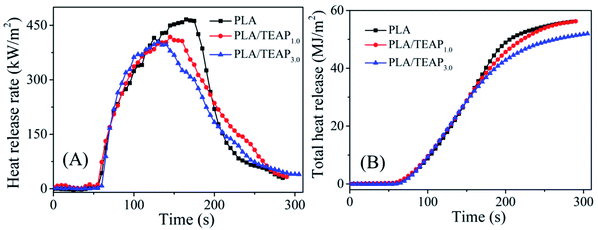 | ||
| Fig. 7 The curves of heat release rate (A) and total heat release (B) versus time for PLA and PLA/TEAP. | ||
In addition, seen from Fig. 7, the pHRR of PLA is 466 kW m−2 and THR is 56.1 MJ m−2. When 1 wt% TEAP is added, the pHRR of PLA reduces to 417 kW m−2 and THR decreases to 55.6 MJ m−2. The loading content of TEAP further increases to 3 wt%, the pHRR of PLA reduces to 404 kW m−2 and THR decreases to 51.9 MJ m−2. This phenomenon implies that the addition of TEAP can suppress the combustion of PLA and lower the pHRR and THR. Flame retardancy index (FRI) is a simple criterion for quantifying the flame retardancy of polymeric composites, which is calculated by eqn (1). The FRI values of PLA/TEAP1.0 and PLA/TEAP3.0 are 1.1 and 1.3, respectively, indicating PLA composites have good flame retardancy.37,51 Moreover, no residues are found for PLA, whereas the introduction of TEAP can increase the residue weight of PLA with varying degrees. PLA/TEAP1.0 and PLA/TEAP3.0 present the maximum final residue of 3.2 wt% and 4.9 wt%, respectively. This phenomenon suggests that TEAP can catalyze the carbonization of PLA in solid phase, which corresponds with the results of TGA. Considering the slight increase of the residue weight of PLA composites, the catalyzing charring ability of TEAP for PLA is not remarkable. For the PLA composites, TEAP increases the LOI values and improves the rating in UL-94 testing, but shows minimal effect on pHRR and THR values in CCT, indicating that TEAP cannot effectively promote PLA to construct a protective char layer during combustion due to the little char yield. A similar result was also reported by others.19,35,36,51
For the average effective combustion heat (av-EHC), it can be found that av-EHC values of PLA/TEAP1.0 (17.3 MJ kg−1) and PLA/TEAP3.0 (16.9 MJ kg−1) are slightly lower than that of PLA (17.5 MJ kg−1). The result indicates that TEAP shows minimal effect on the av-EHC of PLA. With the incorporation of TEAP, the TSP of PLA is increased slightly. The TSP values of PLA/TEAP1.0 and PLA/TEAP3.0 are 0.4 and 1.0 m2, respectively, which are still in the acceptable range.
3.6 Pyrolysis gaseous product analysis
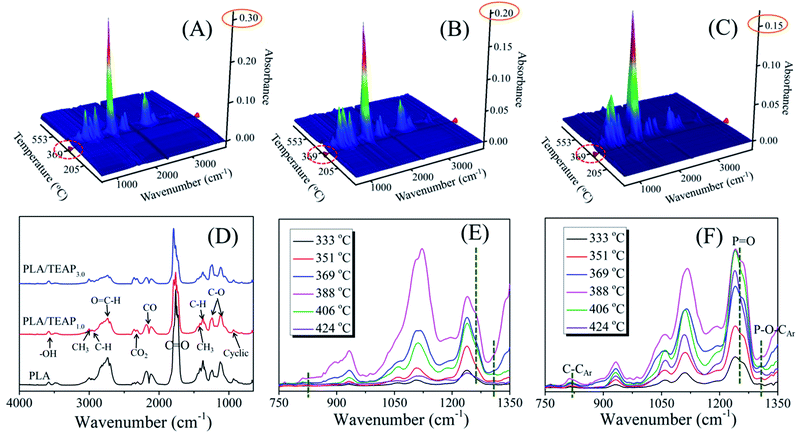
TG-FTIR was used to analyze the evolved gas products of PLA and PLA/TEAP. Fig. 8A–C show the three-dimensional TG-FTIR spectra for the thermal decomposition of PLA, PLA/TEAP1.0 and PLA/TEAP3.0, respectively. No obvious difference can be seen from the IR spectrum for the pyrolysis gases of PLA and PLA/TEAP, implying that similar volatile gases are released during the thermal degradation process. However, the intensity of absorption peaks and the emerging temperatures of the degraded volatiles decrease with increasing the content of TEAP, meaning that the TEAP not only makes PLA release less gas pyrolysis products, but also makes the degradative temperature of PLA decrease. Fig. 8D shows the gaseous products of PLA and PLA/TEAP at 388 °C. At this temperature, all the samples show a maximum decomposition rate. The characteristic gaseous, such as H2O (3400–3650 cm−1), hydrocarbons (2900–3000 cm−1), aldehyde containing compounds (2600–2800 cm−1), CO2 (2300–2400 cm−1), CO (2100–2200 cm−1), carbonyl compounds (1600–1800 cm−1) and C–O (1100–1250 cm−1), are observed. As shown in Fig. 8D, although the main feature peaks of PLA/TEAP1.0 and PLA/TEAP3.0 are similar with that of PLA, the intensities of absorption peaks decrease with increasing the content of TEAP. Through comparing the intensities of CO2/CO, it can be found that increasing the content of TEAP can increase the intensity of CO2 and decrease the intensity of CO. Usually, the transesterification and the chain hemolysis are the main reactions during the pyrolysis of PLA.45–47 CO is the specific products of transesterification and lactide is the specific products of chain hemolysis, meanwhile, it is known that the CO2 is mainly derived from the decarboxylic reaction of lactide.47–50 With increasing the content of TEAP, the increase of CO2 is accompanied by the decrease of CO, suggesting that the addition of TEAP impacts the elementary reactions of thermal decomposition of PLA and the chain hemolysis of PLA are promoted. The degraded volatiles of PLA and PLA/TEAP3.0 at variable temperatures are depicted in Fig. 8E and F, respectively. In comparison with PLA, PLA/TEAP3.0 shows new absorption peaks at 817, 1256 and 1303 cm−1. The absorption peaks exhibited at 817, 1256 and 1303 cm−1 belong to the stretching vibration of C–CAr, P![[double bond, length as m-dash]](https://www.rsc.org/images/entities/char_e001.gif) O and P–O–CAr, respectively.31,51 It is known that these phosphorus-containing compounds can further generate phosphorus-containing free radicals, which can quench the hydrogen or oxygen free radicals formed during combustion. In other words, TEAP will generate phosphorus-containing free radicals, and then it can exert a quenching effect in gas phase to inhibit the combustion.
O and P–O–CAr, respectively.31,51 It is known that these phosphorus-containing compounds can further generate phosphorus-containing free radicals, which can quench the hydrogen or oxygen free radicals formed during combustion. In other words, TEAP will generate phosphorus-containing free radicals, and then it can exert a quenching effect in gas phase to inhibit the combustion.
Via the above analysis, it is found that the designed TEAP plays a significant role in the burning processes of PLA composites. The reasons of these phenomena relate to three factors. Firstly, during the combustion, TEAP promotes the decomposition of PLA in advance, which is conducive to the removal of melt dripping. The removal of melt dripping will help to bring away heat and delay the combustion. Subsequently, the elementary reactions of the thermal decomposition of PLA have also been impacted by TEAP, the non-flammable gases (such as CO2 and water) increase and the flammable gases (such as CO and carbonyl compounds) decrease during combustion. Finally, the phosphorus-containing fragments derived from the decomposition of TEAP can produce phosphorus-containing free radicals to quench hydrogen or oxygen free radicals in the fire. These factors not only help to block the combustion reaction, but also accelerate the self-extinguish of flame.
4. Conclusions
In summary, a novel bifunctional additive triethylamine phenylphosphonate (TEAP) was synthesized through an easy one-pot acid–base neutralization reaction. A series of PLA/TEAP were achieved by adding TEAP to PLA matrix. The effects of TEAP on the crystallization behaviors, thermal behaviors and combustion behavior of samples were investigated. TEAP plays an important role in the properties of PLA/TEAP. TEAP not only acts as a plasticizer, but also acts as a heterogeneous nucleation site, and thus the overall crystallization rates of PLA/TEAP composites are much faster than that of PLA, PLA will show the optimum crystallization rate by adding 1 wt% TEAP. WAXD and Raman spectra were used to characterize the crystal modifications of PLA and PLA/TEAP; meanwhile, SAXS was used to characterize microstructure parameters of samples, suggesting that all the samples show a helical conformation (α form) and the addition of TEAP does not affect the crystal structure of PLA when samples complete crystallization at 125 °C. The microstructure parameters of samples shows that Lc changes slightly, while La and L initially decrease and then slight increase with increasing the content of TEAP due to the varied crystallization rate with increasing the content of TEAP. Besides, the T5% and Tmax values of PLA/TEAP composites are close to that of PLA, indicating that the introduction of TEAP (≤3 wt%) hardly influences the thermal stability of the PLA. When the loading content of TEAP is 1 wt%, the LOI value and UL-94 rating can reach 28.6% and V-0 rating. Furthermore, combined with the results of CCT and TG-FTIR, it can be found that TEAP added into PLA can impact the thermal decomposition of PLA and produce phosphorus-containing free radicals to quench hydrogen or oxygen free radicals in the fire, which are conducive to blocking the combustion reaction and self-extinguish the flame.Author contributions
Qin Jin: conceptualization, methodology, investigation, writing-original draft. Guo-Qiang Tian: investigation, writing-original draft, writing-review & editing. Rong He: investigation, writing-review & editing. Hai-Long Gu: writing-review & editing. Fang Wu: review, supervision & editing. Jiang Zhu: review & editing.Conflicts of interest
The authors declare that they have no known competing financial interests or personal relationships that could have appeared to influence the work reported in this paper.Acknowledgements
This work was supported by the National Natural Science Foundation of China (No. 21805023), the Natural Science Foundation of Chongqing, China (No. cstc2020jcyj-msxmX0893), Science and Technology Research Program of Chongqing Municipal Education Commission (No. KJQN201901344), Scientific research project of Chongqing University of Arts and Sciences (R2019FCH08).Notes and references
- X. L. Li, D. S. Yang, Y. B. Zhao, X. Y. Diao, H. W. Bai, Q. Zhang and Q. Fu, Polymer, 2020, 205, 122850–122861 CrossRef CAS.
- A. J. Lasprilla, G. A. Martinez, B. H. Lunelli, A. L. Jardini and R. M. Filho, Biotechnol. Adv., 2012, 30, 321–328 CrossRef CAS.
- S. Farah, D. G. Anderson and R. Langer, Adv. Drug Delivery Rev., 2016, 107, 367–392 CrossRef CAS.
- S. D. Varsavas and C. Kaynak, Compos. Comm., 2018, 8, 24–30 CrossRef.
- A. K. Mohanty, M. Misra and G. Hinrichsen, Macromol. Mater. Eng., 2000, 276, 1–24 CrossRef.
- D. K. Schneiderman and M. A. Hillmyer, Macromolecules, 2017, 50, 3733–3750 CrossRef CAS.
- L. T. Lim, R. Auras and M. Rubino, Prog. Polym. Sci., 2018, 33, 820–852 CrossRef.
- Z. Li, P. Wei, Y. Yang, Y. G. Yan and D. Shi, Polym. Degrad. Stab., 2014, 110, 104–112 CrossRef CAS.
- N. Rahman, T. Kawai, G. Matsuba, K. Nishida, T. Kanaya, H. Watanabe, H. Okamoto, M. Kato, A. Usuki, M. Matsuda, K. Nakajima and N. Honma, Macromolecules, 2009, 42, 4739–4745 CrossRef CAS.
- H. Tsuji, H. Takai, N. Fukuda and H. Takikawa, Macromol. Mater. Eng., 2006, 291(4), 325–335 CrossRef CAS.
- X. Wang and D. Y. Wang, Novel Fire Retardant Polymers and Composite Materials, 2017, pp. 93–116 Search PubMed.
- S. Bourbigot and G. Fontaine, Polym. Chem., 2010, 1, 1413–1422 RSC.
- M. E. Mngomezulu, M. J. John, V. Jacobs and A. S. Luyt, Carbohydr. Polym., 2014, 111, 149–182 CrossRef CAS PubMed.
- L. J. Long, J. B. Yin, W. T. He, S. H. Qin and J. Yu, Ind. Eng. Chem. Res., 2016, 55, 10803–10812 CrossRef CAS.
- D. F. Li, X. Zhao, Y. W. Jia, X. L. Wang and Y. Z. Wang, Compos. Comm., 2018, 8, 52–57 CrossRef.
- D. D. Gao, X. Wen, Y. Gao and T. Tang, Compos. Comm., 2020, 17, 170–176 CrossRef.
- L. Jia, B. Tong, D. H. Li, W. C. Zhang and R. J. Yang, Polym. Adv. Technol., 2019, 30, 648–665 CAS.
- L. B. Liu, Y. Xu, Y. F. Di, M. J. Xu, Y. Pan and B. Li, Composites, Part B, 2020, 202, 108407–108422 CrossRef CAS.
- J. H. Sun, L. Li and J. Li, Chem. Eng. J., 2019, 369, 150–160 CrossRef CAS.
- Y. Ding, W. T. Feng, B. Lu, P. L. Wang, G. X. Wang and J. H. Jia, Polymer, 2018, 146, 179–187 CrossRef CAS.
- X. D. Xu, J. F. Dai, L. N. Liu, P. A. Song and H. Wang, Composites, Part B, 2020, 190, 107930 CrossRef CAS.
- H. B. Zhao, B. W. Liu, X. L. Wang, L. Chen, X. L. Wang and Y. Z. Wang, Polymer, 2014, 55, 2394–2403 CrossRef CAS.
- D. M. Fox, M. Novy, K. Brown, M. Zammarano, R. H. Harris, M. Murariu, E. D. McCarthy, J. E. Seppala and J. W. Gilman, Polym. Degrad. Stab., 2014, 106, 54–62 CrossRef CAS.
- K. Decsov, V. Takács, G. Marosi and K. Bocz, Polym. Degrad. Stab., 2021, 191, 109655–109668 CrossRef CAS.
- W. Yang, W. J. Yang, B. Tawiah, Y. Zhang, L. L. Wang, S. E. Zhu and J. Y. Si, Compos. Sci. Technol., 2018, 164, 44–50 CrossRef CAS.
- S. Zhang, Y. X. Yan, W. J. Wang, X. Y. Gu and J. Sun, Polym. Degrad. Stab., 2018, 147, 142–150 CrossRef CAS.
- W. D. Yin, L. Chen, F. Z. Lu, P. G. Song, J. F. Dai and L. H. Meng, ACS Omega, 2018, 3, 5615–5626 CrossRef CAS PubMed.
- X. Hu, J. H. Sun, X. Li, L. J. Qian and J. Li, J. Appl. Polym. Sci., 2021, 138, 49829–49830 CrossRef CAS.
- H. Zhu, Q. Zhu, J. Li, K. Tao, L. Xue and Q. Yan, Polym. Degrad. Stab., 2011, 96(2), 183–189 CrossRef CAS.
- W. Yang, B. Tawiah, C. Yu, Y. F. Qian, L. L. Wang, A. C. Y. Yuen, S. E. Zhu, E. Z. Hu, T. B. Y. Chen, B. Yu, H. D. Lu, G. H. Yeoh, X. Wang, L. Song and Y. Hu, Composites, Part A, 2018, 110, 227–236 CrossRef CAS.
- B. Tawiah, B. Yu, A. C. Y. Yuen, R. K. K. Yuen, J. H. Xin and B. Fei, Polym. Degrad. Stab., 2019, 163, 76–86 CrossRef CAS.
- S. P. Qian, H. H. Zhang, W. C. Yao and K. C. Sheng, Composites, Part B, 2018, 133, 203–209 CrossRef CAS.
- S. H. El-Taweel and M. Abboudi, J. Appl. Polym. Sci., 2020, 137, 48340–48350 CrossRef CAS.
- P. J. Pan, Z. C. Liang, A. Cao and Y. Inoue, ACS Appl. Mater. Interfaces, 2009, 1(2), 402–411 CrossRef CAS.
- X. M. Zhao, F. R. Guerrero, J. Llorca and D. Y. Wang, ACS Sustainable Chem. Eng., 2016, 4, 202–209 CrossRef CAS.
- R. K. Jian, L. Xia, Y. F. Ai and D. Y. Wang, Polymers, 2018, 10, 871–883 CrossRef.
- H. Vahabi, B. K. Kandola and M. R. Saeb, Polymers, 2019, 11(3), 407–417 CrossRef PubMed.
- F. Wu, C. L. Huang, J. B. Zeng, S. L. Li and Y. Z. Wang, RSC Adv., 2014, 4, 54175–54186 RSC.
- M. Avrami, J. Chem. Phys., 1939, 7, 1103–1112 CrossRef CAS.
- F. Wu, C. L. Huang, J. B. Zeng, S. L. Li and Y. Z. Wang, Polymer, 2014, 55, 4358–4368 CrossRef CAS.
- T. Y. Cho and G. Strobl, Polymer, 2006, 47, 1036–1043 CrossRef CAS.
- A. Bouamer, N. Benrekaa, A. Younes and H. Amar, IOP Conf. Ser.: Mater. Sci. Eng., 2019, 461, 012006–012012 Search PubMed.
- G. R. Strobl and M. Schneider, J. Polym. Sci., Polym. Phys. Ed., 1980, 18, 1343–1359 CrossRef CAS.
- G. R. Strobl, Prog. Polym. Sci., 2006, 31, 398–442 CrossRef CAS.
- B. Lee, T. J. Shin, S. W. Lee, J. Yoon, J. Kim, H. S. Youn and M. Ree, Polymer, 2003, 44, 2509–2518 CrossRef CAS.
- Y. W. Jia, X. Zhao, T. Fu, D. F. Li, Y. Guo, X. L. Wang and Y. Z. Wang, Composites, Part B, 2020, 197, 108192–108203 CrossRef CAS.
- H. T. Zou, C. H. Yi, L. X. Wang, H. T. Liu and W. L. Xu, J. Therm. Anal. Calorim., 2009, 97, 929–935 CrossRef CAS.
- C. Sun, C. X. Li, H. Y. Tan and Y. H. Zhang, Energy Convers. Manage., 2019, 202, 112212–112224 CrossRef.
- A. Undri, L. Rosi, M. Frediani and P. Frediani, J. Anal. Appl. Pyrolysis, 2014, 110, 55–65 CrossRef CAS.
- G. Sivalingam and G. Madras, Polym. Degrad. Stab., 2004, 84, 393–398 CrossRef CAS.
- X. X. Shi, X. F. Peng, J. Y. Zhu, G. Y. Lin and T. R. Kuang, J. Colloid Interface Sci., 2018, 524, 267–278 CrossRef CAS PubMed.
Footnote |
| † Electronic supplementary information (ESI) available. See DOI: 10.1039/d1ra02862f |
| This journal is © The Royal Society of Chemistry 2021 |


