 Open Access Article
A comparative study of the effects of different TiO2 supports toward CO2 electrochemical reduction on CuO/TiO2 electrode
Yueheng Lu ,
Huazhen Cao
 *,
Shenghang Xu,
Chenxi Jia
 and
Guoqu Zheng
 *
*
College of Materials Science and Engineering, Zhejiang University of Technology, Hangzhou 310014, China. E-mail: caohz@zjut.edu.cn; zhenggq@zjut.edu.cn
First published on 21st June 2021
Abstract
CuO-based electrodes possess vast potential in the field of CO2 electrochemical reduction. Meantime, TiO2 supports show the advantages of being non-toxic, low-cost and having high chemical stability, which render it an ideal electrocatalytic support with CuO. However, different morphologies and structures of TiO2 supports can be obtained through various methods, leading to the discrepant electrocatalytic properties of CuO/TiO2. In this paper, three supports, named dense TiO2, TiO2 nanotube and TiO2 nanofiber, were applied to synthesize CuO/TiO2 electrodes by thermal decomposition, and the performances of the electrocatalysts were studied. Results show that the main product of the three electrocatalysts was ethanol, but the electrochemical efficiency and reaction characteristics are obviously different. The liquid product of CuO/Dense TiO2 is pure ethanol, however, the current efficiency is rather low owing to the higher resistance of the TiO2 film. CuO/TiO2 nanotube shows high conductivity and ethanol can be synthesized at low overpotential with high current efficiency, but the gas products cannot be restricted. CuO/TiO2 nanofiber has a larger specific surface area and more active sites, which is beneficial for CO2 reduction, and the hydrogen evolution reaction can be evidently restricted. The yield of ethanol reaches up to 6.4 μmol cm−2 at −1.1 V (vs. SCE) after 5 h.
1. Introduction
CO2 can be converted to chemicals with high energy density through reduction reaction, such as methanol and ethanol, and the reaction can be achieved at room temperature and atmospheric pressure. The electrocatalytic reduction reaction is expected to become a feasible way to sustainably transform the waste CO2 stream into value-added low-carbon fuels, which is of great significance for energy conversion and CO2 emission reduction.1,2 However, significant competition between CO2 reduction and hydrogen evolution in aqueous solution occurs, leading to the low efficiency and product selectivity.3,4 Therefore, the application of CO2 reduction is rather limited.In recent decades, numerous trials have been made to explore electrodes with distinguished performance for CO2 electrochemical reduction, including metals,5–8 metal oxides9–11 and metal complexes.12–15 Herein, CuO, as a relatively low-cost and earth abundant metal oxide, possesses a unique capacity to produce hydrocarbons through a multiple protons and electrons transfer pathway, which renders it an electrocatalytic reduction electrode material with large-scale application potential.16–18 However, CuO electrodes have a high overpotential and poor selectivity to the products, and are usually applied with a support.19 As an n-type semiconductor material, TiO2 is one of the widely used photocatalyst and electrocatalyst supports due to its advantages of non-toxicity, low cost and high chemical stability.20–22 Importantly, during the CO2 reduction reaction, a TiO2 support can help to adsorb CO2 and thereby facilitate the electrocatalytic reduction.23 Many researchers have been focused on the preparation of CuO/TiO2 electrodes applied in the field of photocatalytic reduction of CO2 and hydrogen production.24–27 The morphology and structure of TiO2 supports are various through different preparation methods, which in turn obviously influences the electrocatalytic performance. The combination of n-type TiO2 with the p-type CuO semiconductor28 can form a heterojunction, which has unidirectional conductivity, and it can facilitate the intramolecular electron transfer.29,30 However, the research about the morphology and structure of the TiO2 support on the electrocatalytic properties of CuO/TiO2 electrodes is rather scarce.
In this paper, three TiO2 supports with different morphologies were fabricated, and CuO particles were deposited on the surface of TiO2 support by thermal decomposition method. Through linear sweep voltammetry (LSV) and cyclic voltammetry (CV) method, the product selectivity, stability and catalytic efficiency of these CuO/TiO2 electrodes were studied in detail, and the mechanism of TiO2 support morphology on catalytic behavior was revealed.
2. Experimental
2.1 Reagents
Pure Ti sheet (99.99%) was purchased from Baoji LiTai Co., Ltd. Hydrofluoric acid (HF, 40%), absolute ethanol (CH3CH2OH, 99.7%), methanol (CH3OH, 99.5%), sodium hydroxide (NaOH, 96%), hydrochloric acid (HCl, 37%) and anhydrous sodium sulfate (Na2SO4, 99%) were purchased from Sinopharm Reagent Co., Ltd. Chromium trioxide (CrO3, 99%), formic acid (HCOOH, 99%), copper nitrate (Cu(NO3)2·3H2O, 99%) and sodium bicarbonate (NaHCO3, 98%) were purchased from Macklin Co., Ltd. 1-Butyl-3-methylimidazolium hexafluorophosphate (C8H15N2PF6, 99%) was purchased from Lanzhou Greenchem ILs.2.2 Preparation of TiO2 supports with different morphology
The pure titanium substrates were grinded and polished, and then cleaned with deionized water and ethanol sequentially. The chemical polish process was conducted in an aqueous solution of chromium trioxide hydrofluoric acid (4% HF and 7.5% CrO3) at 50 °C for 20 min. Afterwards, the titanium substrates were sealed by PTFE raw tape and sealant, and only one side of substrate is exposed.Dense TiO2 was obtained by anodizing in an ionic liquid (1-butyl-3-methylimidazolium hexafluorophosphate). The negative electrode is platinum and the anodic oxidation reaction is applied at a voltage of 8 V and 10 °C for 20 min.
TiO2 nanotubes (TNTs) were obtained by anodic oxidation in 1 wt% hydrofluoric acid aqueous solution. The negative electrode is graphite and the anodic oxidation reaction is applied at a voltage of 20 V and 25 °C for 20 min.
TiO2 nanofibers (TiO2NFs) were fabricated by putting Ti substrate in 10 M NaOH aqueous solution at 130 °C for 4 h through hydro-thermal method. Then, the Ti substrate was transferred to 0.1 M HCl aqueous solution for ion exchange for 12 h. Afterwards, the above electrodes were calcined in air at 450 °C for 2 h.
2.3 Preparation of TiO2-supported CuO electrodes
The copper nitrate aqueous solution of 1.66 M was spread on the surface of TiO2 carriers. Then, the samples were placed in a vacuum bottle and the excess solution on the surface was removed through centrifugation. Subsequently, all samples were calcined in air at 450 °C for 20 min. The above operations were repeated until the coating weight reaches 3 mg cm−2.2.4 Characterization and electrochemical reduction tests
The composition and crystal structure of those electrodes were conducted by an X-ray diffraction (XRD, Panalytical X'Pert PRO) at 40 kV and 40 mA with a scan speed of 10° min−1. The morphology and microstructure of electrodes were characterized by a field emission scanning electron microscopy (SEM, Vega3) and a transmission electron microscopy (TEM, Nano Nova 450) equipped with an energy dispersive X-ray (EDX) spectrometer.The electrochemical experiments were investigated by a CHI660C electrochemical workstation at 25 °C water bath. A platinum foil (2 × 2 cm2) and a saturated calomel electrode (SCE) were used as counter electrode and reference electrode, respectively. Linear sweep voltammetry (LSV) was researched in 0.1 M Na2SO4 solution with a scanning rate of 50 mV s−1 in the potential range between 0 and −1.3 V (vs. SCE). The electrical double-layer capacitance (Cdl) was measured in 0.5 M Na2SO4 solution to characterize electrochemical surface area (ECSA). Prior to tests, CO2 or N2 was bubbled into aqueous solution for 20 minutes. And the electrodes were sealed with sealant to make the exposed area 1 × 1 cm2.
2.5 Products analysis
The reduction experiment was carried out in an 80 mL 0.1 M NaHCO3 solution for 5 h. The process is conducted at a constant temperature of 25 °C. Liquid phase products were quantitatively characterized by headspace gas chromatograph (GC-G5, Purkinje, China) equipped with DB-WAX column and flame ionization detector (FID).3. Results and discussion
3.1 Microstructure of CuO/TiO2 electrodes
Fig. 1 shows the SEM morphologies of three CuO/TiO2 electrodes. The surface of dense TiO2 (Fig. 1a) support is gully-like. After thermal decomposition process, CuO particles of about 100 nm are gathered on the surface of TiO2, as shown in Fig. 1b. Fig. 1c shows the regularly arranged TiO2 nanotube with an inner diameter of about 80 nm and a wall thickness of about 10 nm. The CuO particles are tightly packed inside and inbetween nanotubes, as shown in Fig. 1d. The particle sizes of CuO inside and inbetween nanotubes is about 40 and 100 nm, respectively. The TiO2 nanofiber support shows a typical network-like structure (Fig. 1e) and CuO particles are tightly attached on the surface of TiO2 nanofiber with the size of about 40 nm (Fig. 1f).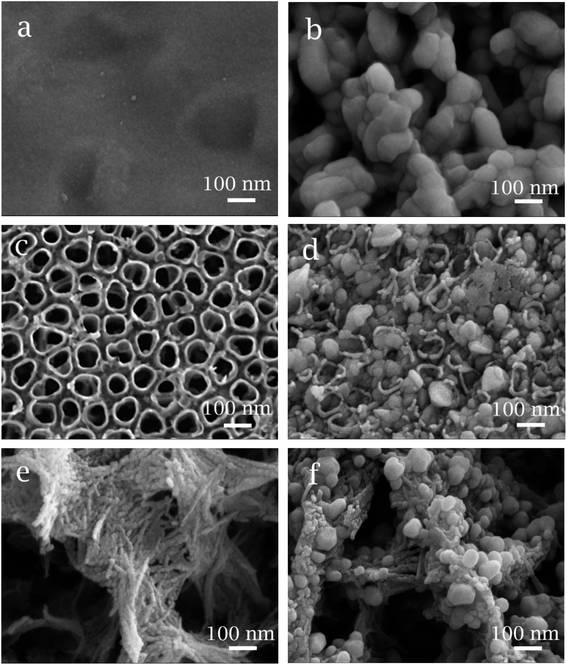 | ||
| Fig. 1 SEM images of (a) dense TiO2, (b) CuO/Dense TiO2, (c) TNTs, (d) CuO/TNTs, (e) TiO2NFs and (f) CuO/TiO2NFs. | ||
Fig. 2a shows the SEM image of cross-section of dense TiO2 support. It can be seen that the connection between TiO2 and matrix is well. However, obvious cracks can be seen inside the TiO2 support, which are attributed to the occurrence of interior stress during thermal decomposition process. The cross-section of CuO/TiO2 nanotube electrode demonstrates the well connection between nanotube and matrix, as shown in Fig. 2b. Besides, the length of nanotube is about 300 nm and CuO particles can be deposited inside the nanotube. The cross-section of TiO2 network-like structure is presented in Fig. 2c, and the thickness of TiO2 network is about 500 nm. In Fig. 2d, the HRTEM image shows the lattice fringes of TiO2 and CuO. The fringes with a spacing of 0.251 nm match the (−1 1 1) crystal plane of CuO, and the fringes with a spacing of 0.229 nm match the (1 1 2) crystal plane of anatase TiO2.
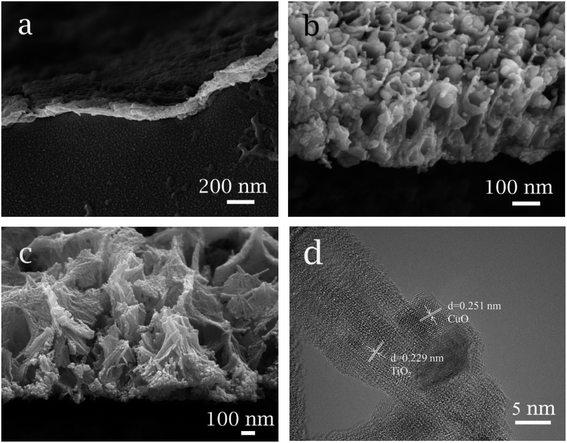 | ||
| Fig. 2 Cross-sectional SEM images of electrode: (a) dense TiO2, (b) CuO/TNTs, (c) TiO2NFs, (d) HRTEM image of CuO/TiO2NFs. | ||
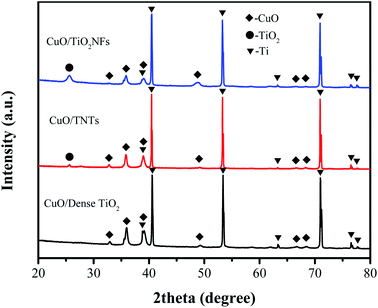
Phase composition of different CuO/TiO2 electrodes were analyzed by XRD, as shown in Fig. 3. Due to the thin film of CuO/TiO2, the peaks of Ti matrix can be obviously observed (JCPDS card 01-1198) at 2θ = 40.17, 53.00 and 70.66°. The peaks of anatase TiO2 (JCPDS card 75-1537) can be detected at 2θ = 25.7° in CuO/TNTs and CuO/TiO2NFs, corresponding to (1 0 1) crystal plane. However, the peaks of anatase TiO2 cannot be detected in CuO/Dense TiO2 electrode, which is attributed to the limited thickness of TiO2 layer. The peaks of CuO (JCPDS card 65-2309) can be seen in all electrodes at 32.6, 35.6, 38.8, 48.9, 66.6 and 68.1°, corresponding to (1 1 0) (−1 1 1), (1 1 1) (−2 0 2), (−3 1 1) and (1 1 3) planes, respectively.
3.2 Electrocatalytic properties
Fig. 4 reveals the LSV curves of CuO/Dense TiO2, CuO/TNTs and CuO/TiO2NFs in 0.1 M Na2SO4. The dotted line represents the current density under N2 saturated atmosphere while the solid line shows the current density under CO2 saturated atmosphere. The deviation between the solid line and the dashed line can be regarded as the reaction current of CO2 reduction (ICO2) approximately. The three electrodes all showed catalytic abilities for CO2 reduction, but the overpotentials on different electrodes are much different. Specifically, the ICO2 on CuO/TNTs is nearly 0.2 mA cm−2 at −0.5 V (vs. SCE). While for the case of CuO/Dense TiO2 and CuO/TiO2NFs electrodes, the CO2 reduction begins at −0.6 V and −0.7 V, respectively. The different overpotentials on different electrodes are mainly related with the distinctive film resistances. For example, the dense TiO2 layer is only about 100 nm, while the TiO2NFs layer is nearly 1 μm. As a result, the current of CuO/Dense TiO2 is larger than that of CuO/TiO2NFs. It is also observed that the hydrogen evolution reaction is evidently inhibited on CuO/TiO2NFs or CuO/TNTs.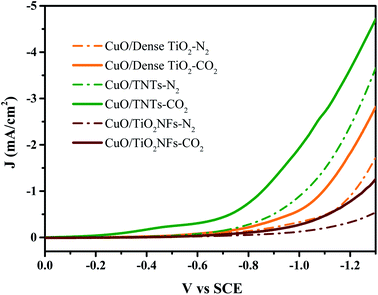 | ||
| Fig. 4 LSV results of CuO/Dense TiO2, CuO/TNTs and CuO/TiO2NFs in 0.1 M Na2SO4 saturated with N2 or CO2. | ||
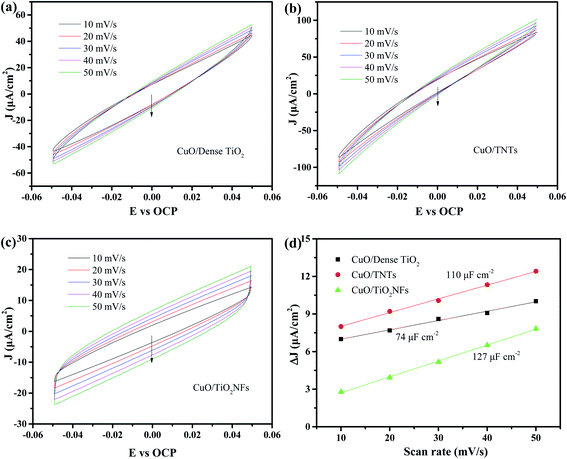
The electrical double layer capacitance is the most commonly used method to determine the electrochemically surface area (ECSA).31–33 Fig. 5a–c shows the CV curves of the three electrodes near open circuit potential by different sweep speeds. It can be considered that only non-Faraday charge and discharge occur in this range. The average value of anode and cathode current under the open circuit potential is selected as the electric double layer capacitance current iC. It can be demonstrated that the double layer capacitance of CuO/Dense TiO2, CuO/TNTs and CuO/TiO2NFs electrode is 74, 110 and 127 μF cm−2 (Fig. 5d), respectively, which shows that the CuO/TiO2NFs electrode possesses the highest ESCA and largest number of active sites.34,35
3.3 Electrochemical reduction of CO2
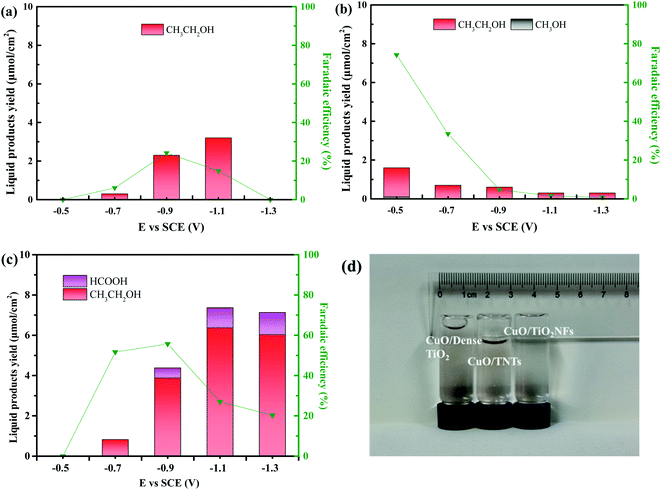
Fig. 6a–c shows the liquid product yield and Faraday efficiency of CuO/Dense TiO2, CuO/TNTs and CuO/TiO2NFs after electrochemical reduction of CO2 for 5 h. Faraday efficiency (EF) can be calculated by the following formula:
 | (1) |
Fig. 7 is the gas chromatography analysis of liquid product obtained by three electrodes through electrochemical reduction of CO2 at different potential (vs. SCE). The retention times of methanol and ethanol are at 3.03 min and 3.25 min, respectively. Besides, the retention time of formic appears at 2.52 min while that of air is at 2.12 min. It can be demonstrated that only gas and ethanol can be generated by using CuO/Dense TiO2 electrode. A very small amount of methanol is generated by CuO/TNTs electrode while a little formic can be detected by CuO/TiO2NFs electrode. By contrast, the yield of ethanol is pretty higher by CuO/TiO2NFs electrode than those by CuO/Dense TiO2 and CuO/TNTs electrodes.
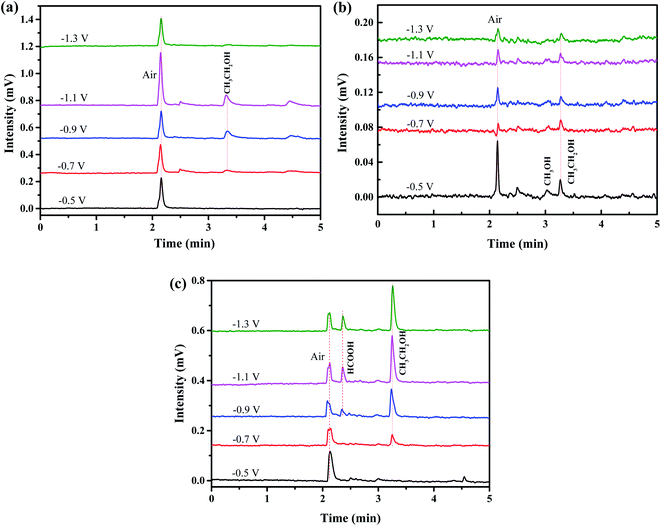 | ||
| Fig. 7 Liquid products produced by different electrodes: (a) CuO/Dense TiO2, (b) CuO/TNTs and (c) CuO/TiO2NFs. | ||
Fig. 6 and 7 indicate that the liquid products by CuO/Dense TiO2, CuO/TNTs and CuO/TiO2NFs have high selectivity, and the main product is ethanol. With increasing the bias voltage, the yield of liquid products by CuO/Dense TiO2 electrode gradually improves. The maximum ethanol production of 3.2 μmol cm−2 can be obtained when the bias voltage is around −1.1 V. As for the CuO/TNTs electrode, the Faraday efficiency reaches up to 74.2% at −0.5 V, and the yield of ethanol is 1.6 μmol cm−2 with small amount of methanol. With increasing the bias voltage, the yield of liquid products and Faraday efficiency decrease evidently. As regards the CuO/TiO2NFs electrode, the improvement of bias voltage leads to the increased formation of liquid products. The yield of ethanol and formic acid reaches up to 6.4 μmol cm−2 and 1.0 μmol cm−2 at −1.1 V, respectively.
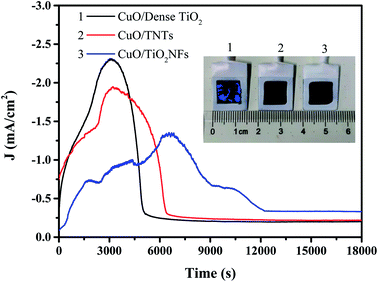
Fig. 8 shows the time–current curves of three electrodes for electrochemical reduction of CO2 at −0.9 V, reaches a maximum value and then decreases to a stable value. Many literatures has proved that during CO2 electroreduction process, less of the charge could be attributed to the reduction of CuO to Cu2O and potentially Cu.36 Our previous studies also confirmed the existence of Cu after CuO/TNTs catalyst was applied in CO2 reduction.37 So a modest increase in current was observed during the initial stage of CO2 reduction process. However, the Cu film exhibited a lower activity compared with the oxide film, and the gas bubbled at the interface of electrode blocks the available catalytic sites, which both caused the current decay with prolonging time. As a result, reduction peaks were observed in the chronoamperometry curves of CuO catalysts during the initial stage of CO2 reduction. This result was consistent with the studies by Yeo et al.38 Besides, it is noted that the maximum current of CuO/Dense TiO2, CuO/TNTs occurs at 3000 s while that of CuO/TiO2NFs is 7000 s. The stable current density of CuO/Dense TiO2 and CuO/TNTs is 0.22 and 0.20 mA cm−2, respectively, and CuO/TiO2NFs shows a higher stable current density of 0.33 mA cm−2. The longer peak time and the higher stable current both indicate that CuO/TiO2NFs may have a higher efficiency for the generation of CO2 reduction products. After CO2 electrochemical reduction for 18![[thin space (1/6-em)]](https://www.rsc.org/images/entities/char_2009.gif) 000 s, the surface of CuO/Dense TiO2 electrode cracks and strips while those of CuO/TiO2TNTs and CuO/TiO2NFs are relatively stable.
000 s, the surface of CuO/Dense TiO2 electrode cracks and strips while those of CuO/TiO2TNTs and CuO/TiO2NFs are relatively stable.
It is well-accepted that the electrochemical reduction efficiency is tightly related to the surface roughness of CuO/TiO2 heterojunction, the stability of TiO2 supports, ESCA and the activity of hydrogen evolution reaction. The current density of dense TiO2 support is high, however, the electric resistance of TiO2 layer is rather tremendous, leading to the low current efficiency. Besides, owing to the relatively low specific surface area, the contact area between CO2 and electrode is limited, leading to the inhibition of electrochemical reduction of CO2 and the promotion of hydrogen evolution reaction. Meanwhile, as mentioned above, some cracks generate during the fabricating process, and the bubbles produced by hydrogen evolution reaction will accelerate the generation and peeling of cracks, which leads to the instability of CuO/Dense TiO2. In the CuO/TNTs electrode, the TiO2 nanotubes combine well with Ti matrix and CuO particles. The nanotubes have excellent electrical conductivity, so the current density is extremely high during electrochemical reduction process. Besides, the CuO/TNTs electrode is more favorable for reduction reaction of CO2, and the synthesized ethanol shows excellent purity and high current efficiency. However, with the increase of bias voltage, the hydrogen evolution reaction gradually dominates and inhibits the formation of ethanol. Besides, the formed gas on the electrode hinders the contact between electrode and CO2, which can also suppress the reduction reaction of CO2. Therefore, the yield of gaseous products by CuO/TNTs electrode is highest among three electrodes, and the synthesized ethanol decreases with the increase of bias voltage. CuO/TiO2NFs electrode has the highest ethanol yield and best stability, which is caused by the distinctive surface structure. CuO/TiO2NFs has a larger specific surface area. Studies have shown that rough or high-surface-area surfaces exhibit improved hydrocarbon selectivity.39 This is typically attributed to the increased population of undercoordinated sites. In addition, high specific surface area catalysts also tend to suppress hydrogen evolution due to the poorer mass transport in porous systems. Many papers have been published regarding CO2 reduction on copper-derived oxides,40–42 but the key factors responsible for the improved selectivity and activity are still debated. However, it's reported that increased stabilization of the CO2 anionic adsorbate (CO2˙−) by grain boundaries as well as the presence of (sub)surface oxygen play a role.43,44 And CuO/TiO2NFs shows more grain boundaries compared with the other two electrodes. It is generally believed that during the CO2 reduction process, the copper oxide on the surface of these electrodes should be completely converted to metallic Cu. However, a residual oxide layer was shown to remain present on the surface during the catalysis process, and it was proposed that the surface oxide layer still serves as key reaction sites for catalysis.45
4. Conclusions
Three TiO2 supports with different morphologies are successfully fabricated through anodic oxidation and hydrothermally methods, and the CuO particles are deposited by thermal decomposition. The CuO/Dense TiO2, CuO/TNTs and CuO/TiO2NFs show relatively good selectivity and the main product is ethanol. The liquid product of the CuO/Dense TiO2 electrode is pure ethanol, but the current efficiency is poor. Ethanol can be synthesized by CuO/TNTs at low overpotential with high current efficiency, but the yield of gaseous products is redundant. CuO/TiO2NFs shows rougher surface of CuO/TiO2 heterojunction, representing best property of CO2 reduction reaction. When the bias voltage is at −1.1 V, the yield of ethanol of CuO/TNTs electrode reaches 6.4 μmol cm2 after 5 h.Conflicts of interest
There are no conflicts to declare.Acknowledgements
This work was supported by the Natural Science Foundation of Zhejiang Province (No. LY17B030009 and No. LQ16E020002).References
- H. Ge, Z. Gu, P. Han, H. Shen, A. M. Al-Enizi, L. Zhang and G. Zheng, J. Colloid Interface Sci., 2018, 531, 564–569 CrossRef CAS PubMed.
- R. J. Lim, M. Xie, M. A. Sk, J.-M. Lee, A. Fisher, X. Wang and K. H. Lim, Catal. Today, 2014, 233, 169–180 CrossRef CAS.
- H. Zhong, K. Fujii and Y. Nakano, J. Electrochem. Soc., 2017, 164, F923–F927 CrossRef CAS.
- M. Zhao, H. Tang, Q. Yang, Y. Gu, H. Zhu, S. Yan and Z. Zou, ACS Appl. Mater. Interfaces, 2020, 12, 4565–4571 CrossRef CAS PubMed.
- J. He, N. J. J. Johnson, A. Huang and C. P. Berlinguette, ChemSusChem, 2018, 11, 48–57 CrossRef CAS PubMed.
- A. H. M. da Silva, S. J. Raaijman, C. S. Santana, J. M. Assaf, J. F. Gomes and M. T. M. Koper, J. Electroanal. Chem., 2021, 880, 114750 CrossRef CAS.
- M. Azuma, J. Electrochem. Soc., 1990, 137, 7–26 CrossRef.
- X. Yang, J. Cheng, B. Fang, X. Xuan, N. Liu, X. Yang and J. Zhou, Nanoscale, 2020, 12, 18437–18445 RSC.
- S.-Y. Zhang, H.-L. Zhu and Y.-Q. Zheng, Electrochim. Acta, 2019, 299, 281–288 CrossRef CAS.
- N. Ullah, I. Ali, M. Jansen and S. Omanovic, Can. J. Chem. Eng., 2015, 93, 55–62 CrossRef CAS.
- A. H. M. da Silva, S. J. Raaijman, C. S. Santana, J. M. Assaf, J. F. Gomes and M. T. M. Koper, J. Electroanal. Chem., 2021, 880, 114750 Search PubMed.
- Q. Wang, Y. Zhang, H. Lin and J. Zhu, Chem.–Eur. J., 2019, 25, 14026–14035 CrossRef CAS PubMed.
- J. Albo, D. Vallejo, G. Beobide, O. Castillo, P. Castaño and A. Irabien, ChemSusChem, 2017, 9, 1–11 Search PubMed.
- G. Liao, J. Fang, Q. Li, S. Li, Z. Xu and B. Fang, Nanoscale, 2019, 11, 7062–7096 RSC.
- J.-H. Liu, L.-M. Yang and E. Ganz, RSC Adv., 2019, 9, 27710–27719 RSC.
- J. Xie, Y. Huang and H. Yu, Front. Environ. Sci. Eng., 2014, 9, 861–866 CrossRef.
- Y. Lum and J. W. Ager, Nat. Catal., 2018, 2, 86–93 CrossRef.
- L. Mandal, K. R. Yang, M. R. Motapothula, D. Ren, P. Lobaccaro, A. Patra, M. Sherburne, V. S. Batista, B. S. Yeo, J. W. Ager, J. Martin and T. Venkatesan, ACS Appl. Mater. Interfaces, 2018, 10, 8574–8584 CrossRef CAS PubMed.
- T. Moller, F. Scholten, T. N. Thanh, I. Sinev, J. Timoshenko, X. Wang, Z. Jovanov, M. Gliech, B. Roldan Cuenya, A. S. Varela and P. Strasser, Angew. Chem., Int. Ed., 2020, 59, 17974–17983 CrossRef PubMed.
- K. Kočí, K. Matějů, L. Obalová, S. Krejčíková, Z. Lacný, D. Plachá, L. Čapek, A. Hospodková and O. Šolcová, Appl. Catal., B, 2010, 96, 239–244 CrossRef.
- O. Ola and M. M. Maroto-Valer, J. Photochem. Photobiol., C, 2015, 24, 16–42 CrossRef CAS.
- M. Niu, D. Cheng and D. Cao, J. Phys. Chem. C, 2013, 117, 15911–15917 CrossRef CAS.
- G. K. Ramesha, J. F. Brennecke and P. V. Kamat, ACS Catal., 2014, 4, 3249–3254 CrossRef CAS.
- J. Yuan, J.-J. Zhang, M.-P. Yang, W.-J. Meng, H. Wang and J.-X. Lu, Catalysts, 2018, 8, 171 CrossRef CAS.
- S. Qin, F. Xin, Y. Liu, X. Yin and W. Ma, J. Colloid Interface Sci., 2011, 356, 257–261 CrossRef CAS PubMed.
- P. Khemthong, P. Photai and N. Grisdanurak, Int. J. Hydrogen Energy, 2013, 38, 15992–16001 CrossRef CAS.
- T. N. Ravishankar, M. d. O. Vaz and S. R. Teixeira, New J. Chem., 2020, 44, 1888–1904 RSC.
- S. M. Park, A. Razzaq, Y. H. Park, S. Sorcar, Y. Park, C. A. Grimes and S. I. In, ACS Omega, 2016, 1, 868–875 CrossRef CAS.
- Q. Wu, M. J. Mao, Q. J. Wu, J. Liang, Y. B. Huang and R. Cao, Small, 2020, e2004933 Search PubMed.
- D.-D. Ma, S.-G. Han, C. Cao, W. Wei, X. Li, B. Chen, X.-T. Wu and Q.-L. Zhu, Energy Environ. Sci., 2021, 14, 1544–1552 RSC.
- D. Voiry, M. Chhowalla, Y. Gogotsi, N. A. Kotov, Y. Li, R. M. Penner, R. E. Schaak and P. S. Weiss, ACS Nano, 2018, 12, 9635–9638 CrossRef CAS PubMed.
- X. Lu, R. Liu, Q. Wang and C. Xu, ACS Appl. Mater. Interfaces, 2019, 11, 40014–40021 CrossRef CAS.
- L. Xu, Q. Jiang, Z. Xiao, X. Li, J. Huo, S. Wang and L. Dai, Angew. Chem., Int. Ed., 2016, 55, 5277–5281 CrossRef CAS PubMed.
- W. Hao, R. Wu, R. Zhang, Y. Ha, Z. Chen, L. Wang, Y. Yang, X. Ma, D. Sun, F. Fang and Y. Guo, Adv. Energy Mater., 2018, 8, 1801372 CrossRef.
- H. Wu, K. Yin, W. Qi, X. Zhou, J. He, J. Li, Y. Liu, J. He, S. Gong and Y. Li, ChemSusChem, 2019, 12, 2773–2779 CrossRef CAS PubMed.
- L. Zhang, H. Cao, Y. Lu, H. Zhang, G. Hou, Y. Tang and G. Zheng, J. Solid State Electrochem., 2019, 24, 447–459 CrossRef.
- L. Wang, K. Gupta, J. Goodall, J. A. Darr and K. B. Holt, Faraday Discuss., 2016, 197, 517–532 RSC.
- D. Ren, Y. Deng, A. D. Handoko, C. S. Chen, S. Malkhandi and B. S. Yeo, ACS Catal., 2015, 5, 2814–2821 CrossRef CAS.
- W. Tang, A. A. Peterson, A. S. Varela, Z. P. Jovanov, L. Bech, W. J. Durand, S. Dahl, J. K. Norskov and I. Chorkendorff, Phys. Chem. Chem. Phys., 2012, 14, 76–81 RSC.
- C. W. Li, J. Ciston and M. W. Kanan, Nature, 2014, 508, 504–507 CrossRef CAS PubMed.
- A. Dutta, M. Rahaman, N. C. Luedi, M. Mohos and P. Broekmann, ACS Catal., 2016, 6, 3804–3814 CrossRef CAS.
- R. Kas, R. Kortlever, A. Milbrat, M. T. Koper, G. Mul and J. Baltrusaitis, Phys. Chem. Chem. Phys., 2014, 16, 12194–12201 RSC.
- X. Feng, K. Jiang, S. Fan and M. W. Kanan, ACS Cent. Sci., 2016, 2, 169–174 CrossRef CAS.
- A. Eilert, F. Cavalca, F. S. Roberts, J. Osterwalder, C. Liu, M. Favaro, E. J. Crumlin, H. Ogasawara, D. Friebel, L. G. Pettersson and A. Nilsson, J. Phys. Chem. Lett., 2017, 8, 285–290 CrossRef CAS PubMed.
- D. Kim, S. Lee, J. D. Ocon, B. Jeong, J. K. Lee and J. Lee, Phys. Chem. Chem. Phys., 2015, 17, 824–830 RSC.
| This journal is © The Royal Society of Chemistry 2021 |

