 Open Access Article
Single-stranded DNA probe paired aptasensor with extra dye binding sites to enhance its fluorescence response in the presence of a target compound†
Seo Won Choab,
Hyun Jeong Lima,
Beelee Chua *c and
Ahjeong Son
 *a
*a
aDepartment of Environmental Science and Engineering, Ewha Womans University, 52 Ewhayeodae-gil, Seodaemun-gu, Seoul 03760, Republic of Korea. E-mail: ason@ewha.ac.kr; ahjeong.son@gmail.com; Tel: +82-2-3277-3339
bDepartment of Civil and Environmental Engineering, University of Wisconsin-Madison, Madison, WI 53706, USA
cSchool of Electrical Engineering, Korea University, 145 Anam-ro, Seongbuk-gu, Seoul 02841, Republic of Korea. E-mail: bchua@korea.ac.kr; chuabeelee@gmail.com; Tel: +82-2-3290-4639
First published on 21st June 2021
Abstract
The purpose of this study is to investigate the possibility of improving the performance of a DNA binding dye water quenching based aptasensor without changing or truncating the aptamer. To demonstrate the possibility of increasing the change in fluorescence of the aptasensor by pairing it with a suitable ssDNA probe, three ssDNA probes (probe 1, 2, and 3) were employed and the fluorescence from the bound dyes was measured. This showed that ssDNA probe 2 created the most additional binding sites. By varying the target compound concentration (0, 0.05, 0.5, 5, 50, and 500 mg L−1 4-n-nonylphenol), the corresponding change in the fluorescence signal of the unpaired and ssDNA probe paired aptasensors were measured and compared over a range of emission wavelengths. The response of all three ssDNA probe paired aptasensors showed good fit (R2 = 0.88–0.92) to a logarithmic response. The sensitivity of the aptasensor paired with ssDNA probe 2 was improved by ∼60%, whereas that of the aptasensor paired with ssDNA probe 3 was only improved by a marginal ∼3%. This study is a demonstration of using an appropriate ssDNA probe to increase the number of binding sites and hence the performance of a DNA binding dye and water quenched aptasensor. It is a possibility that can be extended to similar aptasensors without having to change or truncate the aptamer.
1. Introduction
The advent of aptamers has ushered in multitudes of sensing platforms for a wide range of organic and inorganic targets such as small molecules such as endocrine disrupting compounds,1–3 proteins and cells,4–7 and metal ions.8,9 Since its debut in 1990,10,11 aptamers have since consorted with a myriad of nanomaterials such as gold nanoparticles,12–14 semiconductor quantum dots,6,7,15,16 graphene oxide,17 or carbon nanotubes18 to constitute an entire new class of sensors, otherwise commonly referred as aptasensors. Depending on their respective transduction schemes, quantification is achieved via an assortment of methodologies19 such as Raman scattering,20 surface plasmon resonance,21 colorimetry,12,13 fluorescence,7,15,22 and electrochemistry.18,23,24 Given the versatility, high sensitivity and selectivity, their applications easily span medical diagnostics,7,25,26 food safety,27 and environmental monitoring.22,28,29Aptamers are oligonucleotides that are screened for their affinity to the target molecules via the systematic evolution of ligands by exponential enrichment (SELEX) process.10 They fold into secondary or tertiary three dimensional structures with pockets that bind target molecules via stacking interactions and hydrogen bonds. A commonly exploited feature upon binding with the target molecule is the resulting conformational change of the aptamer. This conformational change could be transduced via a variety of ways such as the interactions of attached nanomaterials or with electrochemical responsive surfaces. Fluorescence quantification schemes that transduce this conformational change often employed nanomaterial pairs such as fluorophore–quencher pair,30 fluorescence resonance energy transfer (FRET)7,22 and magnetic bead-quantum dots.15
Recently, Kim et al. (2020)31 demonstrated another fluorescence quantification scheme that employed DNA binding fluorescence dye and water quenching. The PoPo-3 dye was first bound to the aptamer via intercalation and other hydrophobic interactions. Upon the preferential binding with the target molecules (phthalic acid esters), the aptamer underwent conformational change. The PoPo-3 dye is displaced from the aptamer and quenched in water. This caused a proportional reduction in fluorescence signal which could be measured with a single photodiode (centered at 540 nm, with a 400–405 nm LED excitation source). The advantages of this scheme include minimal nanomaterial synthesis and cost, simplified fluidics, portable fluorescence measurement hardware, and ultra-fast quantification (in as fast as 30 s).
The purpose of this study is to investigate the possibility of improving the performance of the above mentioned DNA binding dye water quenching based aptasensor without changing or truncating the aptamer. The search for a new aptamer will inevitably require the invocation of the costly and time consuming SELEX process with no guarantee of better performance. Aptamer truncation also requires multiple iterations and optimization to avoid mistruncation. Therefore, we propose to improve the performance of the above mentioned aptasensor by increasing the number of conformational change responsive binding sites on the aptamer via the use of a suitable single-stranded DNA (ssDNA) probe.
As a demonstration of the proposed approach, we employed an aptasensor that consisted of an aptamer that is selective to nonylphenol (4-n-nonylphenol)2 and a common low cost DNA binding fluorescence dye (SYBR Green I). As shown in Fig. 1a, the SYBR Green I dyes are bound to the aptamer, possibly intercalated between the base pairs in the hairpin loops. Upon binding with the target compound nonylphenol, the conformational change freed the SYBR Green I dyes which are then quenched in water. In order to increase the number of binding sites, an appropriate ssDNA probe can be paired as shown in Fig. 1b. This would result in a larger change in the fluorescence signal as more SYBR Green I dyes are freed and quenched.
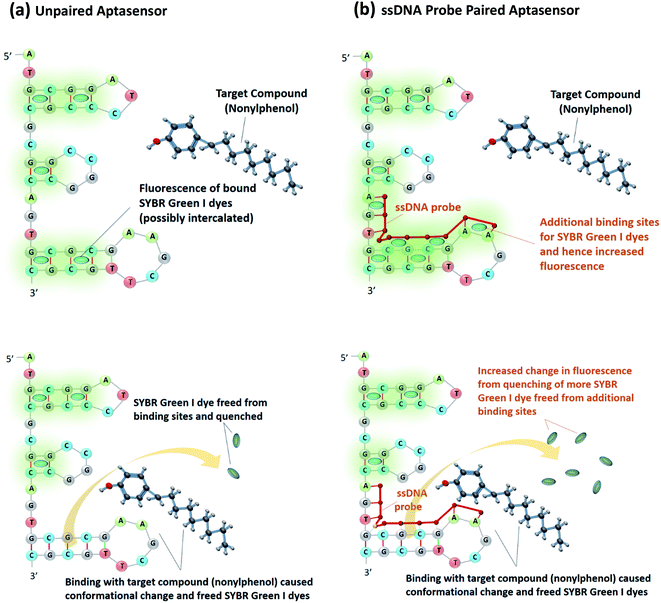 | ||
| Fig. 1 (a) Schematic of ssDNA unpaired aptasensor, (b) schematic of ssDNA paired aptasensor by providing extra dye binding sites to enhance its fluorescence response. | ||
The said aptamer was first screened and reported by Kim et al. 2020 (ref. 2) and the structure with lowest Gibbs free energy (ΔG = −8.90) is shown in Fig. 2a. It is selective to nonylphenol, partially selective to bisphenol A and do not respond to other endocrine disrupting compounds such as benzylpenicillin, phenylphenol, phenol and di-2-ethylhexylphthalate. Kim et al. 2020 (ref. 2) did not report the specific substructure that is responsible for the binding with nonylphenol. Therefore, we designed three ssDNA probes to pair with different substructures of the aptamer. As shown in Fig. 2b, the three ssDNA probes (namely ssDNA probe 1, ssDNA probe 2 and ssDNA probe 3) are designed either to pair with one of the hairpin loops or a segment.
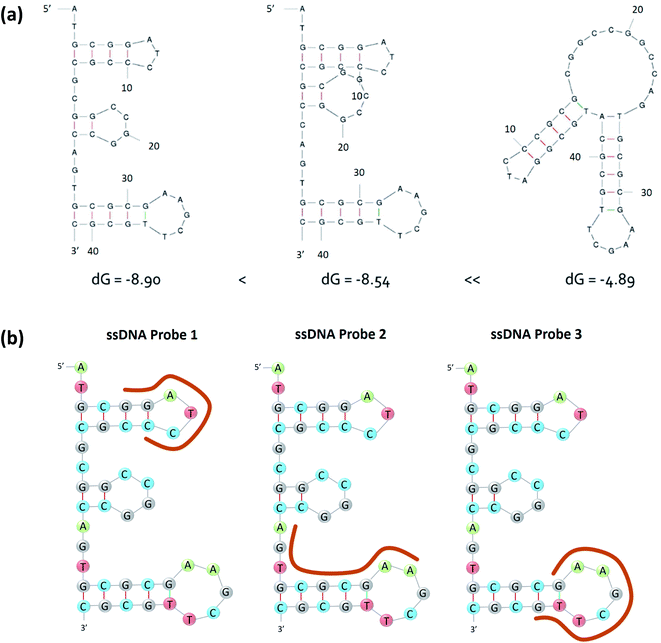 | ||
| Fig. 2 (a) The secondary structure of the nonylphenol specific aptamer, (b) designs of the ssDNA probes 1, 2, and 3 based on the secondary structure of the nonylphenol specific aptamer. | ||
In order to demonstrate the possibility of increasing the change in fluorescence of the aptasensor by pairing it with a suitable ssDNA probe, different quantities of three ssDNA probes (1, 5, and 10 μM) were employed and the fluorescence from the bound dyes were measured. This enabled the preliminary identification of the ssDNA probe that would create the most number of additional binding sites. By varying the target concentration (0, 0.05, 0.5, 5, 50, and 500 mg L−1 4-n-nonylphenol), the corresponding change in the fluorescence signal of the unpaired and ssDNA paired aptasensors were measured and compared over a range of emission wavelengths (∼520 to 600 nm). An emission wavelength specific comparison would yield the fluorescence response with respect to the target concentration. Finally, the performance of the unpaired and ssDNA paired aptasensors and improvement in sensitivity were compared.
2. Materials and methods
2.1. Aptamer and ssDNA probe design
As mentioned earlier, a ssDNA aptamer (NP7, 5′-NH2-ATG CGG ATC CCG CGC GGC CGG CCA GTG CGC GAA GCT TGC GC-3′)2 previously screened by Kim et al. 2020 (ref. 2) for the detection of nonylphenol (4-n-nonylphenol) was employed in this study. As shown in Fig. 1b and Table 1, the three complementary ssDNA probes used in this study were designed to bind with said aptamer. The ssDNA probes were labeled as ssDNA probe 1, 2, and 3, which have 6, 10, and 8 mer, respectively. All the aptamer and ssDNA probes were commercially synthesized and purified using polyacrylamide gel electrophoresis (PAGE) and modified with the amine group and C6 spacer at the 5′ end (Bioneer Corp., Daejeon, Korea). The secondary structure of the aptamer was predicted by a DNA folding program, Mfold32 and depicted in Fig. 1 and 2.| Name | Sequences of oligonucleotides (5′ → 3′) | Size | Ref. |
|---|---|---|---|
| Aptamer NP7 | 5′-NH2-ATG CGG ATC CCG CGC GGC CGG CCA GTG CGC GAA GCT TGC GC-3′ | 41 mer | Kim et al., 2020 (ref. 2) |
| ssDNA probe 1 | 5′-NH2-C6-(T)10-GGATCC-3′ | 6 mer | This study |
| ssDNA probe 2 | 5′-NH2-C6-(T)10-TTCGCGCACT-3′ | 10 mer | This study |
| ssDNA probe 3 | 5′-NH2-C6-(T)10-CAAGCTTC-3′ | 8 mer | This study |
2.2. Construction of ssDNA probe paired aptasensor
Seventy-five μL of 0.02 M Tris–HCl buffer containing 10× SYBR Green I dye (SYBR™ Green I Nucleic Acid Gel Stain, Invitrogen, Carlsbad, CA, USA) and 10 μL of 10 μM aptamer were mixed with 10 μL of three ssDNA probes (0, 1, 5, and 10 μM as final concentrations) and 5 μL of ultrapure distilled water in an opaque 96-well microplate (SPL, Gyeonggi, Korea). For the negative control, ultrapure distilled water (Ultrapure™ DNase/RNase Free Distilled Water, Invitrogen) was added instead of ssDNA probe. The mixture was subjected to the subsequent fluorescence measurement.2.3. Response of aptasensor paired with different ssDNA probes in presence of target compound
The target compound (4-n-nonylphenol) was purchased from Sigma-Aldrich (St. Louis, MO, USA). A range of target compound concentrations (0, 0.05, 0.5, 5, 50, and 500 mg L−1 as final concentrations) were subjected to measurement by the ssDNA probe paired aptasensor. First, 100 mg of nonylphenol was dissolved in 10 mL of 100% DMSO solvent to make the 10![[thin space (1/6-em)]](https://www.rsc.org/images/entities/char_2009.gif) 000 mg L−1 stock solution. The subsequent dilution was performed with 10% DMSO solution. Seventy-five μL of 0.02 M Tris–HCl buffer containing 10× SYBR Green I dye and 10 μL of 10 μM aptamer were mixed with 10 μL of ssDNA probes (0, 1, 5, and 10 μM as final concentrations) in an opaque 96-well microplate (SPL, Gyeonggi, Korea). Subsequently, 5 μL of nonylphenol solution dissolved in 10% DMSO solution (0, 0.05, 0.5, 5, 50, and 500 mg L−1 as final concentrations) was added to the microplate to give a total reaction volume of 100 μL. Samples were incubated in a Mixmate shaker (Eppendorf, Hamburg, Germany) at 400 rpm for 3 h at ambient temperature. For negative control, ultrapure distilled water was added instead of ssDNA probe.
000 mg L−1 stock solution. The subsequent dilution was performed with 10% DMSO solution. Seventy-five μL of 0.02 M Tris–HCl buffer containing 10× SYBR Green I dye and 10 μL of 10 μM aptamer were mixed with 10 μL of ssDNA probes (0, 1, 5, and 10 μM as final concentrations) in an opaque 96-well microplate (SPL, Gyeonggi, Korea). Subsequently, 5 μL of nonylphenol solution dissolved in 10% DMSO solution (0, 0.05, 0.5, 5, 50, and 500 mg L−1 as final concentrations) was added to the microplate to give a total reaction volume of 100 μL. Samples were incubated in a Mixmate shaker (Eppendorf, Hamburg, Germany) at 400 rpm for 3 h at ambient temperature. For negative control, ultrapure distilled water was added instead of ssDNA probe.
2.4. Fluorescence measurements
The fluorescence emission spectra and endpoint measurement of the ssDNA paired aptasensor were obtained by SpectraMax M2 spectrofluorometer (Molecular Devices, Spectra Max M2, Sunnyvale, CA, USA). The emission spectra was obtained from 520 nm to 600 nm at 497 nm excitation. The endpoint measurement was implemented at λem = 528 nm and λex = 497 nm.3. Results and discussion
3.1. Fluorescence of aptasensor paired with different ssDNA probes
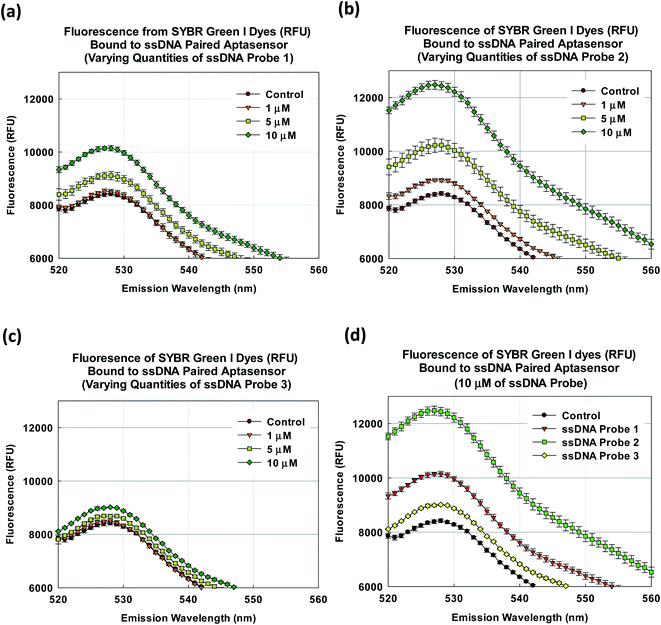
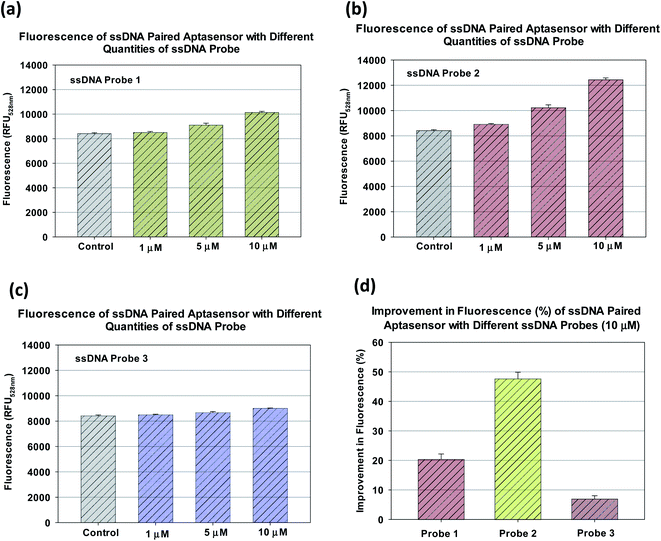
As shown in Fig. 3a–c, the pairing with all three ssDNA probes were able to increase the fluorescence from the SYBR Green I dye for emission wavelengths from 520 to 560 nm. This definitely suggests that an increase in the number of dye binding sites. Note that in this case, the spectra represent multiple measurements of fluorescence response at discrete emission wavelengths. Since multiple measurements were made for the same discrete emission wavelengths, therefore they were represented by discrete points and error bars. The aptasensor paired with ssDNA probe 2 had the most visible increase in fluorescence. In comparsion, the aptasensor paired with ssDNA probe 3 only had a marginal increase in fluorescence (Fig. 3d). Since the fluorescence peak occurred at the emission wavelength ∼528 nm, the performance of each ssDNA paired aptasensor could be compared quantitatively at the said wavelength. As shown in Fig. 4a, the pairing with ssDNA probe 1 at 1, 5 and 10 μM had yielded fluorescence of 8508 ± 85, 9111 ± 156 and 10![[thin space (1/6-em)]](https://www.rsc.org/images/entities/char_2009.gif) 143 ± 96 RFU, respectively. Similarly, pairing with ssDNA probe 2 at 1 at quantities of 1, 5 and 10 μM had yielded corresponding fluorescence at 8917 ± 59, 10
143 ± 96 RFU, respectively. Similarly, pairing with ssDNA probe 2 at 1 at quantities of 1, 5 and 10 μM had yielded corresponding fluorescence at 8917 ± 59, 10![[thin space (1/6-em)]](https://www.rsc.org/images/entities/char_2009.gif) 228 ± 225 and 12
228 ± 225 and 12![[thin space (1/6-em)]](https://www.rsc.org/images/entities/char_2009.gif) 436 ± 153 RFU, and that with ssDNA probe 3 yielded 8503 ± 43, 8673 ± 80 and 9014 ± 22 RFU (Fig. 4b and c). It appears the fluorescence did not increase noticeably with the respective quantities of ssDNA probes 1 and 3. However, the increase in fluorescence with ssDNA probe 2 quantity is more observable. As shown in Fig. 4d, using 10 μM as the nominal quantity, the fluorescence increase with ssDNA probes 1, 2 and 3 were 20.5 ± 1.7, 47.7 ± 2.2, and 7.0 ± 1.1%, respectively. This suggests that the pairing with ssDNA probe 2 created the most number of additional binding sites as compared to ssDNA probe 1 and 3.
436 ± 153 RFU, and that with ssDNA probe 3 yielded 8503 ± 43, 8673 ± 80 and 9014 ± 22 RFU (Fig. 4b and c). It appears the fluorescence did not increase noticeably with the respective quantities of ssDNA probes 1 and 3. However, the increase in fluorescence with ssDNA probe 2 quantity is more observable. As shown in Fig. 4d, using 10 μM as the nominal quantity, the fluorescence increase with ssDNA probes 1, 2 and 3 were 20.5 ± 1.7, 47.7 ± 2.2, and 7.0 ± 1.1%, respectively. This suggests that the pairing with ssDNA probe 2 created the most number of additional binding sites as compared to ssDNA probe 1 and 3.
3.2. Response of aptasensor paired with different ssDNA probes in presence of target compound
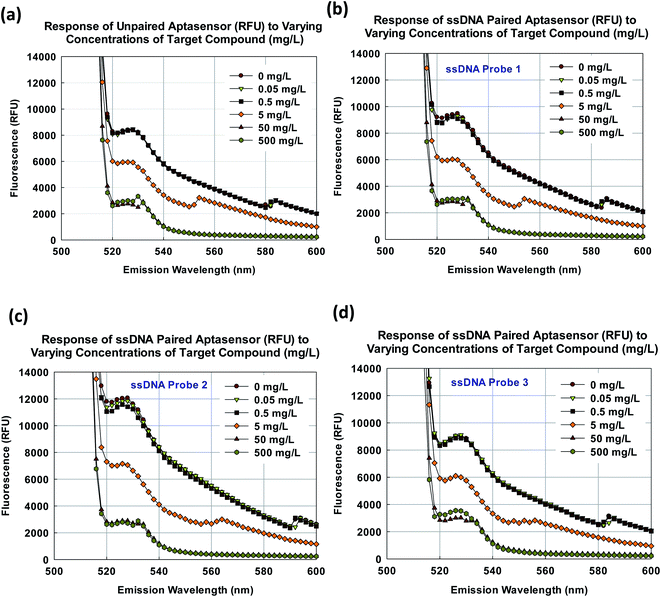
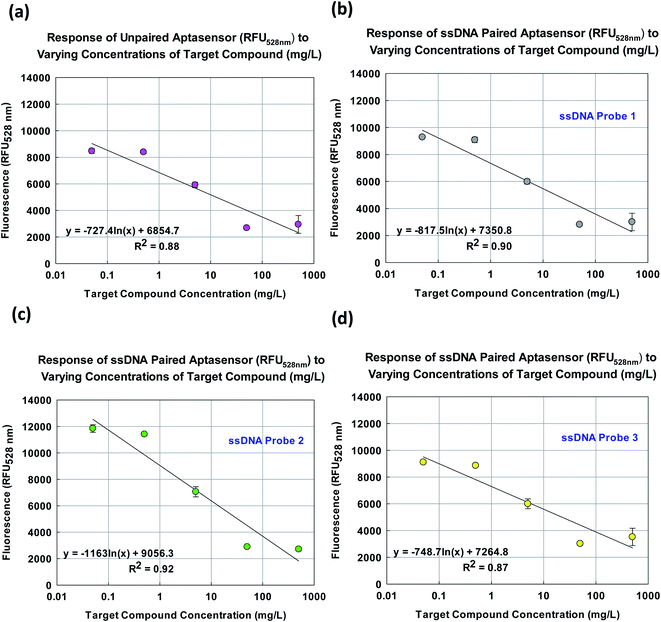
As shown in Fig. 5a, the fluorescence of the unpaired aptasensor decreased with the increasing target compound concentration. As mentioned earlier, the aptamer employed in the study has been previously screened for nonylphenol2 and the response is as expected. The aptasensor appeared to be the most responsive in target concentration range from 0.5 to 50 mg L−1. Therefore, similar observation is expected with ssDNA paired aptasensors. As shown in Fig. 5b–d, the decrease in fluorescence in response to the increase in target compound concentration was observed for all three ssDNA paired aptasensors across emission wavelength spectrum from 520 to 600 nm. Note that there were additional peaks around 550 and 580 nm and they could be due to spectral shifts as the result of different binding environment of the dyes. The observations are in line with the description by Lakowicz, 1999.33Since the target compound concentration increment was exponential (0, 0.05, 0.5, 5, 50, and 500 mg L−1), it is reasonable to plot the fluorescence at the emission wavelength of 528 nm against the target compound concentration with a logarithmic fit. It is important to note that the linearity of the aptasensor's response was not asserted here. Instead, the aptasensor's response would be presented as a fitted equation with logarithmic variables.
Fig. 6a shows the unpaired aptasensor yielded a sensitivity of 727.4 RFU528 nm/ln mg L−1 (y = −727.4![[thin space (1/6-em)]](https://www.rsc.org/images/entities/char_2009.gif) ln(x) + 6854.7, R2 = 0.877). In comparison as shown in Fig. 6b and d, aptasensor paired with ssDNA probes 1 and 3 yielded marginally higher sensitivities of 817.5 and 748.7 RFU528 nm/ln mg L−1 (y = −817.5
ln(x) + 6854.7, R2 = 0.877). In comparison as shown in Fig. 6b and d, aptasensor paired with ssDNA probes 1 and 3 yielded marginally higher sensitivities of 817.5 and 748.7 RFU528 nm/ln mg L−1 (y = −817.5![[thin space (1/6-em)]](https://www.rsc.org/images/entities/char_2009.gif) ln(x) + 7350.8, R2 = 0.899, y = −748.7
ln(x) + 7350.8, R2 = 0.899, y = −748.7![[thin space (1/6-em)]](https://www.rsc.org/images/entities/char_2009.gif) ln(x) + 7264.8, R2 = 0.87) respectively. As shown in Fig. 6c, aptasensor paired with ssDNA probe 2 appeared to be the most responsive with a sensitivity of 1163 RFU528 nm/ln mg L−1 (y = −1163
ln(x) + 7264.8, R2 = 0.87) respectively. As shown in Fig. 6c, aptasensor paired with ssDNA probe 2 appeared to be the most responsive with a sensitivity of 1163 RFU528 nm/ln mg L−1 (y = −1163![[thin space (1/6-em)]](https://www.rsc.org/images/entities/char_2009.gif) ln(x) + 9056.3, R2 = 0.92).
ln(x) + 9056.3, R2 = 0.92).
The increase of target compound concentration from 50 to 500 mg L−1 did not change the fluorescence significantly for all four aptasensors. This suggested that at the concentration of 50 mg L−1, there was already sufficient quantity of target compound to bind with all the aptasensors and the SYBR Green I dyes at the corresponding binding sites had all been freed. Thus, any further increase in target compound concentration would not result in further freeing of SYBR Green I dyes and hence lowering of fluorescence. Therefore, at high concentrations of target compound, all four aptasensors exhibited similar baseline fluorescence of ∼2800 RFU528 nm (50 mg L−1 target compound). This baseline fluorescence could possibly be attributed to the SYBR Green I dyes bound to sites that were unaffected by the conformational change.
A similar observation was also made as the target compound concentration increased from 0.05 to 0.5 mg L−1 where the change in fluorescence was lower in comparsion to that from 0.5 to 5 mg L−1. This was even observed for the aptasensor paired with ssDNA probe 2 where the fluorescence decreased from 11![[thin space (1/6-em)]](https://www.rsc.org/images/entities/char_2009.gif) 842.7 ± 285.9 to 11
842.7 ± 285.9 to 11![[thin space (1/6-em)]](https://www.rsc.org/images/entities/char_2009.gif) 413.7 ± 117.3 RFU528 nm.
413.7 ± 117.3 RFU528 nm.
3.3. Improvement in fluorescence response of aptasensors paired with ssDNA probes
As mentioned earlier and summarized in Fig. 7a, the aptasensor paired with ssDNA probe 2 yielded the highest sensitivity of 1163 RFU528 nm/ln mg L−1 among the four aptasensors. The percentage improvement in sensitivity for each paired aptasensor is obtained by normalizing their sensitivity with that of the unpaired aptasensor. As shown in Fig. 7b, the sensitivity of the aptasensor paired with ssDNA probe 3 was only improved by a marginal ∼3% whereas that of the aptasensor paired with ssDNA probe 2 was improved by ∼60%.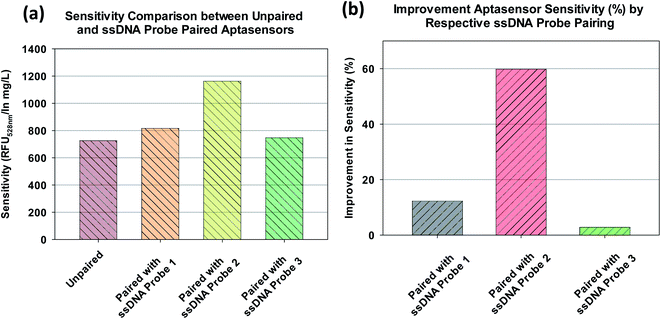 | ||
| Fig. 7 (a) Sensitivity of unpaired and ssDNA probe paired aptasensor, (b) improvement in sensitivity of ssDNA probe paired aptasensor. | ||
As mentioned earlier, the plot of fluorescence versus target compound concentration as shown in Fig. 6a–d employed a logarithmic fit. Even though the limit of detection is not critical in this study, it will still be of interest. For the unpaired and ssDNA probe 2 paired aptasensors, the blank response were 8414.3 ± 216.1 and 12![[thin space (1/6-em)]](https://www.rsc.org/images/entities/char_2009.gif) 060.0 ± 492.0 RFU528 nm, respectively. Note that the fluorescence at target compound concentration of 0.05 mg L−1 (low concentration) for unpaired and ssDNA probe 2 paired aptasensors were 8472.0 ± 178.4 and 11
060.0 ± 492.0 RFU528 nm, respectively. Note that the fluorescence at target compound concentration of 0.05 mg L−1 (low concentration) for unpaired and ssDNA probe 2 paired aptasensors were 8472.0 ± 178.4 and 11![[thin space (1/6-em)]](https://www.rsc.org/images/entities/char_2009.gif) 842.7 ± 285.9 RFU528 nm, respectively. Using the modified (to account for negative slope) definitions of limit of blank (LOB) and limit of detection (LOD) at 95% confidence as follows:34
842.7 ± 285.9 RFU528 nm, respectively. Using the modified (to account for negative slope) definitions of limit of blank (LOB) and limit of detection (LOD) at 95% confidence as follows:34
| LOB = mean blank − 1.645 × standard deviation of blank | (1a) |
| LOD = LOB − 1.645 × standard deviation of low concentration sample | (1b) |
The LOB and LOD for unpaired aptasensor were 8058.8 and 7765.3 RFU528 nm, respectively. Similar calculation yielded LOB and LOD for ssDNA probe 2 paired aptasensor as 11![[thin space (1/6-em)]](https://www.rsc.org/images/entities/char_2009.gif) 250.8 and 10
250.8 and 10![[thin space (1/6-em)]](https://www.rsc.org/images/entities/char_2009.gif) 780.5 RFU528 nm. These corresponded to LOD of ∼2 mg L−1 for the unpaired aptasensor and ∼0.7 mg L−1 for the ssDNA probe 2 paired aptasensor.
780.5 RFU528 nm. These corresponded to LOD of ∼2 mg L−1 for the unpaired aptasensor and ∼0.7 mg L−1 for the ssDNA probe 2 paired aptasensor.
3.4. Potential and limitations
One of the possible limitations entails the degree of fluorescence enhancement using the presented approach. In particular, an improvement of 60% may seem insignificant as compared to the previously reported fluorescence enhancement studies where the improvement was often in the range of tens of fold.35,36 It is important to note that the previously reported studies also often involved the synthesis of nanomaterials, new aptamers and fluorescence dyes as well as alternative binding – quenching mechanisms.35,36 However in this case, the improvement was achieved by simply pairing an existing aptamer with an appropriate ssDNA probe. It is also reasonable to suggest that similar improvement can be achieved by simultaneously pairing the aptamer with all three ssDNA probes and hence circumvent the need to select amongst them.Another possible limitation pertains to the LOD for the target compound nonylphenol in this study. As mentioned earlier, the LOD for the ssDNA probe paired aptasensor was ∼0.7 mg L−1. In comparison with electrochemical based and synthesized nanomaterials (gold nanoparticles) approaches with LOD in the range of μg L−1, it would appear that the presented approach is not of better performance. However in light of its simplicity and existing compatibility with portable analyzers,31 it can be deployed to monitor contaminated rivers and septic systems where the nonylphenol concentrations easily exceed 0.7 mg L−1. It is also highly conceivable that the use of charged integration based fluorescence measurement will reduce the standard deviation with time averaging and hence improve the LOD.16,31,37
Most importantly, this study is a demonstration of using an appropriate ssDNA probe to increase the number of binding sites and hence performance of a DNA binding dye and water quenched aptasensor. It is a possibility that can be extended to similar aptasensors without having to change or truncate the aptamer.
4. Conclusion
We have demonstrated the fluorescence enhancement of a DNA binding dye water quenching based aptasensor without changing or truncating the aptamer by pairing it with a suitable ssDNA probe. In particular, the pairing of the aptasensor with 10 μM of ssDNA probe 2 has increased the fluorescence of the aptasensor by 47.7 ± 2.2%. This strongly suggested that additional dye binding sites have been created in the aptasensor by the pairing with ssDNA probe 2. Using varying target compound concentration (0, 0.05, 0.5, 5, 50, and 500 mg L−1 4-n-nonylphenol), the ssDNA probe 2 paired aptasensor demonstrated a logarithmic fluorescence response (y = −1163![[thin space (1/6-em)]](https://www.rsc.org/images/entities/char_2009.gif) ln(x) + 9056.3, R2 = 0.92) with a sensitivity of 1163 RFU528 nm/ln mg L−1. In comparison, the unpaired aptasensor yielded a lower sensitivity of 727.4 RFU528 nm/ln mg L−1. In other words, the pairing with ssDNA probe 2 has improved the sensitivity of the aptasensor by ∼60%. Most importantly, this approach of fluorescence enhancement can be readily applied to other DNA binding fluorescence dye and water quenching based aptasensors without the need to undergo expensive and time-consuming screening of new aptamers.
ln(x) + 9056.3, R2 = 0.92) with a sensitivity of 1163 RFU528 nm/ln mg L−1. In comparison, the unpaired aptasensor yielded a lower sensitivity of 727.4 RFU528 nm/ln mg L−1. In other words, the pairing with ssDNA probe 2 has improved the sensitivity of the aptasensor by ∼60%. Most importantly, this approach of fluorescence enhancement can be readily applied to other DNA binding fluorescence dye and water quenching based aptasensors without the need to undergo expensive and time-consuming screening of new aptamers.
Conflicts of interest
There are no conflicts to declare.Acknowledgements
This work was supported by the National Research Foundation of Korea (NRF-2019R1A2C2084233 and NRF-2019R1F1A1058562).References
- M. Jo, J. Y. Ahn, J. Lee, S. Lee, S. W. Hong, J. W. Yoo, J. Kang, P. Dua, D. K. Lee, S. Hong and S. Kim, Oligonucleotides, 2011, 21, 85–91 CrossRef CAS PubMed.
- A.-R. Kim, S.-H. Kim, D. Kim, S. W. Cho, A. Son and M.-Y. Yoon, Int. J. Mol. Sci., 2020, 21, 208 CrossRef CAS PubMed.
- Y. Han, D. Diao, Z. Lu, X. Li, Q. Guo, Y. Huo, Q. Xu, Y. Li, S. Cao, J. Wang, Y. Wang, J. Zhao, Z. Li, M. He, Z. Luo and X. Lou, Anal. Chem., 2017, 89, 5270–5277 CrossRef CAS PubMed.
- M. A. Tabrizi, M. Shamsipur and L. Farzin, Biosens. Bioelectron., 2015, 74, 764–769 CrossRef PubMed.
- T. A. Mir, J. H. Yoon, N. G. Gurudatt, M. S. Won and Y. B. Shim, Biosens. Bioelectron., 2015, 74, 594–600 CrossRef CAS PubMed.
- M. Levy, S. F. Cater and A. D. Ellington, ChemBioChem, 2005, 6, 2163–2166 CrossRef CAS PubMed.
- C.-W. Chi, Y.-H. Lao, Y.-S. Li and L.-C. Chen, Biosens. Bioelectron., 2011, 26, 3346–3352 CrossRef CAS PubMed.
- W. Zhou, J. Ding and J. Liu, Biosens. Bioelectron., 2017, 87, 171–177 CrossRef CAS PubMed.
- M. Kim, H. J. Um, S. Bang, S. H. Lee, S. J. Oh, J. H. Han, K. W. Kim, J. Min and Y. H. Kim, Environ. Sci. Technol., 2009, 43, 9335–9340 CrossRef CAS PubMed.
- C. Tuerk and L. Gold, Science, 1990, 249, 505–510 CrossRef CAS PubMed.
- A. D. Ellington and J. W. Szostak, Nature, 1990, 346, 818–822 CrossRef CAS PubMed.
- J. Liu and Y. Lu, Nat. Protoc., 2006, 1, 246–252 CrossRef CAS PubMed.
- W. Jeon, S. Lee, D. H. Manjunatha and C. Ban, Anal. Biochem., 2013, 439, 11–16 CrossRef CAS PubMed.
- W. Zhao, W. Chiuman, J. C. F. Lam, S. A. McManus, W. Chen, Y. Cui, R. Pelton, M. A. Brook and Y. Li, J. Am. Chem. Soc., 2008, 130, 3610–3618 CrossRef CAS PubMed.
- E.-H. Lee, H. J. Lim, S.-D. Lee and A. Son, ACS Appl. Mater. Interfaces, 2017, 9, 14889–14898 CrossRef CAS PubMed.
- H. J. Lim, A.-R. Kim, M.-Y. Yoon, Y. You, B. Chua and A. Son, Biosens. Bioelectron., 2018, 121, 1–9 CrossRef CAS PubMed.
- Y. Wang, Z. Li, D. Hu, C.-T. Lin, J. Li and Y. Lin, J. Am. Chem. Soc., 2010, 132, 9274–9276 CrossRef CAS PubMed.
- H.-M. So, K. Won, Y. H. Kim, B.-K. Kim, B. H. Ryu, P. S. Na, H. Kim and J.-O. Lee, J. Am. Chem. Soc., 2005, 127, 11906–11907 CrossRef CAS PubMed.
- M. Citartan, S. C. B. Gopinath, J. Tominaga, S.-C. Tan and T.-H. Tang, Biosens. Bioelectron., 2012, 34, 1–11 CrossRef CAS PubMed.
- H. L. Marks, M. V. Pishko, G. W. Jackson and G. L. Cote, Anal. Chem., 2014, 86, 11614–11619 CrossRef CAS PubMed.
- D. M. Yao, G. Q. Wen and Z. L. Jiang, RSC Adv., 2013, 3, 13353–13356 RSC.
- E.-H. Lee and A. Son, Chem. Eng. J., 2019, 359, 1493–1501 CrossRef CAS.
- Y. Liu, N. Tuleouva, E. Ramanculov and A. Revzin, Anal. Chem., 2010, 82, 8131–8136 CrossRef CAS PubMed.
- E. J. Cho, J.-W. Lee and A. D. Ellington, Annu. Rev. Anal. Chem., 2009, 2, 241–264 CrossRef CAS PubMed.
- J. Zhou and J. Rossi, Nat. Rev. Drug Discovery, 2017, 16, 181–202 CrossRef CAS PubMed.
- W. Z. Zhou, P. J. J. Huang, J. S. Ding and J. Liu, Analyst, 2014, 139, 2627–2640 RSC.
- F. R. W. Schmitz, A. Valerio, D. Oliveria and D. Hotza, Appl. Microbiol. Biotechnol., 2020, 104, 6929–6939 CrossRef CAS PubMed.
- A. Ng, R. Chinnappan, S. Eissa, H. C. Liu, C. Tlili and M. Zourob, Environ. Sci. Technol., 2012, 46, 10697–10703 CrossRef CAS PubMed.
- L. Farzin, M. Shamsipur and S. Sheibani, Talanta, 2017, 174, 619–627 CrossRef CAS PubMed.
- J. Wang, T. Li, X. Guo and Z. Lu, Nucleic Acids Res., 2005, 33, e23 CrossRef PubMed.
- D. Kim, H. J. Lim, Y. G. Ahn, B. Chua and A. Son, Talanta, 2020, 219, 121216 CrossRef CAS PubMed.
- M. Zuker, Nucleic Acids Res., 2003, 31, 3406–3415 CrossRef CAS PubMed.
- J. R. Lakowicz, in Principles of Fluorescence Spectroscopy, Springer, Boston, MA, USA, 1999 Search PubMed.
- D. A. Armbruster and T. Pry, Clin. Biochem. Rev., 2008, 29, S49–S52 Search PubMed.
- K. Ray, R. Badugu, H. Szmacinski and J. R. Lakowicz, Chem. Commun., 2015, 51, 15023–15026 RSC.
- L. Jiang, X. Hang, P. Zhang, J. Zhang, Y. Wang, W. Wang and L. Ren, Microchem. J., 2019, 148, 285–290 CrossRef CAS.
- H. J. Lim, B. Chua and A. Son, Biosens. Bioelectron., 2017, 94, 10–18 CrossRef CAS PubMed.
Footnote |
| † Electronic supplementary information (ESI) available. See DOI: 10.1039/d1ra00971k |
| This journal is © The Royal Society of Chemistry 2021 |

