DOI:
10.1039/D1RA02614C
(Paper)
RSC Adv., 2021,
11, 16834-16840
Nanostructured Fe2O3/TiO2 composite particles with enhanced NIR reflectance for application to LiDAR detectable cool pigments
Received
2nd April 2021
, Accepted 21st April 2021
First published on 7th May 2021
Abstract
Nanostructured Fe2O3/TiO2 composite pigments with improved NIR reflectance were prepared by a homogeneous precipitation method using urea and NH4OH. The optical and morphological properties of the resulting pigment were investigated by varying the weight ratio of Fe2O3 to TiO2 and the calcination temperature. The resulting composite pigment has a nanostructure in which Fe2O3 nanoparticles of 20–30 nm size are well coated on the surface of TiO2 (∼100 nm) and the reflectance is greatly improved in the wavelength range of 620–1350 nm. The ratio of Fe2O3 to TiO2 and the calcination temperature were optimized to provide both high NIR reflectance and red color, which were 0.1 and 700 °C. As a result, compared with pure Fe2O3 (Eg = 2.06 eV, a* = 22.6), the optimized Fe2O3/TiO2 composite pigment (Eg = 2.09 eV, a* = 24.8) showed similar color properties and improved NIR reflectance by about 23.8%. In addition, the Fe2O3/TiO2 composite pigment showed about 62.7% larger reflectance at 905 nm than Fe2O3. According to a temperature rise test under IR illumination, the Fe2O3/TiO2 composite pigment was confirmed to have improved heat shielding properties. Therefore, the nanostructured Fe2O3/TiO2 powder could be potentially applied as a LiDAR detectable cool red pigment for autonomous vehicles.
Introduction
Energy consumption has gradually increased with the advent of various high-tech devices and an increase in the population. As a result, the use of fossil fuels required for energy production and human activities has increased, resulting in many social and environmental problems.1–3 Thus, a lot of effort is being devoted to technology development that can effectively reduce energy consumption.4–6 In particular, the heat island phenomena caused by urbanization increases the energy consumed by the building's heating and cooling.7,8 Sunlight consists of 5% ultraviolet light, 43% visible light, and 52% near infrared (NIR) light.9 Among them, many NIR lights are known to cause urban heat islands and increase the indoor temperature of buildings in the summer. Accordingly, paints with high infrared reflectance are attracting much attention in terms of reducing the energy use for maintaining indoor temperature in the summer by preventing heat islands in cities and improving the heat shielding properties of buildings.10–12 In addition, infrared reflective paints are required for rapidly developing autonomous driving cars. LiDAR (Light Detection and Ranging, LiDAR) is a core sensor for autonomous vehicles.13,14 The LiDAR sensor shoots a laser of a specific wavelength (905 nm or 1550 nm) that is invisible to the eye and then detects the light returned by colliding with an object to measure the distance, movement direction, and shape of the object. In order for LiDAR to work effectively, the paint applied to a vehicle or a road sign must have good infrared reflection properties. Accordingly, in order to improve the sensing performance of LiDAR installed in autonomous vehicles, the development of pigments with excellent reflective properties at 905 nm near-infrared rays is receiving great interest.
Inorganic pigments are small particulate substances that do not dissolve in solvents and have excellent hiding power, heat resistance, and light resistance properties. TiO2 and Fe2O3 are representative white and red inorganic pigments used in various applications.15 In particular, TiO2 is used as a pigment for cosmetics and heat shielding paints because it has excellent ultraviolet absorption ability and high reflectance of infrared as well as visible light.16 Fe2O3 pigments show differences in optical properties according to the particle size and shape,17 and are used in a variety of applications including photocatalysts, ceramics, cosmetics, and industrial paints by improving chromaticity and NIR reflectance.18–20 Referring to recent literature,20,21 when SiO2 or TiO2 is coated on the surface of Fe2O3, NIR reflectance can be improved. On the contrary, there is a report that the NIR reflectance of the red pigment is improved by coating Fe2O3 on the surface of the plate-shaped mica particles having excellent NIR reflecting properties, i.e., the NIR reflectance of the red pigment can be increased by coating a material having high NIR reflectance on the surface of Fe2O3 or, conversely, coating Fe2O3 on the surface of a large NIR reflective material. Nevertheless, as far as the authors know, there is no optical study of a red composite pigment when Fe2O3 nanoparticles are coated on the TiO2 surface.
The main goal of this work is to design a novel nanostructured red pigment that shows improved performance for 905 nm LiDAR light reflection and heat shielding properties. To do this, in this study, nanostructured Fe2O3/TiO2 composite pigment particles were prepared by coating Fe2O3 particles having a size in the range of tens of nanometer on the surface of about 100 nm TiO2 using a homogeneous precipitation method. The optical properties of the composite pigment was investigated with changing the synthetic temperature and the weight ratio of Fe2O3 to TiO2.
Experimental
A homogenous precipitation method was applied to prepare a nanostructured Fe2O3/TiO2 composite inorganic pigment (FT-X). TiO2 (anatase, AVENTION) nanoparticles of about 100 nm size, Fe(NO3)3·9H2O (Sigma-Aldrich, 98%), urea (JUNSEI, 98%), and NH4OH (Aldrich) were used as the starting precursors. The procedure of coating Fe2O3 on the surface of TiO2 nanoparticles is as follows. In the first, the Fe precursor solution was prepared to dissolve Fe(NO3)3·9H2O in a 500 mL beaker containing 150 mL of distilled water. Next, TiO2 colloidal solution was prepared by adding 5 g of TiO2 and urea (16.5 g) to a 500 mL three-necked flask containing 150 mL distilled water and ultrasonically dispersed for 30 min. When the TiO2 colloidal solution was heated and reached 85 °C, the prepared Fe precursor aqueous solution was injected into the TiO2 colloidal solution at a flow rate of 1.5 mL min−1 using a peristaltic pump and maintained for 4 h. Thereafter, the temperature of the resulting pigment solution was lowered to room temperature and then, diluted aqueous ammonia (10% v/v) was added to complete the precipitation of all the Fe2O3 nanoparticles on the TiO2 surface. The resulting precipitate was withdrawn by vacuum filtration. The amount of Fe(NO3)3·9H2O was adjusted so that the weight ratio of Fe2O3 to TiO2 was 0.5 (FT-1), 1.0 (FT-2), and 1.5 (FT-3). The withdrawn precipitate was dried in a convection oven at 100 °C and calcined at different temperatures in the range of 500 to 800 °C for 3 h in a tubular furnace flowing 200 mL min−1 of air.
The microstructure and the size of the prepared powder were confirmed through SEM (Scanning Electron Microscope System, Hitachi S-4800) and FE-TEM (Field Emission Transmission Electron Microscope, JEM-2100F, JEOL) analysis. To identify the crystalline phase of the synthesized pigment, XRD (X-ray diffraction, MiniFlex600, Rigaku) was measured from 2θ = 20° to 70° at a scan speed of 2° min−1. The reflectance of the prepared pigment powder was measured with a UV-visible-NIR spectrophotometer (Cary 5000 UV-vis-NIR, Agilent). Using the measured reflectance and standard solar irradiation (ASTM G173-03), infrared reflectance (RNIR) and total reflectance (Rtotal) were calculated using the following eqn (1) and (2), respectively.
| |
 | (1) |
| |
 | (2) |
where
i(
λ) is the standard solar irradiation (ASTM G173-03) and
r(
λ) is the reflection value of the pigment.
In order to measure the L*a*b* color coordinates and heat shielding properties of the prepared powder, a pigment film (10 cm × 10 cm) having a thickness of about 40–50 μm was prepared on an aluminum plate using the doctor blade method. The prepared Fe2O3/TiO2 pigment (0.5 g), resin (4.5 g), and curing agent (1.0 g) were uniformly mixed in a planetary mixer to make a pigment paste. From the measured L*a*b* values, the chroma (C*) value, the hue angle (h°), and the color difference (ΔE) of each pigment were calculated using the formula C* = (a*2 + b*2)1/2, h° = tan−1(b*/a*), and (ΔE)2 = (ΔL*)2 + (Δa*)2 + (Δb*)2, respectively. In order to check the NIR reflection performance of the Fe2O3/TiO2 (FT-X) pigments, the temperature of the film formed on the aluminium plate was measured using a thermocouple for 50 minutes at an interval of 5 seconds under irradiation with an infrared lamp (IR 250 RH IR2 230 V 250 W, PHILIPS). A simple schematic diagram of the experimental setup for measuring the heat shielding performance is shown in Fig. 1.
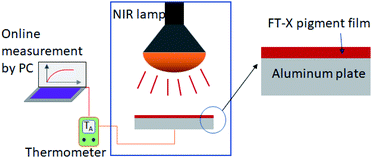 |
| | Fig. 1 Schematic diagram showing the experimental setup for the temperature rise test of the prepared pigments. | |
Results and discussion
Fig. 2 shows the photos of the prepared Fe2O3/TiO2 pigment nanoparticles, in which the horizontal direction shows the change in the heat treatment temperature and the vertical direction shows a change in the weight ratio of Fe2O3 to TiO2. When the amount of Fe2O3 increases from sample FT-1 to FT-3 at the same heat treatment temperature, the color of the Fe2O3/TiO2 powder approaches the color of pure Fe2O3. When observed with naked eye at a fixed Fe2O3/TiO2 ratio (FT-X, X = 1, 2, 3), the color of the pigment did not change significantly as the heat treatment temperature increased from 500 °C to 700 °C. However, at 800 °C, the FT-2 and FT-3 powder colors showed a darker red color than that of the samples calcined at low temperature, and FT-1 and pure Fe2O3 changed to completely different colors. Therefore, in order for the Fe2O3/TiO2 pigment powder to have a color similar to that of pure Fe2O3, the weight ratio of Fe2O3 to TiO2 should be 1.0 or higher and the post-heat treatment temperature should be 700 °C or lower.
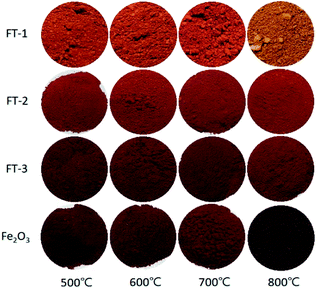 |
| | Fig. 2 Photos of the Fe2O3 and Fe2O3/TiO2 composite (FT-X) pigments prepared at different Fe2O3 content (vertical axis) and calcination temperature (horizontal axis). | |
Fig. 3 shows the XRD results of the Fe2O3 and Fe2O3/TiO2 (FT-2) pigments prepared by the homogeneous precipitation method and calcined at different temperatures. The diffraction peaks observed in Fig. 3(a) are consistent with α-Fe2O3 (JCPDS # 01-080-2377). In the XRD result of the Fe2O3 sample, no other change was observed except that the intensity of the diffraction peak increased as the calcination temperature changed from 500 °C to 800 °C. Fig. 3(b) is the XRD diffraction patterns of the Fe2O3/TiO2 (FT-2) composite pigment, and the observed peaks agree well with the anatase TiO2 (JCPDS # 01-078-2486) and α-Fe2O3. As the calcination temperature increases from 500 °C to 800 °C, the TiO2 and α-Fe2O3 crystal phases coexist, and no diffraction peaks were observed for the specific impurity phase. From the XRD result for pure Fe2O3, magnetite Fe3O4, which is a dark source, was not formed as an impurity phase. Nevertheless, even if the XRD peak is not detected, there is still a possibility of the presence of FeO or Fe3O4 on the surface of the hematite Fe2O3 particles, i.e, a part of the surface of Fe2O3 can be reduced by itself at 800 °C, which is thought to be the reason for making the particles appear dark red. From the measured XRD diffraction information, the crystal size (D) of Fe2O3 was calculated using Scherrer's equation
| |
 | (3) |
where
K is the Scherrer constant (
K = 0.9),
λ is the wavelength of the X-ray used (0.15406 nm),
β is the Full Width at Half Maximum (FWHM) of α-Fe
2O
3, and
θ is the diffraction angle.
Fig. 3(c) shows the calculated Fe
2O
3 crystallite size in pure Fe
2O
3 and Fe
2O
3/TiO
2 (FT-2) composite pigment powder as a function of temperature. In the case of pure Fe
2O
3, the crystallite size increases linearly as the calcination temperature increases. The increase in the Fe
2O
3 crystallite size in the Fe
2O
3/TiO
2 (FT-2) composite pigment was smaller than that of the pure Fe
2O
3 due to the increase in the calcination temperature, and in particular, the crystallite size decreased at 800 °C. In other words, the growth of Fe
2O
3 crystals depending on the heat treatment temperature is suppressed when coating on the TiO
2 surface, and Fe
2O
3 crystals cannot grow anymore at 800 °C or higher.
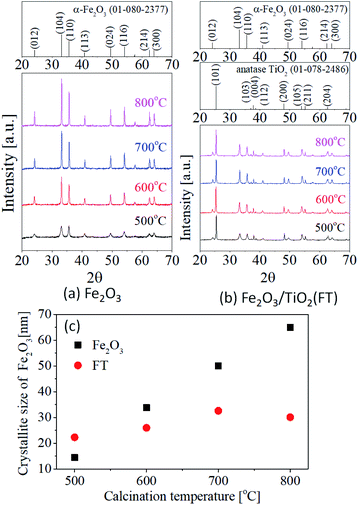 |
| | Fig. 3 XRD results of (a) Fe2O3 and (b) Fe2O3/TiO2 (FT-2) calcined at different temperatures from 500 °C to 800 °C. (c) Crystallite size of Fe2O3 as a function of temperature. | |
As shown in Fig. 2, the color of the Fe2O3/TiO2 (FT-1) composite pigment shows a big difference at the calcination temperature of 700 °C and 800 °C but there is no significant difference in the color of the FT-2 and FT-3 samples. To investigate why this color dependence differs with the calcination temperature, XRD analysis was performed on the FT-X composite pigments and the resulting XRD pattern is shown in Fig. 4. At 700 °C (Fig. 4(a)), as the amount of Fe2O3 increases, the intensity of the anatase TiO2 peak decreases and the α-Fe2O3 peak intensity increases. In addition, there is no significant difference in the position of the diffraction peak regardless of the amount of Fe2O3, and the observed peaks are in good agreement with the anatase TiO2 and α-Fe2O3 peaks. At 800 °C (Fig. 4(b)), the peaks observed in the FT-2 and FT-3 samples agree well with the anatase TiO2 and α-Fe2O3 peaks. However, in the case of the FT-1 sample, a strong diffraction peak of TiO2 anatase was observed but the peak corresponding to α-Fe2O3 was weakened; instead, strong peaks corresponding to rutile TiO2(Δ) and FeTiO3(♣) appeared. Also, the FT-1 sample calcined at 800 °C has new weak peaks corresponding to Fe2TiO5(◆), which is the result of the formation of iron titanate compound through solid reaction between Fe2O3 and TiO2 at 800 °C, as shown below.
| | |
Fe2O3 + 2TiO2 → 2FeTiO3 + 1/2O2
| (4) |
| | |
Fe2O3 + TiO2 → Fe2TiO5
| (5) |
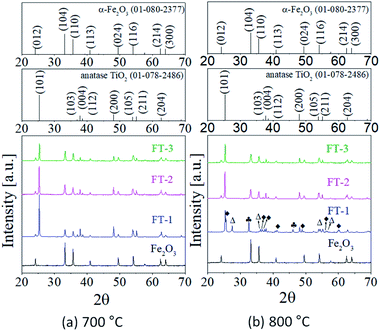 |
| | Fig. 4 XRD patterns of Fe2O3 and FT-X composite pigments calcined at (a) 700 °C and (b) 800 °C. | |
In FT-2 and FT-3 samples containing relatively large amounts of Fe2O3, no diffraction peaks of iron titanate compounds are observed even at 800 °C. These results indicate that for the FT-2 and FT-3 samples with enough Fe2O3 nanoparticles compared to the TiO2 surface, most of the Fe2O3 nanoparticles do not react with TiO2 but with other neighboring Fe2O3 particles, first participating in particle growth. On the other hand, in the case of FT-1, since the particle size of Fe2O3 formed on the TiO2 surface is small and its number concentration is low, it seems that Fe2O3 reacts with TiO2 first to form an iron titanate compound rather than react with other Fe2O3 particles to grow.
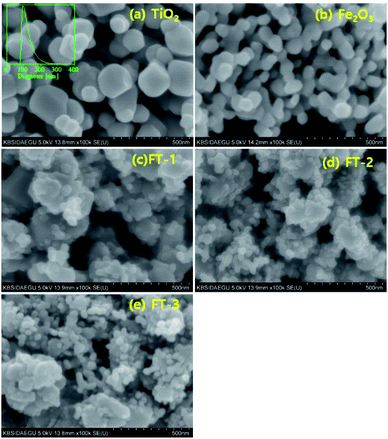
Fig. 5 shows the SEM photos of the prepared Fe2O3 and FT-X composite pigments calcined at 700 °C. The SEM photo of the TiO2 nanoparticle used as the precursor is also included in Fig. 5(a). The particle size distribution of TiO2 is in the inset of Fig. 5(a), indicating that the average size is about 100 nm and is in good agreement with the size observed in the SEM. Fig. 5(b) is a SEM photograph of pure Fe2O3 powder prepared by a homogeneous precipitation method without TiO2. The particle size of the prepared Fe2O3 is about 30–40 nm. For the FT-X composite pigment powder, some Fe2O3 nanoparticles adhere to the TiO2 surface or exist independently. Particularly at high Fe2O3 content such as FT-3, there are numerous Fe2O3 nanoparticles that are separated without attaching to the TiO2 surface. The size of Fe2O3 in the FT-X composite is smaller than that of pure Fe2O3. This supports the suppression of the growth of Fe2O3 particles in the FT-X composite pigment particles during the calcination process. Even if the amount of Fe2O3 increases, the particle size of Fe2O3 coated on the TiO2 surface does not change significantly.
 |
| | Fig. 5 SEM photos of (a) TiO2 nanoparticles, (b) Fe2O3, (c) FT-1, (d) FT-2, and (e) FT-3 pigment powders. | |
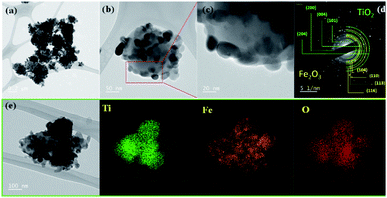
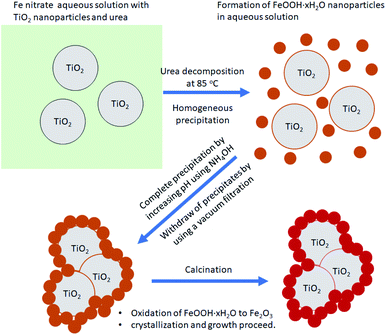
Fig. 6 shows a TEM photo, SAED pattern, and elemental mapping for the FT-2 composite pigment powder calcined at 700 °C. The TEM result indicates that Fe2O3 nanoparticles are about 20–30 nm in size and adhere well on the TiO2 surface. In addition, there is no significant agglomeration between the Fe2O3/TiO2 composite particles. The SAED pattern indicates that the FT-2 pigment has high crystallinity and the observed bright spots correspond to the (101), (004), (200), and (204) planes of anatase TiO2 and the (104), (110), (113), and (116) planes of α-Fe2O3. The elemental mapping results indicate that in the FT-2 composite pigment, the relatively large particles are TiO2 and the smaller nanoparticles are Fe2O3 attached to the TiO2 surface. Fig. 7 shows the schematic diagram of the formation mechanism of Fe2O3/TiO2 composite pigments based on XRD, SEM, TEM, and EDS analysis. When the Fe precursor solution including TiO2 particles and urea is heated to 85 °C, nanoparticles of iron hydroxide (FeOOH) are first formed by the decomposition of urea. Thereafter, the formed FeOOH nanoparticles are further precipitated to the TiO2 surface by increasing the pH of the solution using NH4OH. The resulting FeOOH/TiO2 is changed to Fe2O3/TiO2 through calcination.
 |
| | Fig. 6 TEM photos (a–c), SAED pattern (d), and elemental mapping (e) for nanostructured Fe2O3/TiO2 composite pigment (FT-2) calcined at 700 °C. | |
 |
| | Fig. 7 Schematic diagram showing the formation mechanism of nanostructured Fe2O3/TiO2 composite pigments through the homogeneous precipitation method using urea and NH4OH. | |
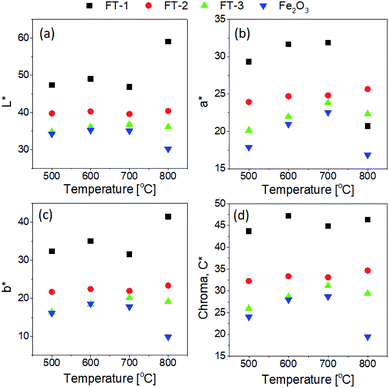
The L*a*b* color coordinates were measured for the FT-X composite pigments, and the resulting L*, a*, and b* values are shown in Fig. 8 as a function of the calcination temperature. The L* value representing the brightness is 100 for white and close to 0 for black. a* has a (+) value if the pigment is red and a (−) value if the pigment is green. b* has a (+) value if the pigment is yellow and a (−) value if the pigment is blue. For red pigments, the a* value should be as large as possible, whereas for the b* value, the closer it is to zero, the better. In the case of the FT-1 sample with the lowest Fe2O3 content, the L*, a*, and b* values tend to increase as the calcination temperature increases. For the FT-2 sample, there is no significant change in the L* and b* values with changing temperature, whereas the b* values increase slightly. In the case of the FT-3 pigment, the dependence of the L*, a*, and b* values on the calcination temperature is a similar to that of the Fe2O3 powder, i.e., the L*, a*, and b* values increase to a temperature of 700 °C and decrease at 800 °C. The L*a*b* value of the FT-X composite pigment increases as the Fe2O3 content decreases when compared at fixed temperature. The chroma value shows a temperature dependence similar to the a* value except for 800 °C. As a result of considering the L*a*b* color coordinates, the optimum calcination temperature was determined to be 700 °C to obtain the Fe2O3/TiO2 composite red pigment powder. For the Fe2O3/TiO2 (FT-X) composite pigments calcined at 700 °C, the CIE L*a*b* color coordinates, chroma (C*), hue angle (h°), and color difference (ΔE) are summarized in Table 1. Pure Fe2O3 shows L* = 35.0, a* = 22.6, b* = 17.7, C* = 28.7, and h° = 38.1. In the FT-X composite pigments, the h° value steadily increases as the ratio of Fe2O3 to TiO2 decreases. The color difference (ΔE) between the Fe2O3 and composite pigments ranges from 3.0 to 20.5 depending on the weight ratio of Fe2O3 to TiO2. In particular, for the FT-1 pigment, the color difference is about 20.5, indicating that the powder color is significantly different from Fe2O3, as seen in the photo of each powder in Fig. 2.
 |
| | Fig. 8 Calcination temperature effect on the optical properties of nanostructured Fe2O3/TiO2 (FT-X) pigments: (a) L*, (b) a*, (c) b*, and (d) C* values. | |
Table 1 L*a*b* color coordinates, chroma, hue angle, and color difference for nanostructured Fe2O3/TiO2 (FT-X) pigments calcined at 700 °C
| Pigments |
FT-1 |
FT-2 |
FT-3 |
Fe2O3 |
| Weight ratio. |
| Fe2O3/TiO2a |
0.5 |
1 |
1.5 |
— |
| L* |
46.9 |
39.6 |
37.2 |
35 |
| a* |
31.9 |
24.8 |
24 |
22.6 |
| b* |
31.5 |
21.9 |
19.2 |
17.7 |
| C* |
44.8 |
33.1 |
31.2 |
28.7 |
| h° |
44.6 |
41.4 |
38.7 |
38.1 |
| ΔE |
20.5 |
6.6 |
3 |
0 |
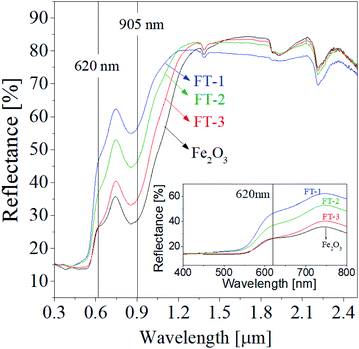
Fig. 9 shows the UV-visible-NIR reflectance spectra of the FT-X pigment calcined at 700 °C, indicating that the reflectance is highly dependent on the weight ratio of Fe2O3 to TiO2. Notably, the reflectance of the FT-3 sample with the highest amount of Fe2O3 is similar to that of pure Fe2O3 powder at wavelengths less than about 620 nm. This reflects that the hue powder color of FT-3 is close to that of Fe2O3. On the other hand, in the wavelength range from about 550 nm to 610 nm, the FT-1 and FT-2 samples show a significant increase in the reflectance at the wavelength range from about 550 nm to 610 nm, as shown in the inset of Fig. 9. At wavelength less than 550 nm, both the FT-1 and FT-2 samples show a slight increase in the reflectance compared with the FT-3 sample.
 |
| | Fig. 9 UV-visible-NIR diffused reflectance of nanostructured Fe2O3/TiO2 (FT-X) pigments calcined at 700 °C. | |
The NIR reflectance (RNIR) and total reflectance (Rtotal) of the prepared Fe2O3 and FT-X composite pigments were calculated using the formula (1) and (2), respectively. The resulting reflectance values are shown in Table 2. The calculated NIR reflectance of Fe2O3 is about 51.2%. The NIR reflectance of FT-3, FT-2, and FT-1 composite pigments was 55.8%, 63.4%, and 68.2%, respectively, i.e., compared to Fe2O3, the NIR reflectance of FT-3, FT-2, and FT-1 pigments were improved by 9.0%, 23.8%, and 33.2%, respectively. Like the NIR reflectance, the total reflectance of the FT-X pigments is higher about 7.4% for FT-3, 25.1% for FT-2, and 37.2% for FT-3 than Fe2O3. To evaluate the LiDAR reflection performance of the prepared FT-X pigments, the reflectance at 905 nm is summarized in Table 2. At 905 nm wavelength, the reflectance of the FT-X pigments is greater than that of Fe2O3 (28.7%) and increases in the order of FT-3 (35.2%) < FT-2 (46.7%) < FT-1 (56.8%), i.e., the 905 nm NIR reflectance for LiDAR was improved by 22.6%, 62.7%, and 97.9% for the composite pigments FT-3, FT-2, and FT-1, respectively. From the reflectance results, it was confirmed that the red and NIR reflectance can be greatly improved in the wavelength range of 620 nm to 1350 nm by coating Fe2O3 nanoparticles on the TiO2 surface.
Table 2 Band gap, NIR reflectance, and total reflectance for nanostructured Fe2O3/TiO2 (FT-X) pigments calcined at 700 °Ca
| Pigment |
Eg [eV] |
Reflectance [%] |
| RNIR |
Δ |
RTotal |
Δ |
R@905 |
Δ |
| Δ = (R/RFe2O3 − 1) × 100 |
| FT-1 |
2.13 |
68.2 |
+33.2 |
50.2 |
+37.2 |
56.8 |
97.9 |
| FT-2 |
2.09 |
63.4 |
+23.8 |
45.8 |
+25.1 |
46.7 |
62.7 |
| FT-3 |
2.04 |
55.8 |
+9.0 |
39.3 |
+7.4 |
35.2 |
22.6 |
| Fe2O3 |
2.06 |
51.2 |
0 |
36.6 |
0 |
28.7 |
0 |
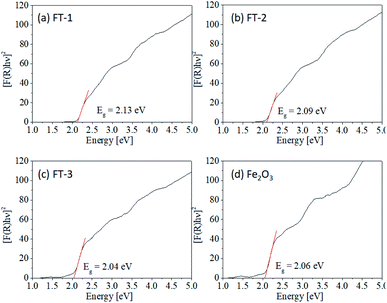
Band gap is an important variable in evaluating the optical properties of nano-sized pigments. The band gap (Eg) of the prepared FT-X composite pigment powder can be calculated from the Kubelka–Munk equation and Tauc plot using the diffuse reflectance data.
| |
 | (6) |
where
R is the reflectance of pigments,
K is the molar absorption coefficient,
S is the scattering factor,
hν is the photon energy, and
A is the absorption constant. In the
eqn (7), the exponent is
n = 1/2 for direct bandgap and
n = 2 for indirect bandgap. Thus, the direct band gap of the prepared pigments can be calculated from the Tauc plot of [
F(
R)
hv]
2 versus hv.
Fig. 10 shows the Tauc plots for the Fe
2O
3 and FT-
X pigments, and the resulting band gaps are summarized in
Table 2. Pure Fe
2O
3 nanoparticles have a band gap of about 2.06 eV. The band gaps of the FT-1, FT-2, and FT-3 composite pigments are 2.13 eV, 2.09 eV, and 2.04 eV, respectively,
i.e., as the amount of Fe
2O
3 coated on TiO
2 decreases, the band gap of the FT-
X composite pigments tends to slightly increase, which is in good agreement with the changes in the powder color and hue values. Based on the results obtained so far, it was concluded that the most suitable composite pigment in terms of improving the near-infrared reflectance with a color similar to pure Fe
2O
3 was the FT-2 sample with a ratio of Fe
2O
3 to TiO
2 of 1.0.
 |
| | Fig. 10 Tauc plot of nanostructured Fe2O3/TiO2 (FT-X) pigments calcined at 700 °C: (a) FT-1, (b) FT-2, (c) FT-3, and (d) Fe2O3. | |
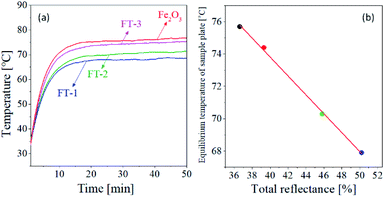
The NIR reflection performance of the prepared FT-X pigments was investigated through a temperature rise test of the pigment film formed on an aluminum plate under the illumination of an IR lamp. Fig. 11(a) shows the temperature of the pigment film as a function of the illumination time of the IR lamp. The temperature of each pigment film rises rapidly and reaches equilibrium after about 30 min. The equilibrium temperature of pure Fe2O3 is about 75.7 °C, and the FT-3, FT-2, and FT-1 pigments show equilibrium temperatures of 74.4 °C, 70.3 °C, and 67.9 °C, respectively. Fig. 11(b) is a plot of the equilibrium temperature versus the total reflectance (Rtotal), indicating that the temperature of the pigment film is inversely proportional to the total reflectance. In other words, the higher the total reflectivity, the lower the temperature rise. From this result, the FT-X composite pigment was proved to have an improved heat shielding property.
 |
| | Fig. 11 (a) Temperature change as a function of time and (b) equilibrium temperature as a function of total reflectance (Rtotal) for the pigment films. | |
Conclusions
Nanostructured Fe2O3/TiO2 composite pigments were synthesized using a homogeneous precipitation method, and the optical and morphological properties of the resulting pigments were investigated. The prepared composite pigments showed a nanostructured form in which Fe2O3 nanoparticles with about 20 to 30 nm size were anchored on the surface of TiO2 of about 100 nm size. When the calcination temperature was below 700 °C, the prepared composite pigments did not form impurities regardless of the ratio of Fe2O3 to TiO2, and had a highly crystalline α-Fe2O3 and anatase TiO2 phase. Coating Fe2O3 nanoparticles on the TiO2 surface can greatly improve the reflectance of the red pigments in the wavelength range from 620 nm to 1350 nm. In terms of achieving the high near-infrared reflectance and keeping the powder color red, the optimum weight ratio of Fe2O3 to TiO2 and the calcination temperature were 1.0 and 700 °C, respectively. As a result, the total NIR reflectance and 905 nm LiDAR reflectance of Fe2O3/TiO2 pigments prepared under optimal synthetic conditions were improved by 23.8% and 62.7%, respectively. From the temperature rise test, it was proven that the nanostructured Fe2O3/TiO2 composite pigment exhibits improved heat shielding properties.
Conflicts of interest
There are no conflicts to declare.
Acknowledgements
This work was supported by the Industrial Technology Innovation Program (Grant No. 20004663) funded By the Ministry of Trade, Industry & Energy (MI, Korea).
Notes and references
- I. Khan, F. Hou and H. P. Le, Sci. Total Environ., 2021, 754, 142222 CrossRef CAS PubMed.
- M. K. Anser, Environ. Sci. Pollut. Res., 2019, 26, 13453–13463 CrossRef CAS PubMed.
- R. B. Jackson, C. Le Quéré, R. M. Andrew, J. G. Canadell, J. I. Korsbakken, Z. Liu, G. P. Peters and B. Zheng, Environ. Res. Lett., 2018, 13, 120401 CrossRef CAS.
- B. Lin and J. Zhu, Sci. Total Environ., 2019, 659, 1505–1512 CrossRef CAS PubMed.
- K. He and L. Wang, Renewable Sustainable Energy Rev., 2017, 70, 1022–1039 CrossRef.
- T. Wang, F. Xiao, X. Zhu, B. Huang, J. Wang and S. Amirkhanian, J. Cleaner Prod., 2018, 180, 139–158 CrossRef CAS.
- V. Pérez-Andreu, C. Aparicio-Fernández, A. Martínez-Ibernón and J.-L. Vivancos, Energy, 2018, 165, 63–74 CrossRef.
- H. Wang and Q. Chen, Energy Build., 2014, 82, 428–436 CrossRef.
- A. Han, M. Zhao, M. Ye, J. Liao, Z. Zhang and N. Li, Sol. Energy, 2013, 91, 32–36 CrossRef CAS.
- M. Santamouris, A. Synnefa and T. karlessi, Sol. Energy, 2011, 85, 3085–3102 CrossRef.
- M. Santamouris and G. Y. Yun, Renewable Energy, 2020, 161, 792–807 CrossRef CAS.
- M. Mazhar, M. Abdouss, F. Zarifi and M. Zrgaran, Pigm. Resin Technol., 2020, 49, 265–271 CrossRef CAS.
- Y. Li and J. Ibanez-Guzman, IEEE Signal Process. Mag., 2020, 37, 50–61 Search PubMed.
- J. H. Kim, V. Patil, J. M. Chun, H. S. Park, S. W. Seo and Y. S. Kim, MRS Adv., 2020, 5, 515–522 CrossRef CAS; A. Laplaza, E. Jimenez-Relinque, J. Campos and M. Castellote, Constr. Build. Mater.Constr. Build. Mater., 2017, 144, 300–310 CrossRef.
- H. J. Kim, H. J. Lee and D.-S. Kim, Mater. Des., 2018, 150, 188–192 CrossRef CAS.
- H. Katsuki and S. Komarneni, J. Am. Ceram. Soc., 2003, 86, 183–185 CrossRef CAS.
- C. N. C. Hitam and A. A. Jalil, J. Environ. Manage., 2020, 258, 110050 CrossRef CAS PubMed.
- F. Jiang, Y. Li, L. Zhao and D. Cang, Appl. Clay Sci., 2017, 143, 199–204 CrossRef CAS.
- P. Soranakom, N. Vittayakorn, P. Rakkwamsuk, S. Supothina and P. Seeharaj, Ceram. Int., 2021, 47, 13147–13155 CrossRef CAS.
- S. Sadeghi-Niaraki, B. Ghasemi, A. Habibolahzadeh, E. Ghasemi and M. Ghahari, Mater. Chem. Phys., 2019, 235, 121769 CrossRef CAS.
- H. J. Lee, D. S. Kim, S.-H. Lee, H. Mi Lim, B.-K. Choi, K.-J. Kang, J. I. Jeong and K.-S. Cho, Korean J. Mater. Res., 2015, 25, 61–67 CrossRef CAS.
|
| This journal is © The Royal Society of Chemistry 2021 |
Click here to see how this site uses Cookies. View our privacy policy here.  Open Access Article
 *a and
Young-Seok Kimb


