 Open Access Article
Dendronized oligoethylene glycols with phosphonate tweezers for cell-repellent coating of oxide surfaces: coarse-scale and nanoscopic interfacial forces†
Julian Czajor‡
a,
Wasim Abuillan‡a,
Dinh Vu Nguyenb,
Christopher Heidebrecht a,
Evan A. Mondarte
 c,
Oleg V. Konovalovd,
Tomohiro Hayashi
 ce,
Delphine Felder-Flesch
 bf,
Stefan Kaufmanna and
Motomu Tanaka
 *ag
*ag
aPhysical Chemistry of Biosystems, Institute of Physical Chemistry, Heidelberg University, 69120 Heidelberg, Germany. E-mail: tanaka@uni-heidelberg.de
bInstitut de Physique et Chimie des Matériaux de Strasbourg (IPCMS), University of Strasbourg, 23 rue du Loess, 67034 Strasbourg, France
cDepartment of Materials Science and Engineering, School of Materials and Chemical Technology, Tokyo Institute of Technology, 226-8502, Kanagawa, Japan
dEuropean Synchrotron Radiation Facility, CS 40220, 38043, Grenoble, France
eJST-PRESTO, 4-1-8 Hon-cho, Kawaguchi, Saitama, 332-0012, Japan
fSUPERBRANCHE SAS, IPCMS Bâtiment 69, 23 rue du loess BP 43, 67034 Strasbourg Cedex 2, France
gCenter for Integrative Medicine and Physics, Institute for Advanced Study, Kyoto University, Kyoto 606-8501, Japan
First published on 17th May 2021
Abstract
Dendronized oligoethylene glycols (dendron OEGs) with two phosphonate groups (phosphonate tweezers) have been drawing significant attention as a new class of coating materials for superparamagnetic iron oxide surfaces. However, despite dendron OEGs showing outstanding stability in physiological fluids in previous studies, little is understood about their structure and mechanical properties. Herein we report the surface and internal structures and mechanical properties of dendron OEGs, and quantitatively determine their ability to avoid non-specific adhesion of blood platelets. To gain insight into the interfacial force interactions, we measured the coarse-scale surface force acting on cell-sized particles and mapped the nanoscopic pinning centers by fast force mapping.
Introduction
Owing to their excellent magnetic properties and high transverse relaxation, over the past several decades superparamagnetic iron oxide nanoparticles have been drawing increasing attention for a variety of medical applications, such as contrast enhancement in MRI1–3 and hyperthermia cancer theranostics.4,5 A key prerequisite for their medical application is the chemical functionalization of nanoparticles to achieve; (i) high stability in physiological fluids, (ii) control of the particle size below 100 nm, without aggregation, and (iii) the preservation of high saturation magnetization. In the absence of surface coating materials, iron oxide nanoparticles tend to form μm-sized aggregates. In addition, it is clear that iron oxide nanoparticles for medical applications should not non-specifically adhere to vascular endothelial cells or blood cells, particularly platelets. To date, several polymers have been developed for coating the surface of oxide nanoparticles, including polyethylene glycol (PEG),6 dextran,7 and polyvinylpyrrolidone, amongst others.8 However, despite significant progress, a persisting limitation of polymer-based coatings is that high molecular weight polymers tend to form thick organic “shells” that generally increase the hydrodynamic diameter of particles and cause problems following administration.To increase the grafting density and enable the flexible adjustment of structures and functions, Felder-Flesch and co-workers proposed the grafting of dendritic oligoethylene glycols via phosphonate chemistry.9–11 In contrast to widely-used linear polymer brushes, dendritic molecules allow for the discrete control of entities with monodisperse size and physical properties by changing their generation.12 Phosphonates were chosen for the surface coupling because they realize a much higher grafting rate13 and stronger binding than the carboxylate anchors more commonly used for the surface coating of oxide nanoparticles.14,15 The replacement of carboxylates with phosphonates also offers an advantage in terms of the magnetic properties. In-field Mössbauer spectroscopy and SQUID measurements have suggested that the coating of oxide with carboxylates leads to spin canting in the oxide layer, resulting in a decrease in the net magnetization. In contrast, coating with phosphonate did not screen the magnetic properties.15 The coating of iron oxide nanoparticles with thin layers of dendronized oligoethylene glycol via phosphonate chemistry therefore realized versatile, robust, and high relaxation MRI contrast agents.10 To date, dendronized oligoethylene glycol layers on iron oxide nanoparticles have been characterized using thermal analysis (TGA and DTA), FTIR, and XPS. Although the outstanding stability of nanometer-thick dendron layers under physiological conditions—such as in blood—indicates their potential for use as ultrathin cell-repellent coating materials, little is understood of how their physical characteristics modulate interactions with cells.
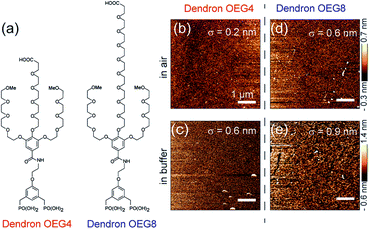
In this study, we investigate the structure and mechanical properties of dendronized oligoethylene glycol layers grafted on planar silica surfaces by combining various surface sensitive techniques. We studied two dendronized oligoethylene glycols, denoted dendron OEG4 and dendron OEG8 (Fig. 1a).11 These molecules contain two phosphonate groups, known as “phosphonate tweezers”, that realize stronger surface coupling than a single phosphonate group. First, we optimized the preparation conditions by slightly modifying a previously reported protocol.16 After optimizing the functionalization protocols, we determined the surface topography and internal structures of the dendron OEG films in air and in buffer using AFM and high energy specular X-ray reflectivity, respectively. The mechanical properties of the dendron OEG films were further characterized by nanoindentation. As surface coating with both dendronized OEGs distinctly reduced the non-specific adhesion of human platelets, we tried to determine the physical mechanism of cell repellency. First, we measured the Young's modulus of the dendron OEG monolayers using AFM nanoindentation. To understand the interfacial forces exerted on cells near the dendron-coated surfaces, we measured the coarse-scale surface forces using a cantilever connected to a cell-sized SiO2 particle. In addition, we carried out fast force mapping to spatially resolve the nanoscopic pinning centers that are much smaller than a single cell.
Results and discussion
Optimization of functionalization, and surface topography
We initially functionalized the surface of Si wafers by incubating the substrates with an aqueous solution of dendrons (1 mg mL−1) for 30 min, according to a previously reported protocol.11 However, the resulting film exhibited numerous defects (ESI Fig. S1†), suggesting that the film deposition protocol required improvement. We therefore followed a protocol reported by Hanson et al., tethering by aggregation and growth, which was developed for hydrophobic phosphonates.16To optimize the protocol for our dendrons, we systematically varied the reaction time, temperature, and heating time. The quality of the dendron coating was assessed by water contact angle (θ) and ellipsometry measurements. After optimizing each parameter (for the full protocol see the Experimental section), we were able to reproducibly prepare films with a water contact angle of θ = 30–40° and ellipsometric thickness of d = 9–12 Å, which suggests the deposition of monolayers that present oligoethylene glycol chains.
The surface topographic profiles of Si wafers coated with dendrons OEG4 and OEG8 were characterized using tapping mode AFM. Fig. 1b and c show the representative topographic profiles of a dendron OEG4 film measured in air and in buffer, respectively. The rms roughness value calculated within a 5 × 5 μm2 area in air (σ ≈ 2 Å) confirmed the uniform grafting of dendron molecules. In buffer, the rms roughness increased slightly to σ = 6 Å, which is attributed to hydration of the layer. The corresponding data for dendron OEG8 measured in air and buffer are presented in Fig. 1d and e, respectively. It should be noted that the optimized functionalization protocol resulted in much higher film quality than was achieved by simple immersion of the substrate in an aqueous solution. The detailed AFM data are presented in ESI Table S1.†
Internal structure of the dendron layers
The internal structures of dendron OEG monolayers perpendicular to the surface were investigated using high energy specular X-ray reflectivity. The use of high energy X-rays (22 keV) guarantees the transmittance of the beam through bulk water.17,18 Fig. 2a shows the reflectivity curves of the dendron OEG4 (red) and OEG8 (blue) monolayers measured in air. The reflectivity curves, plotted as Rqz4, exhibited features indicating the formation of layered structures with distinct contrast in scattering length density (SLD). The best fit results (solid lines) obtained with a slab model yielded a layer thickness of dendron OEG4 of dOEG4 = 14.6 Å. Despite having additional ethylene glycol units, the thickness of the dendron OEG8 layer was almost the same, dOEG8 = 14.9 Å. This observation is attributed to the collapse of the oligoethylene glycol chains under the osmotic pressure in ambient atmosphere. The SLD of dendron OEG8 was approximately 1.4 times greater than that of dendron OEG4 (Table 1), indicating the compaction of the OEG8 chains.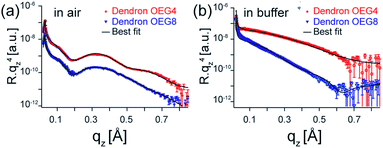 | ||
| Fig. 2 High energy specular X-ray reflectivity (symbols) and best-fit results (lines) of dendron OEG4 (red) and dendron OEG8 (blue) measured (a) in air and (b) in buffer. The data collected in air are fitted with slab models, while those measured in buffer with diffusive interface models (eqn (1)). The structural parameters corresponding to the fits are presented in Tables 1 and 2, confirming the formation of monolayers. | ||
| d [Å] | SLD [10−6 Å−2] | σ [Å] | |
|---|---|---|---|
| Dendron OEG4 | 14.6 | 8.17 | 6.5 |
| Dendron OEG8 | 14.9 | 11.6 | 3.1 |
In contrast, as presented in Fig. 2b, the reflectivity curves measured in buffer exhibited no marked features for either dendron. In buffer, the transition of SLD from the dendron layer to bulk water becomes diffusive, which makes the use of the conventional slab model with Gaussian roughness invalid. In this study, the SLD profile was modeled by a hyperbolic tangent function,
 | (1) |
| d [Å] | ξ | |
|---|---|---|
| Dendron OEG4 | 21.1 | 11.6 |
| Dendron OEG8 | 29.1 | 16.9 |
Mechanical characterization of dendron OEG monolayers
We evaluated the mechanical properties of the dendron monolayers using AFM nanoindentation with a cantilever coupled to a 10 μm SiO2 particle.24 It is well established that AFM indentation data for a thin film on a stiff substrate cannot be treated with a conventional Hertz model with a spherical indenter24 as the film deformation is limited under a high load.25,26 In this study, we assumed a transition function that linearly connects the influence of two elastic layers, the monolayer and the substrate,27,28
 | (2) |
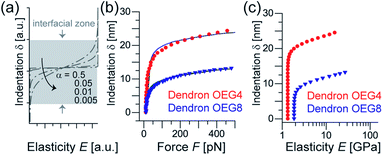 | ||
| Fig. 3 (a) Elasticity profile of an interfacial zone between two phases possessing different levels of elasticity (eqn (2)). Decrease in transition parameter α results in slower transition. (b) Indentation–force relationships for dendron OEG4 (red symbols) and dendron OEG8 (blue symbols) with the best fit results (solid lines). (c) Dependence of Young's modulus of two dendrons as a function of indentation depth. The apparent film elasticity values were determined from the regions where Young's modulus is independent from indentation depth. Interface model. | ||
Platelet adhesion on dendron-coated surfaces
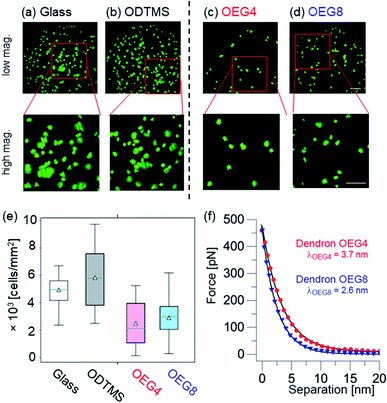
Fig. 4a–d show representative glutaraldehyde-induced fluorescence technique (GIFT)29,30 images of (a) bare glass, (b) glass coated with hydrophobic octadecyltrimethoxysilane (ODTMS), (c) glass coated with dendron OEG4 and (d) glass coated with dendron OEG8, after incubation with platelets. The global appearance of the images suggests less platelet adhesion on the dendron-coated surfaces than on either hydrophilic glass or hydrophobic silane. Moreover, the images at higher magnification (bottom row) suggest that the spreading and hence the activation of platelets is also less pronounced on dendron-coated surfaces. Fig. 4e shows the number of platelets adhered to a 1 mm2 surface, calculated from N > 120 images for each surface. On hydrophilic glass and hydrophobic ODTMS surfaces, we found median values of 5000–6000 cells per mm2. In comparison, the corresponding values on dendron-coated surfaces were significantly lower; 2000–3000 cells per mm2 (p < 0.001). This clearly indicates that the coating of substrates with nanometer-thick dendron monolayers effectively suppresses non-specific adhesion of platelet cells. The data indicated that there were more platelets on dendron OEG8 surfaces than on OEG4, however the difference was less significant (p ≈ 0.02).Rodrigues et al. functionalized Au surfaces with thiol monolayers that contained various fractions of molecules with CH3- and OH-terminal groups.30 They observed the highest and lowest numbers of adherent platelets on pure CH3- and OH-terminated monolayers, respectively. By systematically varying the mixing ratio of the hydrophobic (CH3-terminated) and hydrophilic (OH-terminated) thiols, they concluded that platelet adhesion is highly sensitive to the surface free energy. However, as shown in Fig. 4, the dendron-coated surfaces showed distinctly lower non-specific adhesion than bare glass substrates and substrates coated with hydrophobic ODTMS, suggesting that the cell repellency does not correlate with the surface free energy. Using thiol monolayers terminated with single oligoethylene glycol chains, a more recent study demonstrated that the surface free energy correlates with non-specific adsorption of proteins but not with non-specific cell adhesion.31
To unravel the origin of platelet repellency from the viewpoint of interfacial forces, we analyzed the force-separation curves obtained using an AFM cantilever coupled to a 10 μm SiO2 bead.24 Unlike for the “indentation” analysis presented in Fig. 3, we focused on the region before the probe made the first contact with the surface. Fig. 4f shows force-separation curves for dendron OEG4 and dendron OEG8. It is notable that the detected forces always remain positive, which indicates that the interfacial interaction is predominantly repulsive. The absence of any attractive, negative force was confirmed over the whole surface of each sample. In Fig. 4f, we defined the separation s = 0 as the position at which the interfacial force reached 450 pN because the force curves converge beyond this threshold. The onset of the force increase appears at a distance that is greater than the film thickness obtained by X-ray reflectivity (Table 2), suggesting the presence of a repulsive zone in close proximity to the surface. To estimate how far such repulsion could reach, we fitted the force curves as exponential decay functions and calculated the characteristic decay length λ. Interestingly, the decay length λ of dendron OEG4, λOEG4 = 3.7 nm, was greater than that of OEG8, λOEG8 = 2.6 nm, suggesting that the repulsive force field of the shorter dendron OEG4 extended further than that of the longer dendron OEG8.
The presence of a repulsive layer near the bio-inert surfaces was also reported for Au substrates coated with alkanethiols terminated with linear oligoethylene glycols.31 The origin of the repulsive zone was attributed to a layer of “structured interfacial water”. Despite the qualitative agreement with their finding, the repulsive zone we observed cannot be explained by a layer of structured water. It is widely accepted that linear oligoethylene glycols connected to alkanethiols adopt an ordered conformation, particularly with the aid of attractive interactions between the hydrocarbon chains.32 Conversely, as our dendron molecules are grafted to the oxide surface via bulkier phosphonate tweezers (Fig. 1a), the grafting density of molecules is much lower than for linear ethylene glycols connected to alkanethiols. As the branched ethylene glycol chains are not able to adopt an ordered conformation owing to steric constraints, the dendron surface cannot support the formation of structured interfacial water. A possible candidate for creating the repulsive zone is the entropic force generated by thermally activated conformational dynamics of the OEG chains. In fact, the X-ray reflectivity data suggest that the interface between the dendron monolayer and bulk water is diffusive (Fig. 2b, Table 2).
Nanoscopic force mapping
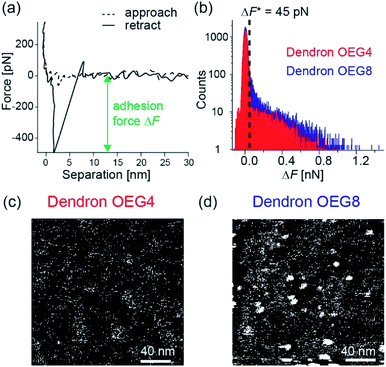
It is notable that platelets still adhere to the dendron-coated surfaces (Fig. 4c and d) despite the repulsive zone near the surface. This suggests the presence of local potential minima (pinning centers) that cause non-specific platelet adhesion. Thus, we extended our understanding of the modulation of coarse-scale interfacial interactions by dendrons to investigate if such local pinning centers exist. We performed fast force mapping experiments at a pixel rate of 200 Hz.33 Fig. 5a shows typical force curves collected from one pixel during the wave-like motion of the cantilever. The broken line is the curve collected during the approach, while the solid line shows the retraction. As indicated in the figure, we defined the difference between the baseline and the force minimum in retraction as the adhesion force. Fig. 5b shows the histograms of adhesion force for dendron OEG4 (red) and dendron OEG8 (blue) and the threshold values of ΔF* = 45 pN indicated by a broken line. Fig. 5c and d are binarized force maps for dendron OEG4 and dendron OEG8, respectively. Here, the pixels with ΔF > 45 pN are labeled white, while the rest are black. The surface coated with dendron OEG4 exhibited pixel noise (Fig. 5c), but distinct, approximately 10 nm spots can be identified on the surface coated with dendron OEG8 (Fig. 5d).It is plausible that 10 nm pinning centers found in the dendron OEG8 monolayer coincide with the regions of lower grafting density but not the defects. In fact, the rms roughness values for dendron OEG4 and dendron OEG8 obtained by tapping mode AFM are comparable (Fig. 1d and e). Moreover, X-ray reflectivity data in buffer (Fig. 2b) indicated no sign of local defects because the beam footprint was much larger than the pinning centers. However, the Young's modulus of the dendron OEG8 monolayer was higher than that of dendron OEG4 (Fig. 3), which appears to reflect the lower grafting density of dendron OEG8. Although the size of the pinning centers detected by nanoscopic fast force mapping was much smaller than silica particles and platelet cells, this appears to explain the higher platelet density observed on the dendron OEG8 surfaces (Fig. 4e). The observation that platelets can detect 10 nm pinning centers while silica particles cannot, is attributed to the difference in the deformability. Lipid membranes surrounding cells possess low bending rigidity κ ∼10kBT (ref. 34) so that cells can adapt their shape to the surrounding environment. In fact, as shown in Fig. 4a–d, platelets adhered to the surface were flattened, and some even exhibited spreading due to activation. Conversely, SiO2 particles are not sensitive to such nanoscopic surface heterogeneities because the deformability of the particle is negligibly small.
Water molecules confined near surfaces have been drawing increasing attention because of their physical characteristics distinct from those in the bulk.35–37 Using frequency modulation AFM, Jarvis and co-workers identified layered water near the surface of crystalline-like, carboxyl-terminated thiol monolayers as oscillatory force signals separated at a distance of ≈0.25 nm.38 Inada et al. took a similar approach on highly ordered monolayers of oligoethylene glycol chains connected to alkanethiols.32 Although they successfully observed highly ordered oligoethylene glycol chains, layered water molecules near the surface were not detected. More recently, Araki et al. used the same technique, and reported the presence of structured water near the surface of monolayers displaying a mosaic of cationic and anionic head groups, but not near CH3- or COOH-terminated surfaces.39 In this study, our force-separation curves exhibited no sign of oscillatory features originating from a structured water layer, suggesting that water molecules near the surfaces were not structured owing to the amorphous nature caused by the bulkier phosphonate anchoring groups, the lack of cohesive hydrocarbon chains, and branches.
Experimental
Materials and sample preparation
Experimental methods
Conclusions
The grafting of dendronized oligoethylene glycols (dendron OEGs) with phosphonate tweezers is a promising approach for assembling highly stable, ultrathin coating materials that suppress the non-specific adhesion of cells. In this study, we carefully optimized the functionalization protocols and systematically investigated the surface and internal film structures by combining tapping mode AFM and high energy specular X-ray reflectivity. The diffusive scattering length density profiles of the nanometer-thick dendron OEG monolayers were modeled with a hyperbolic tangent function instead of commonly used slab models. The Young's modulus of the monolayers was assessed by AFM nanoindentation with a cantilever coupled to a 10 μm SiO2 particle. To account for the limited deformation of ultrathin films under high loads, we used a transition function that linearly connects the elastic properties of monolayers and solid substrates. The statistical analysis of images collected by glutaraldehyde induced fluorescence technique (GIFT) demonstrated that both dendrons, OEG4 and OEG8, significantly suppressed the non-specific adhesion of platelets. To quantify the net force acting on cells near the surface, we measured the force-separation relationships and found repulsive zones with thicknesses of 2–4 nm near the dendron surfaces. High speed (5 ms per pixel) nanoscopic force mapping further demonstrated the presence of nanoscopic defects in the dendron OEG8 monolayers. This finding suggests a lower grafting density than for OEG4, which could explain the difference in film elasticity, thickness of the repulsive zone, and cell repellency between the two dendrons. The combination of different physical techniques over different length scales helped us gain physical insights into how nanometer-thick dendron monolayers modulate the interfacial interactions between cells and oxide surfaces.Author contributions
D. F.-F. and M. T. designed the research. D. V .N. and D. F.-F. synthesized the dendronized molecules, and J. C., W. A., C. H., E. M., O. V. K., T. H., S. K., and M. T. performed the experiments and analyzed the data. J. C., W. A., T. H., and M. T. wrote the manuscript. All authors participated in discussion and manuscript editing.Conflicts of interest
The authors declare that there are no conflicts of interest.Acknowledgements
D. F.-F. and M. T. thank the support from the INTERREG V Upper Rhine Program (NANOTRANSMED). T. H. and M. T. thank JSPS (KAKENHI grant numbers JP20H05210 to T. H., JP19H05719 to M. T.) for support. T. H. is thankful to Heidelberg Alumni Network, and M. T. to the German Science Foundation (SPP2171) and Nakatani Foundation for support. J. C. thanks R. Chang for experimental assistance, and M. T. thanks R. Dahint for helpful comments. We thank S. Dodds from Edanz Group (https://en-author-services.edanz.com/ac) for editing a draft of this manuscript.Notes and references
- Q. A. Pankhurst, J. Connolly, S. K. Jones and J. Dobson, J. Phys. D: Appl. Phys., 2003, 36, R167–R181 CrossRef CAS.
- A.-H. Lu, E. L. Salabas and F. Schüth, Angew. Chem., Int. Ed., 2007, 46, 1222–1244 CrossRef CAS PubMed.
- Y.-W. Jun, J.-H. Lee and J. Cheon, Angew. Chem., Int. Ed., 2008, 47, 5122–5135 CrossRef CAS PubMed.
- A. Jordan, R. Scholz, P. Wust, H. Schirra, S. Thomas, H. Schmidt and R. Felix, J. Magn. Magn. Mater., 1999, 194, 185–196 CrossRef CAS.
- A. Ito, M. Shinkai, H. Honda and T. Kobayashi, J. Biosci. Bioeng., 2005, 100, 1–11 CrossRef CAS PubMed.
- H. Xu, F. Yan, E. E. Monson and R. Kopelman, J. Biomed. Mater. Res., Part A, 2003, 66, 870–879 CrossRef PubMed.
- L. M. Lacava, Z. G. M. Lacava, M. F. Da Silva, O. Silva, S. B. Chaves, R. B. Azevedo, F. Pelegrini, C. Gansau, N. Buske, D. Sabolovic and P. C. Morais, Biophys. J., 2001, 80, 2483–2486 CrossRef CAS PubMed.
- A. K. Gupta and M. Gupta, Biomaterials, 2005, 26, 3995–4021 CrossRef CAS PubMed.
- T. J. Daou, G. Pourroy, J. M. Greneche, A. Bertin, D. Felder-Flesch and S. Begin-Colin, Dalton Trans., 2009, 4442–4449 RSC.
- B. Basly, D. Felder-Flesch, P. Perriat, C. Billotey, J. Taleb, G. Pourroy and S. Begin-Colin, Chem. Commun., 2010, 46, 985–987 RSC.
- D.-V. Nguyen, L. Hugoni, M. Filippi, F. Perton, D. Shi, E. Voirin, L. Power, G. Cotin, M.-P. Krafft, A. Scherberich, P. Lavalle, S. Begin-Colin and D. Felder-Flesch, New J. Chem., 2020, 44, 3206–3214 RSC.
- R. Duncan and L. Izzo, Adv. Drug Delivery Rev., 2005, 57, 2215–2237 CrossRef CAS PubMed.
- T. J. Daou, S. Buathong, D. Ung, B. Donnio, G. Pourroy, D. Guillon and S. Bégin, Sens. Actuators, B, 2007, 126, 159–162 CrossRef CAS.
- C. Boyer, V. Bulmus, P. Priyanto, W. Y. Teoh, R. Amal and T. P. Davis, J. Mater. Chem., 2009, 19, 111–123 RSC.
- T. J. Daou, J. M. Grenèche, G. Pourroy, S. Buathong, A. Derory, C. Ulhaq-Bouillet, B. Donnio, D. Guillon and S. Begin-Colin, Chem. Mater., 2008, 20, 5869–5875 CrossRef CAS.
- E. L. Hanson, J. Schwartz, B. Nickel, N. Koch and M. F. Danisman, J. Am. Chem. Soc., 2003, 125, 16074–16080 CrossRef CAS PubMed.
- T. Schubert, P. C. Seitz, E. Schneck, M. Nakamura, M. Shibakami, S. S. Funari, O. Konovalov and M. Tanaka, J. Phys. Chem. B, 2008, 112, 10041–10044 CrossRef CAS PubMed.
- F. F. Rossetti, E. Schneck, G. Fragneto, O. V. Konovalov and M. Tanaka, Langmuir, 2015, 31, 4473–4480 CrossRef CAS PubMed.
- S. Fisk and B. Widom, J. Chem. Phys., 1969, 50, 3219–3227 CrossRef CAS.
- E. S. Wu and W. W. Webb, J. Chem. Phys., 1973, 8, 2065–2076 CAS.
- K. Binder, J. Chem. Phys., 1983, 79, 6387–6409 CrossRef CAS.
- F. Abelès, J. Phys. Radium, 1950, 11, 307–309 CrossRef.
- L. G. Parratt, Phys. Rev., 1954, 95, 359–369 CrossRef.
- H.-J. Butt, B. Cappella and M. Kappl, Surf. Sci. Rep., 2005, 59, 1–152 CrossRef CAS.
- J. Domke and M. Radmacher, Langmuir, 1998, 14, 3320–3325 CrossRef CAS.
- S. Suresh, Science, 2001, 292, 2447–2451 CrossRef CAS PubMed.
- M. F. Doerner and W. D. Nix, J. Mater. Res., 1986, 1, 601–609 CrossRef.
- H. Shulha, X. Zhai and V. V. Tsukruk, Macromolecules, 2003, 36, 2825–2831 CrossRef CAS.
- R. D. Frank, H. Dresbach, H. Thelen and H. G. Sieberth, J. Biomed. Mater. Res., 2000, 52, 374–381 CrossRef CAS PubMed.
- S. N. Rodrigues, I. C. Gonçalves, M. C. L. Martins, M. A. Barbosa and B. D. Ratner, Biomaterials, 2006, 27, 5357–5367 CrossRef CAS PubMed.
- T. Hayashi, Y. Tanaka, Y. Koide, M. Tanaka and M. Hara, Phys. Chem. Chem. Phys., 2012, 14, 10196–10206 RSC.
- N. Inada, H. Asakawa, Y. Matsumoto and T. Fukuma, Nanotechnology, 2014, 25, 305602 CrossRef CAS PubMed.
- E. A. Mondarte, T. Maekawa, T. Nyu, H. Tahara, G. Lkhamsuren and T. Hayashi, RSC Adv., 2019, 9, 22705–22712 RSC.
- H. P. Duwe and E. Sackmann, Phys. A, 1990, 163, 410–428 CrossRef CAS.
- A. Verdaguer, G. M. Sacha, H. Bluhm and M. Salmeron, Chem. Rev., 2006, 106, 1478–1510 CrossRef CAS PubMed.
- T. A. Pascal, W. A. Goddard and Y. Jung, Proc. Natl. Acad. Sci., 2011, 108, 11794–11798 CrossRef CAS PubMed.
- W. Abuillan, A. S. Becker, B. Demé, T. Homma, H. Isobe, K. Harano, E. Nakamura and M. Tanaka, J. Am. Chem. Soc., 2018, 140, 11261–11266 CrossRef CAS PubMed.
- T. Uchihashi, M. Higgins, Y. Nakayama, J. E. Sader and S. P. Jarvis, Nanotechnol, 2005, 16, S49–S53 CrossRef CAS.
- Y. Araki, T. Sekine, R. Chang, T. Hayashi and H. Onishi, RSC Adv., 2018, 8, 24660–24664 RSC.
- L. Névot and P. Croce, Rev. Phys. Appl., 1980, 15, 761–779 CrossRef.
- J. L. Hutter and J. Bechhoefer, Rev. Sci. Instrum., 1993, 64, 1868–1873 CrossRef CAS.
Footnotes |
| † Electronic supplementary information (ESI) available. See DOI: 10.1039/d1ra02571f |
| ‡ Equal contributors. |
| This journal is © The Royal Society of Chemistry 2021 |

