
 Open Access Article
 This Open Access Article is licensed under a Creative Commons Attribution-Non Commercial 3.0 Unported Licence
Determination of folic acid by capillary zone electrophoresis with indirect chemiluminescence detection†
Tangjuan Zhao,
Huaping Lin,
Nan Li,
Hongmei Shi,
Weijun Kang and
Xiangdong Xu*
and
Xiangdong Xu*
Hebei Key Laboratory of Environment and Human Health, School of Public Health, Hebei Medical University, Shijiazhuang, 050017, PR China. E-mail: xuxd@hebmu.edu.cn
First published on 4th June 2021
Abstract
A capillary electrophoresis method with on-line inhibited chemiluminescence (CL) detection was first used to determine folic acid (FA). This method was established based on the quenching effect of FA on the CL reaction of luminol with a Ag(III) complex in alkaline medium. The separation was conducted with a 20.0 mM sodium borate buffer containing 1.0 mmol L−1 luminol. Under optimized conditions, FA was baseline separated and detected in less than 10 min. The limit of detection of FA was 1.3 mg L−1, with a linear range of 5.0–150.0 mg L−1 (r = 0.9953). The RSD value was 2.8% for intra-day precision and 5.4% inter-day precision. The recoveries of the standard addition of tablets and human urine ranged from 90.3% to 107.5% and from 82.0 to 105.7%, respectively. The proposed method was successfully applied to determine FA contents in commercial pharmaceutical tablets and human urine samples. Results suggested that this method was simple and robust.
1. Introduction
Folic acid (FA) or N-[4-[[(2-amino-1,4-dihydro-4-oxo-6-pteridinyl)methyl]- amino]-benzoyl]-L-glutamic acid (Fig. 1) is a water-soluble B vitamin essential to the human body. FA is naturally found in leafy vegetables, yeast, and some fruits. Its deficiency is associated with many health problems, including megaloblastic anemia, fetal neural tube defects, high homocysteine content, sepsis, prostate cancer, and so on.1,2 The concentration of FA in the blood of human cancer patients, especially in precancerous patients, is reportedly lower than in healthy individuals.3 Therefore, developing a simple, rapid, and effective method of detecting FA present in tablets and biological samples is necessary.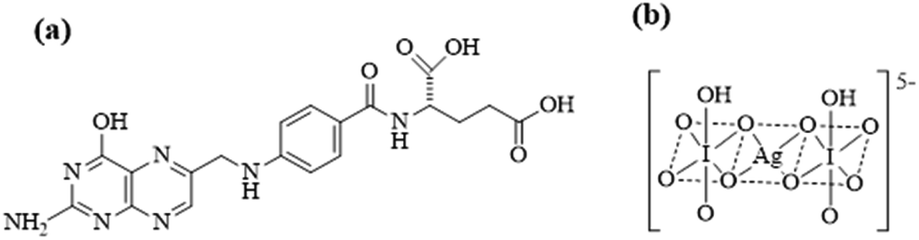 | ||
| Fig. 1 Chemical structure of (a) folic acid and (b) Ag(III) complex. | ||
In recent years, several methods employed for FA determination have been reported, including molecular imprinting sensor,4,5 high-performance liquid chromatography (HPLC),6–9 capillary electrophoresis,10,11 flow-injection analysis (FIA),12,13 enzyme-linked immunosorbent assay (ELISA),14 chemiluminescence (CL)15 and spectrophotometry.16–19 Compared with conventional HPLC and ELISA methods, capillary electrophoresis (CE) is characterized by higher resolution and fewer samples and is a powerful tool in clinical diagnosis, as well as environmental and food analyses.20–23 Chemiluminescence (CL) detection is a simple analytical instrument for FIA, HPLC, and CE because the absence of a light source in CL detectors significantly reduces noise and eliminates Rayleigh and Raman scattering. The low limits of detections (LODs) and wide linear range of CL detector are comparable to laser-induced fluorescence. Still, the cost is much lower, rendering CE–CL an alternative to sensitive detection.
In our previous study, we demonstrated for the first time that the oxidation of luminol by the Ag(III) complex could generate CL in alkaline media.24 CE coupled with an Ag(III) complex–luminol system has been successfully used to determine EP, NE, and DA in urine samples from healthy individuals and pheochromocytoma patients.25 The use of the Ag(III) complex as an oxidant in CE–CL has not yet been extensively explored despite its essential advantages. On the one hand, the complex is a rather powerful oxidizing agent (oxidation potential = 1.74 V) with a fast reaction rate; thus, the CE–CL configuration is simple and provides sharp peaks. On the other hand, current loss (caused by air bubbles formed in the H2O2–luminol reaction) is not a problem. The formation of bubbles could cause unstable electrophoretic currents resulting in an unstable CL electropherogram baseline, thereby reducing separation efficiency and increasing noise.
The reaction of luminol with Ag(III) complex produces an intense CL emission, so that the analytes can have two effects: enhancement or inhibition of CL emission. The derivatization of non-CL analytes prior to detection is generally required because few chemicals show natural CL characteristics. However, derivatization processes are often tedious and time-consuming. In addition, the quantitative labeling of the low-concentration analyte is also difficult. Alternatively, if a non-CL analyte interfere with or suppress a CL reaction, the analyte can be indirectly detected as an inverted peak where the CL intensity decreases from a normally high background. We call this process indirect CL detection. Some CE-indirect CL methods have been developed for the determination of amino acids, catecholamines, polyphenols, 5-hydroxyindoleacetic acids, and 5-hydroxytryptamine.26–29
In the present work, a rapid, simple, and sensitive CE-indirect CL detection was used to determine FA in commercial pharmaceutical tablets and human urine based on the quenching effect of FA on the CL reaction of luminol with Ag(III) complex in alkaline medium. The conditions for the CL reaction and electrophoresis were investigated in detail using an Ag(III) complex–luminol system. The determination of FA concentration in commercial pharmaceutical tablets and human urine samples was investigated as an application example for the proposed CE–CL system.
2. Experimental
2.1. Chemicals and reagents
All reagents used in the experiment were of analytical grade unless otherwise mentioned. FA (Fig. 1a) was obtained from the Chinese Food and Drug Inspection Institute (Beijing, China). AgNO3, KIO4, K2S2O8, KOH, hydrochloric acid, sodium metabisulphite, sodium borate, and EDTA were obtained from Beijing Chemical Reagent Company (Beijing, China). Luminol was purchased from TCI Shanghai (Shanghai, China). Ag(III) stock solution was prepared in accordance with a previously described method.19 Experimental water was ultrapure water.2.2. Preparation of standard solutions and CL solutions
Stock solutions (1.0 mg mL−1) of FA were prepared by dissolving 10 mg of FA in 10 mL of water. A 20 mM luminol solution was prepared by dissolving 0.8860 g of luminol in 7.00 mL of 1 M NaOH followed by dilution with water to 250 mL. A 0.1 M sodium borate stock solution was prepared by dissolving 3.814 g of Na2B4O7·10H2O in 100 mL of water. Bis(hydrogenperiodato)argentate(III) complex anion [Ag(HIO6)2]5− was synthesized according to a previously described procedure.30 Chemical structure of Ag(III) complex was shown in Fig. 1b. The electronic spectrum of the Ag(III) complex in an aqueous solution showed two absorption bands at 362 and 253 nm, in excellent agreement with previously reported results.31 Stock solutions of the Ag(III) complex were prepared fresh daily from the solid-state compound, and concentration was determined spectrophotometrically at 362 nm using molar absorptivity ε = 1.26 × 10⁴ M−1 cm−1.30 Working solutions were freshly prepared by diluting standard stock solutions with ultrapure water. All solutions were refrigerated at 4 °C.2.3. Laboratory-built CE–CL system
All experiments were performed with a laboratory-built CE–CL system. The device consisted of a high-voltage source that supplied up to 30 kV (Tianjin Dongwen High Voltage Power Supply Limited Company, Tianjin, China), two platinum electrodes (the anode or high-voltage electrode at the inlet, and the cathode or ground electrode at the outlet), a photomultiplier tube (Binsong, Beijing, China) that collected the CL emission, and a PEEK three-way connector with an inner diameter (i.d.) of 600 μm (Keshi Scientific, Xiamen, China) that connected the separation, reagent, and reaction capillaries (Fig. 2). Uncoated fused silica capillaries 65 cm × 50 μm i.d. were used for the separation. The 6 cm end section of the capillary coated with polyimide was burned and moved. The separation capillary was etched with hydrofluoric acid for 40 min to 50 min and then inserted into a reaction capillary with a diameter of 530 μm. The separation capillary, reaction capillary, and reagent capillary were held by a three-way Plexiglass apparatus. The Ag(III) solution was delivered by gravity to the detection window by burning 5 mm of the polyimide of the reaction capillary and then placed before the photomultiplier tube (PMT). The luminol and Ag(III) complex were mixed in front of the PMT to produce CL, the CL signal was amplified in the PMT, and the photocurrent was recorded using data acquisition software (Qianpu Software Ltd., Shanghai, China). The entire CL detection system was prepared in an opaque box to avoid the effects of external light. | ||
| Fig. 2 High-performance capillary electrophoresis chemiluminescence apparatus. | ||
2.4. Electrophoresis
Before first use, the capillary was conditioned by flushing with 1 M NaOH for 30 min followed by water for 20 min. At the beginning of each day, the capillary was sequentially rinsed using a syringe containing 0.1 M NaOH, 0.1 M HCl, and doubly distilled water; each rinse lasted 10 min. The separation capillary was then equilibrated with the migration buffer for 20 min in pressure mode. The reagent capillary was first filled with the Ag(III) complex solution using a syringe. During electrophoresis, the reservoir containing the Ag(III) complex solution was placed 20 cm above the reaction capillary outlet to continuously deliver the Ag(III) complex solution by gravity. Luminol was added to the running buffer and introduced into the separation capillary by electroosmotic flow. The sample solutions were introduced at the cathode by gravity for 10 s from a height of 40 cm. After separation by capillary electrophoresis, the analyte zones were determined by indirect CL of luminol–Ag(III) complex. FA was quantified by measuring the net CL intensity ΔI = I0 − Ii, where I0 was the CL background intensity of the luminol–Ag(III) complex reaction, and Ii was the CL intensity of the analyte.2.5. Sample preparation
Commercial pharmaceutical FA tablets (mark content 0.4 mg per each piece) were purchased from a pharmacy. Ten tablets were weighed and ground into powder. The powder was dissolved in 5 mL of 0.01 mol L−1 NaOH, and the volume was adjusted to 10 mL by adding water. The solution was shaken for 30 min and filtered through a 0.22 μm syringe filter before CE separation.Fresh human urine samples were obtained from different volunteers. FA was extracted from the biological samples using an SCX cartridge (200 mg, 3 mL, Simon, Germany). The cleanup process was as follows: (1) the SPE Cartridge was conditioned with 2.0 mL of methanol and 2.0 mL of water before use; (2) urine (1.0 mL) was slowly loaded into the conditioned cartridge; (3) the cartridge was then washed with 1 mL of 5% methanol; and (4) FA was eluted with 1 mL of a solution containing ammonia: methanol (10![[thin space (1/6-em)]](https://www.rsc.org/images/entities/char_2009.gif) :90, v/v). This extract was dried with nitrogen and dissolved in 1 mL of 0.005 mol L−1 NaOH.
:90, v/v). This extract was dried with nitrogen and dissolved in 1 mL of 0.005 mol L−1 NaOH.
Spiked samples were prepared by adding the specific volume of standard solutions of FA to the FA tablets samples and fresh human urine samples and then repeated the above procedures.
3. Results and discussion
3.1. Effect of FA on CL intensity
The Ag(III) complex–luminol system could generate a stable CL intensity in alkaline condition, while FA significantly inhibits the CL. In the experiment, 100 mg L−1 of FA was analyzed, and its CL signal was obtained within 10 min (Fig. 3).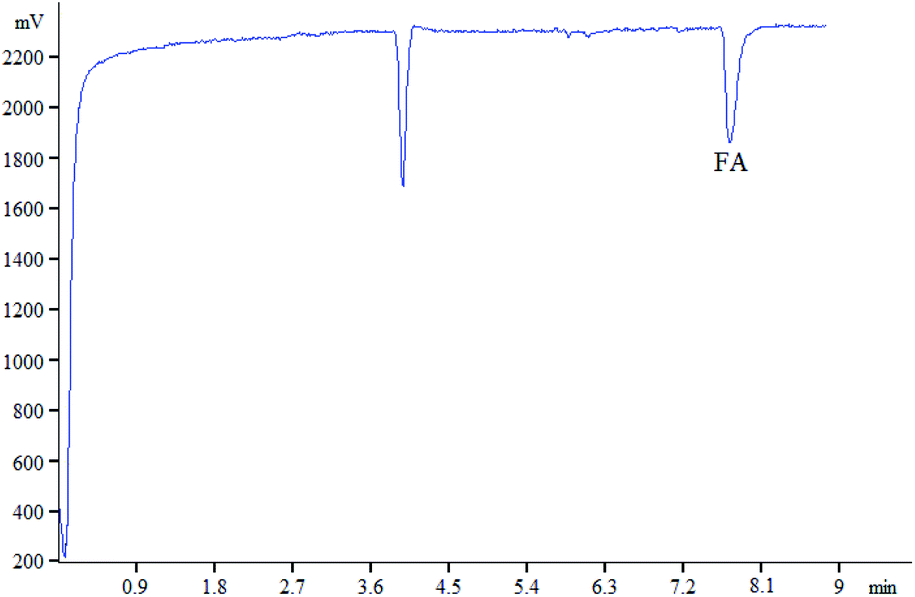 | ||
| Fig. 3 Electrophergram of substance to be tested. (Condition: 65 cm × 50 μm i.d. fused silica; applied voltage:18 kV; injection time:15 S; CAg(III) = 5.0 × 10⁻⁵ mol L−1 in 0.01 mol L−1 NaOH; Cluminol = 2 mmol L−1 in 5 mmol L−1 sodium tetraborate; FA: 100 mg L−1). | ||
3.2. CL condition selection
The effects of the luminol concentration ranging from 1 × 10⁻³ mol L−1 to 4 × 10⁻³ mol L−1 were evaluated. The results were shown in Fig. 4. As the concentration of luminol increased, the CL intensity also increased; by contrast, the signal reached the maximum when the luminol concentration reached 2.5 × 10⁻³ mol L−1. Therefore, the optimum luminol concentration was 2.5 × 10⁻³ mol L−1.
 | ||
| Fig. 4 Effect of the concentration of luminol on CL intensity. (Condition: 65 cm × 50 μm i.d. fused silica; applied voltage: 18 kV; injection time:15 S; CAg(III) = 5.0 × 10⁻⁵ mol L−1 in 0.03 mol L−1 NaOH; luminol in 5 mmol L−1 sodium tetraborate; FA: 100 mg L−1). | ||
The effect of Ag(III) concentration ranging from 1.0 × 10⁻⁵ mol L−1 to 1.0 × 10⁻⁴ mol L−1 on the CL intensity was investigated (Fig. 5). As the concentration of Ag(III) increased, the CL intensity initially increased and then decreased. The maximum CL intensity was obtained when the concentration was 5.0 × 10⁻⁵ mol L−1. Therefore, the optimum concentration of Ag(III) was 5.0 × 10⁻⁵ mol L−1.
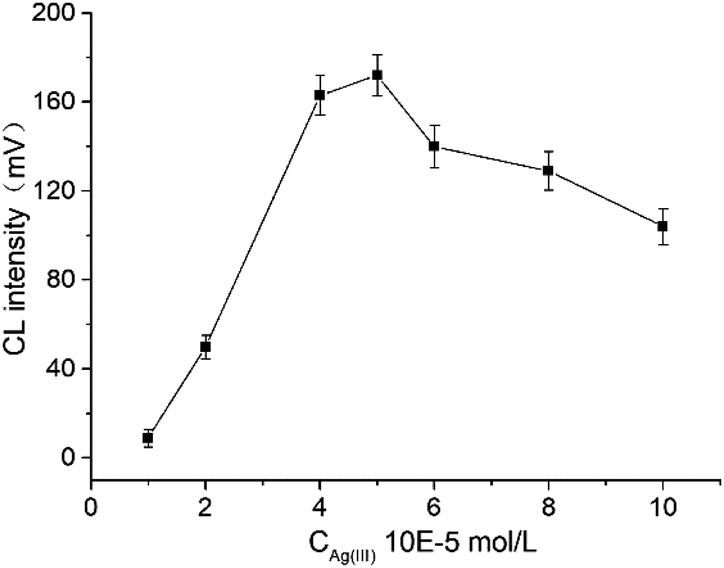 | ||
| Fig. 5 Effect of the concentration of Ag(III) on CL intensity. (Condition: 65 cm × 50 μm i.d. fused silica; applied voltage: 18 kV; injection time: 15 S; Ag(III) in 0.03 mol L−1 NaOH; Cluminol = 2 mmol L−1 in 5 mmol L−1 sodium tetraborate; FA:100 mg L−1). | ||
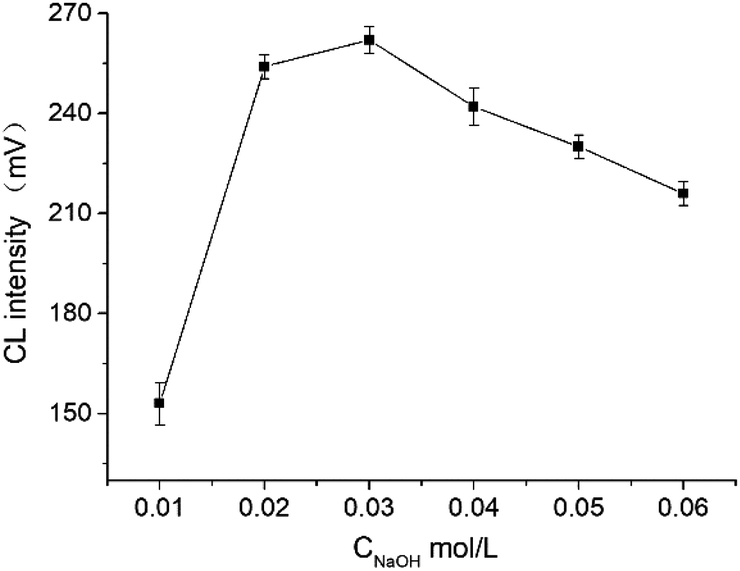 | ||
| Fig. 6 Effect of the concentration of NaOH in Ag(III) solution. (Condition: 65 cm × 50 μm i.d. fused silica; applied voltage: 13 kV; injection time: 15 S; CAg(III) = 5 × 10⁻⁵ mol L−1; Cluminol = 2.5 mmol L−1 in 5 mmol L−1 sodium tetraborate; FA: 100 mg L−1). | ||
3.3. Separation condition selection
In the study, the influence of borax concentration ranging from 1 × 10⁻³ mol L−1 to 15 × 10−3 mol L−1 on CL intensity was investigated. Results indicated that the CL intensity was enhanced as the borax concentration increased from 1 × 10⁻³ mol L−1 to 5 × 10⁻³ mol L−1. By contrast, the CL intensity decreased when the borax concentration exceeded 5 × 10⁻³ mol L−1. Therefore, 5 × 10⁻³ mol L−1 borax was selected for further experiments.
3.4. Optimization of injection time
Injection time is an important factor in separation process. The effect of injection time on the CL intensity was investigated from 8–25 s. The signal intensity of the analyte gradually increased with the increase of injection time up to 20 s. With the extension of injection time, the signal intensity of analyte and the separation efficiency had no improvement, and the peak width would broaden. According to the experimental results, the optimum injection time was determined as 20 s.3.5. Linearity, LOD, and precision
Under the above conditions, the concentration of FA showed a good linear relationship between 5 mg L−1 and 150 mg L−1. The linear regression equation was y = 3.5051x + 9.916 with a correlation coefficient (r) of 0.9953, where y was the peak area and x was concentration. LOD was determined as the concentration at the signal-to-noise ratios (S/N) of 3 times was 1.3 mg L−1. The precision of the method was investigated by intra-day and inter-day relative standard deviations (RSDs), which were evaluated via analyzing a standard solution of FA in eleven injections on the same day and three consecutive days, respectively. The RSD value was 2.8% for intra-day precision and 5.4% inter-day precision.3.6. Application in actual sample
The established method was applied for the detection of FA in commercial pharmaceutical FA tablets purchased from a local pharmacy (Shijiazhuang, China) and human urine. Urine samples were collected from healthy volunteers from Hebei Medical University and from the First Hospital of Hebei Medical University. All experiments were performed in accordance with relevant laws and institutional guidelines. Experiments were approved by the ethics committee at Hebei Medical University. Informed consents were obtained from human participants of this study.FA tablets were analyzed in parallel six times, and the results were summarized in Table 1. The method was compared with the HPLC method in “Standard Methods of Chinese Pharmacopoeia” for the detection of FA. Then, t-test was performed based on the results of the two methods. No significant difference (p > 0.05) between the determination results of the two methods was found, indicating that the proposed CE–CL method was simple and reliable. Moreover, the proposed method required a small amount of sample and fewer reagents, which showed environmental friendliness.
| Times | CE-CL (mg L−1) | HPLC (mg L−1) | p-Value |
|---|---|---|---|
| 1 | 39.96 | 40.33 | 0.851 |
| 2 | 41.39 | 40.32 | |
| 3 | 40.82 | 40.39 | |
| 4 | 40.53 | 40.36 | |
| 5 | 39.68 | 40.38 | |
| 6 | 39.40 | 40.37 | |
| Average | 40.30 | 40.36 |
The method was used to determine FA in human urine samples to verify the applicability of the method to detect FA in complex biological samples. In Fig. 7a, when urine samples were directly injected for determination without purification, a large number of interference peaks appeared around the retention time of FA, which made it impossible to analyze FA accurately. So, the urine samples were purified through solid-phase extraction because of the complex components of human urine (Fig. 7b and c). The matrix of human urine had an inhibitory effect on the CL intensity in the indirect detection, whereas the influence was not observed in the separation of standard solutions. Therefore, the correction of matrix inhibition was necessary. After the correction of matrix inhibition, Fig. 7b and c show the typical electropherograms of the blank human urine and spiked human urine. Fig. 7b shows that no FA signal was found in blank human urine for the concentration was lower than the limit of detection. In Fig. 7c, no interference peaks were observed within the retention time window, which indicated the proposed method was accurate and reliable. The urine of fourteen pregnant women who took 400 μg of FA daily for 21 consecutive days was analyzed using the established method. The concentration of FA in urine before FA supplementation and after FA supplementation are shown in Table 2. The results showed that after intaking FA continuously, the content of FA in pregnant women increased to varying degrees, except for sample 6. Pregnant women could gain FA from FA tablets.
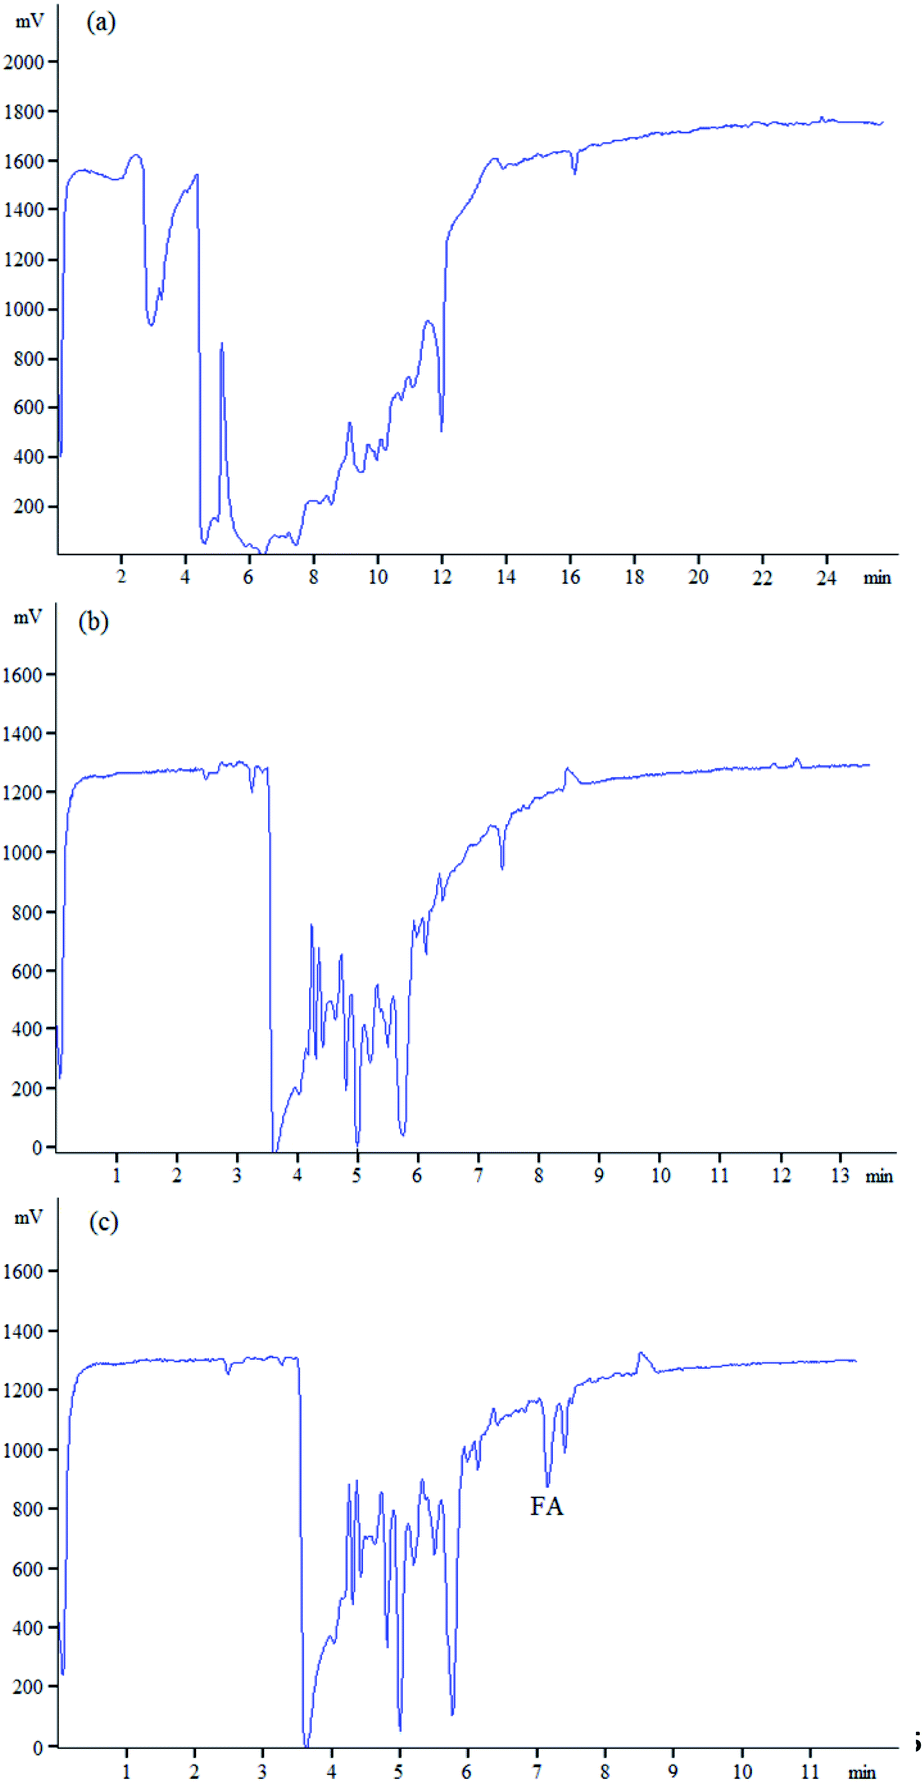 | ||
| Fig. 7 Electropherograms obtained (a) from urine sample without SPE, (b) from urine sample, and (c) from the sample spiked with FA at 44 mg L−1 after SPE procedure. | ||
| Samples | Initial (mg L−1) | Spiked (mg L−1) | Found (mg L−1) | Recovery (%) | RSD (%) |
|---|---|---|---|---|---|
| a n.d., not detected or lower than limits of detection. | |||||
| FA tablets (n = 3) | 41.7 | 8 | 50.3 | 107.5 | 1.2 |
| 41.7 | 20 | 61.0 | 96.5 | 5.2 | |
| 41.7 | 32 | 70.6 | 90.3 | 3.0 | |
| Urine (n = 3) | n.d.a | 44 | 46.53 | 105.7 | 4.2 |
| n.d. | 77 | 68.78 | 89.3 | 6.8 | |
| n.d. | 110 | 90.18 | 82.0 | 8.4 | |
To further evaluate the accuracy of the proposed method, recovery experiments were performed by analysis of the spiked samples at three concentration levels (low, medium, and high) in three replicates. As shown in Table 3, the spiked recoveries of the standard addition of tablets and human urine were in the range of 90.3–107.5%, with RSD values varying from 1.2% to 5.2% and in the range of 82.0–105.7% with RSD values varying from 4.2% to 8.4%, respectively. The developed method was compared with other detection methods reported for the determination of FA (Table S1†). It was indicating that the proposed method enables accurate and reliable analysis of FA in Tablets samples and complex biological samples.
| Sample | Before intake of FA (FA, mg L−1) | After intake of FA (FA, mg L−1) | Sample | Before intake of FA (FA, mg L−1) | After intake of FA (FA, mg L−1) |
|---|---|---|---|---|---|
| 1 | 0.807 | 0.862 | 8 | 0.507 | 0.783 |
| 2 | 0.572 | 0.951 | 9 | 0.721 | 0.830 |
| 3 | 0.926 | 1.070 | 10 | 0.682 | 0.955 |
| 4 | 0.906 | 1.301 | 11 | 0.831 | 1.168 |
| 5 | 0.706 | 1.158 | 12 | 1.046 | 1.141 |
| 6 | 1.027 | 0.962 | 13 | 1.184 | 1.273 |
| 7 | 0.642 | 1.324 | 14 | 0.443 | 0.725 |
4. Conclusion
In this study, CE coupled with an Ag(III) complex–luminol system was established. The application of the CE–CL method for the analysis of FA in tablets and human urine shortened the analysis time and provided a satisfactory detection efficiency. Under the optimized conditions, satisfactory results, including good linearities, low LOD, high precision, and high spiked recoveries, were obtained, which exhibited the great promise of the CL method in actual sample analysis. Moreover, the established method also showed the advantages of economic and environmental friendliness. As a whole, the developed CE–CL method could be a reliable alternative for better application in FA determination from other complex biological samples.Conflicts of interest
There are no conflicts to declare.Acknowledgements
This work was financially supported by the Natural Science Foundation of China (No. 81402723), the Natural Science Foundation of Hebei Province (No. H2018206279, H2020206516, 19977719D), Specific Project for Winter Olympics Games (No. 19977719D). The Youth Foundation of Hebei Educational Committee (No. QN2020129), and the Young Science and Technological Innovation Talents Support and Cultivation Plan of Hebei Medical University (No. TJZR202004).References
- S. E. Vollset, R. Clarke, S. Lewington, M. Ebbing, J. Halsey, E. Lonn, J. Armitage, J. E. Manson, G. J. Hankey, J. D. Spence, P. Galan, K. H. Bønaa, R. Jamison, J. M. Gaziano, P. Guarino, J. A. Baron, R. F. A. Logan, E. L. Giovannucci, M. Heijer, P. M. Ueland, D. Bennett, R. Collins and R. Peto, Lancet, 2013, 381, 1029–1036 CrossRef CAS.
- V. Tarlaulikar and S. Arulkumaran, Obstet. Gynaecol. Reprod. Med., 2013, 23, 286–288 CrossRef.
- S. J. Duthie, J. Inherit. Metab. Dis., 2011, 34(1), 101–109 CrossRef CAS PubMed.
- C. Y. Li, Q. Yang, X. Y. Wang, M. Arabi, H. L. Peng, J. H. Li, H. Xiong and L. X. Chen, Food Chem., 2020, 319, 126575 CrossRef CAS PubMed.
- Q. Yang, C. Y. Li, J. H. Li, X. Y. Wang, M. Arabi, H. P. Peng, H. Xiong and L. X. Chen, Nanoscale, 2020, 12(11), 6529–6536 RSC.
- A. Heydari, M. R. Vardast and S. Yeganeh Zare, Urmia. Med. J., 2015, 25(12), 1102–1111 Search PubMed.
- E. M. Tornero, A. E. Mansilla and I. D. Merás, Microchem. J., 2017, 133, 333–345 CrossRef.
- A. Mahato, S. Vyas and N. S. Chatterjee, J. AOAC Int., 2020, 103(1), 73–77 CrossRef PubMed.
- R. Amidžić, J. S. Brborić, O. A. Čudina and S. Vladimirov, J. Serb. Chem. Soc., 2005, 70(10), 1229–1235 CrossRef.
- Z. Szakács and B. Noszál, Electrophoresis, 2006, 27(17), 3399–3409 CrossRef PubMed.
- S. L. Zhao, H. Y. Yuan, C. Xie and D. Xiao, J. Chromatogr. A, 2006, 1107(1–2), 290–293 CrossRef CAS PubMed.
- Z. Q. Zhang and Y. Tang, Anal. Bioanal. Chem., 2005, 381(4), 932–936 CrossRef CAS PubMed.
- S. M. Wabaidur, S. M. z Alam, S. H. Lee, Z. A. Alothman and G. E. Eldesoky, Spectrochim. Acta A, 2013, 105, 412–417 CrossRef CAS PubMed.
- N. Paksoy, S. Kiliç Altun and H. Durmaz, S. Afr. J. Anim. Sci., 2018, 48(6), 1110–1114 CAS.
- S. H. Zhao, P. P. Zhang, X. H. Liang, D. L. Hua, T. S. Ma and G. L. Pei, J. Food Sci., 2012, 77(1), C102–C106 CrossRef CAS PubMed.
- A. Pathak and S. J. Rajput, Indian J. Pharm. Sci., 2008, 70, 513 CrossRef CAS PubMed.
- M. V. de Moura Ribeiro, I. da Silva Melo, F. das Chagas da Costa Lopes and G. C. Moita, Braz. J. Pharm. Sci., 2016, 52(4), 741–750 CrossRef.
- R. Gürkan and N. Altunay, Food Addit. Contam. A, 2016, 33(7), 1127–1138 CrossRef PubMed.
- F. J. Aberásturi, A. I. Jiménez, J. J. Arias and F. Jiménez, Anal. Lett., 2002, 35(10), 1677–1691 CrossRef.
- F. J. Lara, A. M. García-Campaña and A. I. Velasco, Electrophoresis, 2010, 31(12), 1998–2027 CrossRef CAS PubMed.
- S. S. Zhao, X. Zhong, C. Tie and D. D. Chen, Proteomics, 2012, 12(19–20), 2991–3012 CrossRef CAS PubMed.
- V. Poinsot, V. Ong-Meang, P. Gavard and F. Couderc, Electrophoresis, 2014, 35(1), 50–68 CrossRef CAS PubMed.
- S. X. Yang, S. Y. Ma, K. L. Zhu, M. L. Wang, J. H. Li, M. Arabi, H. T. Liu, Y. Li and L. X. Chen, J. Food Compos. Anal., 2020, 88, 103462 CrossRef CAS.
- H. Shi, X. Xu, Y. Ding, S. Liu, L. Li and W. Kang, Anal. Biochem., 2009, 387(2), 178–183 CrossRef CAS PubMed.
- X. Xu, H. Zhang, H. Shi, C. Ma, B. Cong and W. Kang, Anal. Biochem., 2012, 427(1), 10–17 CrossRef CAS PubMed.
- S. Y. Liao and C. W. Whang, J. Chromatogr. A, 1996, 736(1–2), 247–254 CrossRef CAS.
- Y. Hu, X. Li and Z. Pang, J. Chromatogr. A, 2005, 1091(1–2), 194–198 CrossRef CAS PubMed.
- X. D. Xu, Y. G. Hu and Z. Y. Yang, Chin. Chem. Lett., 2006, 17(7), 925–928 CAS.
- L. Zhang, Y. Zhao, J. Huang and S. Zhao, J. Chromatogr. B, 2014, 967, 190–194 CrossRef CAS PubMed.
- M. A. Raggi, C. Sabbioni, G. Casamenti, G. Gerra, N. Calonghi and L. Masotti, J. Chromatogr. B, 1999, 730(2), 201–211 CrossRef CAS.
- A. Blikungeri, M. Pelletier and D. Monnier, Inorg. Chim. Acta, 1977, 22, 7–14 CrossRef.
Footnote |
| † Electronic supplementary information (ESI) available. See DOI: 10.1039/d1ra02502c |
| This journal is © The Royal Society of Chemistry 2021 |