 Open Access Article
Effects of gallic acid combined with epsilon-polylysine hydrochloride incorporated in a pullulan–CMC edible coating on the storage quality of sea bass
Qiuying Li *a,
Jingyang Zhanga,
Jinshuai Zhua,
Hong Linc,
Tong Suna and
Lei Cheng*b
aCollege of Food Science and Engineering, Bohai University, National & Local Joint Engineering Research Center of Storage, Processing and Safety Control Technology for Fresh Agricultural and Aquatic Products, Jinzhou, Liaoning 121013, China. E-mail: liqiuying21@163.com
bBeijing Engineering and Technology Research Center of Food Additives, Beijing Technology & Business University (BTBU), Beijing 100048, China. E-mail: chenglei@btbu.edu.cn
cCollege of Food Science and Engineering, Ocean University of China, Qingdao, Shandong 266100, China
First published on 3rd September 2021
Abstract
The effects of edbile coatings, based on pullulan and sodium carboxymethylcellulose (PUL–CMC) with gallic acid (GA) and/or ε-polylysine hydrochloride (PL), on the quality of sea bass (Lateolabrax maculatus) fillets during storage at 4 °C for 20 days were assessed in this study. Total viable counts (TVC), thiobarbituric acid (TBA), pH value, total volatile basic nitrogen (TVB-N), water holding capacity (WHC), water migration, texture profiles, and electronic nose results were measured at five day intervals. The results showed that treatments with PUL–CMC–GA, PUL–CMC–PL, and PUL–CMC–GA–PL coatings retarded the increase of the TVC, TBA, pH, and TVB-N value when compared with the results of the control group. These coatings significantly maintained the content of immobile water, WHC, texture and flavor properties of the fish. In addition, use of PUL–CMC–GA–PL was more effective than use of PUL–CMC–GA and PUL–CMC–PL. The TVC, TVB-N, and pH in the PUL–CMC–GA–PL group were all lower than those in the other groups during the whole storage time. The TBA value in the PUL–CMC–GA–PL group remained below 0.7 mg malonaldehyde (MDA) per kg at 20 d, which was extended by 10 d when compared with the values for the other groups. The WHC in PUL–CMC–GA–PL only decreased by 6.53% during 20 d of storage. The results indicated that GA combined with PL had a synergistic effect on improving the preservation properties of PUL–CMC, which could inhibit lipid oxidation, protein degradation and microbial growth, and maintain better texture characteristics during the storage of sea bass fillets.
1 Introduction
Sea bass (Lateolabrax maculatus), is an important fish in the economy of China, and is widely cultivated with large numbers produced. Sea bass is popular with consumers due to its high-quality protein, low-fat content, mild taste, and pleasant flavor.1 However, fresh sea bass is highly perishable, even if stored in refrigerated conditions, and this is caused by microbial activity and endogenous enzymes leading to lipid oxidation, protein degradation, and flavor deterioration.2 In order to reduce the economic losses and ensure food safety, more effective preservation methods are required to be developed, in combination with refrigerated storage, to extend shelf-life and maintain the quality of the sea bass.Edible coatings based on biodegradable and edible biopolymers (polysaccharides, proteins and lipids) have been widely used to improve the quality of various food products during storage due to their high efficiency, safety and eco-friendliness.3 The coatings can be formed by spraying, spreading, or dipping, and they then form a barrier over the food surface after drying.4 This barrier prevents both moisture and oxygen migration and is beneficial for food storage.5,6 It is beneficial to improving the properties of coatings by combining multiple polymers.4 Moreover, some antibacterial and antioxidant components are often added into the coating to further enhance the properties of edible coatings used for preservation.5,7–9 At present, edible coatings have been widely used in many foods, such as fruits, vegetables, meats, fish, cheese and so on.5,10–12 In previous reports, edible coatings based on polysaccharides such as chitosan, alginate, pectin, and pullulan (PUL), as well as proteins such as gelatin, soy protein isolate, whey protein isolate, wheat gluten, and collagen, have been applied to preserve a variety of fish and fishery products.4,13 Furthermore, nisin, ε-polylysine (PL), lactoperoxidase, plant extracts (e.g., grape seed extract, tea polyphenols and licorice extract) as well as various essential oils, all with antimicrobial and antioxidative properties, have been used to prepare edible coatings for fish.2,4,13 The results from these reports showed that use of edible coatings successfully maintained fish quality and resulted in an extension of product shelf-life.
PUL is a water-soluble and neutral polysaccharide which is an extracellular polysaccharide produced by the fungi Aureobasidium pullulans and A. melanogenum.14 It has been exploited as a coating material due to its good film forming abilities, and its nontoxic, biodegradable, and biocompatible properties.15 After drying, PUL films possess the advantages of an excellent oxygen barrier, flexibility, and no flavor or aroma, which make them an ideal material for food preservation.16 However, the hydrophilic performance of PUL significantly reduces the mechanical strength of the PUL film under high relative humidity, and thus it is necessary to blend PUL with other polymers to improve its mechanical properties.15 Sodium carboxymethylcellulose (CMC), an ether derivative of cellulose, is a type of nontoxic, biocompatible, biodegradable, and rigid material.17 Because of its excellent film forming properties, CMC has been widely applied for food packaging.18–20 The CMC is water soluble and is compatible with PUL so they can be blended to form a composite coating. Furthermore, hydrogen bonds formed between the COO− groups of CMC and the OH groups of PUL, and this may be responsible for synergistic enhancement of the material properties of the resulting film.21
Gallic acid (GA, 3,4,5-trihydroxybenzoic acid) is a natural phenolic acid, which is widely used in the food, drug, and cosmetics industries because of its excellent antioxidant and antibacterial activities.22 The GA has been reported to exhibit an improvement of the mechanical and preservation properties of natural polymer materials which encourages its use as a food-packaging material.23 The ε-polylysine hydrochloride (PL) is a homopolymer of ε-polylysine that is a natural water-soluble polypeptide with 25–30 L-lysine residues.24 The PL exhibits a broad spectrum of antibacterial activity against Gram-negative and Gram-positive bacteria, yeasts and molds.24,25 However, PL possesses a poor antioxidant property, which limits its applications in food manufacturing and preservation processes. Therefore, if PL is combined with a good antioxidant such as GA, good antioxidant and antibacterial activity will be obtained, which increases its applications. However, the effect of the combination of PL and GA on food preservation has yet to be investigated.
Previous studies on the application of PUL, CMC, GA or PL alone in food preservation have been widely reported. However, as far as is known, no published data currently exists on the use of a PUL–CMC coating enriched with the natural antioxidant and antimicrobial GA and PL to enhance the shelf-life of fresh fish. Therefore, the objective of this study was to evaluate the effects of a PUL–CMC coating with GA and/or PL on the microbiological, physicochemical, and flavor quality of sea bass fillets during refrigerated storage.
2 Materials and methods
2.1 Materials
The PUL and CMC were purchased from Shanghai Macklin Biochemical Technology (China). The GA was purchased from Shanghai Yuanye Bioengineering (China). The PL was provided by Zhejiang Silver-Elephant Bio-Engineering (China). The Plate Count Agar was purchased from Qingdao Haibo Biotechnology (China). Other chemical regents were purchased from commercial sources and were of analytical grade: sodium chloride, magnesium oxide, dipotassium phosphate, monopotassium phosphate, perchloric acid, boric acid, potassium hydroxide, thiobarbituric acid (TBA), and trichloroacetic acid (TCA). Live sea bass were purchased from a local aquatic product market in Jinzhou (China), and were rapidly transported to the laboratory (still alive) for further analysis.2.2 Preparation of coating solutions
The PUL powder was dissolved in sterilized deionized water at 55 °C with magnetic stirring until completely dissolved to prepare a 2% (w/v) PUL solution. Then, 1% (w/v) CMC was added into the PUL solution at 55 °C with magnetic stirring until it was completely dissolved to prepare the PUL–CMC composite coating solution. The solutions of PUL–CMC–GA, PUL–CMC–PL and PUL–CMC–GA–PL were obtained by adding 2500 μg mL−1 of GA or/and 625 μg mL−1 of PL into the PUL–CMC coating solution. The concentrations of GA and PL used were determined from the results of preliminary minimum inhibitory concentration (MIC) determinations.2.3 Treatment of fish samples
The sea bass were filleted and were then immediately washed with cold sterile water. Only the dorsal fillets were used in this experiment. The fillets were randomly divided into five groups (Control, PUL–CMC, PUL–CMC–GA, PUL–CMC–PL, PUL–CMC–GA–PL). The fillets in the control group were uncoated. The fillets in the other groups were dipped into PUL–CMC, PUL–CMC–GA, PUL–CMC–PL or PUL–CMC–GA–PL coating solutions for 5 min, and then the fillets were drained. Finally, the fillets were individually packed into sterile polyethylene bags and then stored in a refrigerator (4 °C) before subsequent analysis. Fillets from each group were randomly selected for freshness assessment at five day intervals for 20 d.2.4 Total viable counts (TVC)
The TVC was determined in plate count agar using a pour plate method. Fillets (10 g) were homogenized for 2 min with 90 mL of 0.85% sterile saline water using a stomacher (Shanghai Shenlu Homogenizer Company, Shanghai, China). Subsequently, the homogenate was diluted (1![[thin space (1/6-em)]](https://www.rsc.org/images/entities/char_2009.gif) :
:![[thin space (1/6-em)]](https://www.rsc.org/images/entities/char_2009.gif) 10) in 0.85% sterile saline water. A portion (1 mL) of the diluted homogenate was placed on the pour plate. The plates were incubated at 28 °C for 48 h. The results were reported as log CFU g−1.
10) in 0.85% sterile saline water. A portion (1 mL) of the diluted homogenate was placed on the pour plate. The plates were incubated at 28 °C for 48 h. The results were reported as log CFU g−1.
2.5 Thiobarbituric acid (TBA)
The TBA value was measured by a method used by Erkan and Özden.26 Fillets (10 g) were homogenized with 50 mL of 5% (w/v) TCA and were stirred well. The homogenate was filtered, and 5 mL of the filtrate was mixed with 5 mL of TBA (0.02 mol L−1). The mixture in the water bath became colored after 40 min at 80 °C. After the mixture had cooled to room temperature, the absorbance value at a wavelength of 532 nm was measured against a water blank. The TBA value was obtained from a standard curve of tetramethoxypropane, and was expressed in mg malonaldehyde equivalent per 100 g of sample (mg MDA per kg).2.6 The pH and total volatile basic nitrogen (TVB-N)
To obtain the pH value, fillets (10 g) were homogenized with 90 mL of sterile deionized water using the stomacher mentioned previously. The homogenate was filtered, and then allowed to stand for 30 min. The pH value was measured using a digital pH meter (PHS-2F, Shanghai Leici Instrument, China). For the TVB-N values, the homogenized samples were measured using a Kjeldahl analyzer (Kjeltec 8400, Foss Tecator, Hoganas, Sweden). The results were expressed as mg of TVB-N present per 100 g of fillet sample.2.7 Water holding capacity (WHC)
The WHC was measured using a centrifuge method used by Alemán et al.27 with slight modification. The sea bass fillets (5 g, W1) were completely wrapped in a double-layer of filter paper and then were centrifuged at 4000 rpm for 10 min. After centrifugation, the samples were weighed (W0). The WHC was calculated according to the formula: WHC = W0/W1 × 100%.2.8 Low-field nuclear magnetic resonance (LF-NMR)
The LF-NMR measurement was performed to measure water migration in the fillet samples according to a procedure described by Cao et al.28 The fillets were cut into 1.0 × 1.0 × 3.0 cm3 cubes. They were put in nuclear magnetic tubes and were analyzed in a LF-NMR analyzer (NM 2012, Shanghai Niumag Analytical Instrument Company, Shanghai, China). The test was conducted at a proton resonance frequency of 22 MHz at 20 °C. The transverse relaxation (T2) was measured using a Carr–Purcell–Meiboom–Gill pulse sequence and the τ value was set at 150 μs between 90° pulses and 180° pulses.2.9 Texture profile analysis (TPA)
Fillets were cut to a size of 1.5 × 1.5 × 1.0 cm3 and were used for TPA at room temperature using a texture analyser (TA.XTplus, Stable Micro Systems, Godalming, UK) with a 5 mm diameter P/5 probe. The sample was compressed twice with compression degree of 50%. The test speed was 1 mm s−1 and the recovery time was 2 s. Each sample was tested three times. Next, parameters for hardness, cohesiveness, springiness, chewiness, and resilience were obtained.2.10 Electronic nose
To detect odors and flavors, a portable electronic nose sensor system (PEN3, Airsense Analytics, Germany) was used to determine the aroma profiles of the fillets. A portion (5 g) of minced muscle was placed into a 25 mL sample vial and was immediately sealed with plastic wrap. The sample vial was incubated at 4 °C for 30 min, and then the headspace gas was injected into the detection system with flow rate of 300 mL min−1. Principal component analysis (PCA) and linear discriminant analysis (LDA) for the volatile odors were performed using Winmuster software (Airsense).2.11 Statistical analysis
All the tests in this study were conducted at least in triplicate. The data were expressed as average plus standard deviation (SD). The SPSS software (version 19.0) was used for one-way analysis of variance (ANOVA). Significant differences were separated using Duncan's multiple range test, with p < 0.05 as the level of significance. OriginPro version 8.5 software was used to produce the graphs.3 Results and discussions
3.1 Microbiological analysis
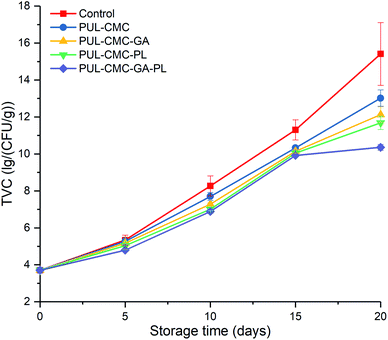
Changes in the TVC of sea bass fillets treated with different coatings during refrigerated storage are shown in Fig. 1. The initial TVC was 3.71 ± 0.15![[thin space (1/6-em)]](https://www.rsc.org/images/entities/char_2009.gif) log CFU g−1 in this study, which indicated good quality sea bass fillets.2 As storage the time was extended, the TVC of each group presented a gradually increasing trend. However, the TVC exhibited the highest increasing rate in the control samples and the lowest increasing rate in PUL–CMC–GA–PL. The upper acceptable limit of TVC for fresh fish was 7
log CFU g−1 in this study, which indicated good quality sea bass fillets.2 As storage the time was extended, the TVC of each group presented a gradually increasing trend. However, the TVC exhibited the highest increasing rate in the control samples and the lowest increasing rate in PUL–CMC–GA–PL. The upper acceptable limit of TVC for fresh fish was 7![[thin space (1/6-em)]](https://www.rsc.org/images/entities/char_2009.gif) log CFU g−1.2,29 On the 10th day of storage, the TVC value exceeded 7
log CFU g−1.2,29 On the 10th day of storage, the TVC value exceeded 7![[thin space (1/6-em)]](https://www.rsc.org/images/entities/char_2009.gif) log CFU g−1 in the control, PUL–CMC, and PUL–CMC–GA and reached 7
log CFU g−1 in the control, PUL–CMC, and PUL–CMC–GA and reached 7![[thin space (1/6-em)]](https://www.rsc.org/images/entities/char_2009.gif) log CFU g−1 in PUL–CMC–PL, which indicated that the samples were at the end of their microbiological shelf-life. Subsequently, the TVC for PUL–CMC–GA–PL was judged to have reached its upper acceptable limit during day 10 to day 15 of storage. The PUL–CMC–GA, PUL–CMC–PL, and PUL–CMC–GA–PL groups had significantly lower TVC values than the control group (p < 0.05) during day 10 to day 20 of storage, especially for the PUL–CMC–GA–PL group. The results suggested that PUL–CMC–GA–PL could effectively inhibit microorganisms during the refrigerated storage of sea bass. Although PUL and CMC possess no antibacterial activity, the inhibiting effect of the PUL–CMC coating on TVC may be attributed to its water binding capacity and the oxygen barrier formed. Furthermore, the PUL–CMC coating combined with antibacterial substances could also enhance the inhibition of the TVC in fish samples. The GA possesses good antioxidant and antibacterial ability, which has been reported previously in the literature.22 Wu et al.30 reported that the antibacterial effect of a chitosan coating was improved by the addition of GA. The PL possesses strong inhibitory effects both on Gram-positive and Gram-negative bacteria, and is often used in the preservation of aquatic products.31 As expected, GA or PL improved the antibacterial effect of the PUL–CMC coating, and the combination of GA and PL was even more effective.
log CFU g−1 in PUL–CMC–PL, which indicated that the samples were at the end of their microbiological shelf-life. Subsequently, the TVC for PUL–CMC–GA–PL was judged to have reached its upper acceptable limit during day 10 to day 15 of storage. The PUL–CMC–GA, PUL–CMC–PL, and PUL–CMC–GA–PL groups had significantly lower TVC values than the control group (p < 0.05) during day 10 to day 20 of storage, especially for the PUL–CMC–GA–PL group. The results suggested that PUL–CMC–GA–PL could effectively inhibit microorganisms during the refrigerated storage of sea bass. Although PUL and CMC possess no antibacterial activity, the inhibiting effect of the PUL–CMC coating on TVC may be attributed to its water binding capacity and the oxygen barrier formed. Furthermore, the PUL–CMC coating combined with antibacterial substances could also enhance the inhibition of the TVC in fish samples. The GA possesses good antioxidant and antibacterial ability, which has been reported previously in the literature.22 Wu et al.30 reported that the antibacterial effect of a chitosan coating was improved by the addition of GA. The PL possesses strong inhibitory effects both on Gram-positive and Gram-negative bacteria, and is often used in the preservation of aquatic products.31 As expected, GA or PL improved the antibacterial effect of the PUL–CMC coating, and the combination of GA and PL was even more effective.
3.2 Lipid oxidation
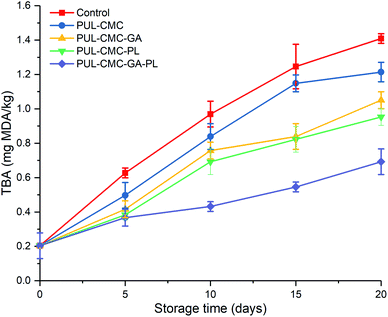
The degree of lipid oxidation in sea bass fillets was evaluated by determining the TBA value. The TBA has been a sensitive indicator for lipid oxidation of seafood and reflects the content of the main secondary lipid oxidation products.32 Changes in the TBA values of sea bass samples treated with different coatings during 20 d of refrigerated storage are shown in Fig. 2. The initial TBA value of sea bass was 0.20 mg MDA per kg, and this gradually increased up to the end of the storage time in all groups. The TBA value in the control group was dramatically increased from 0.20 mg MDA per kg to 1.41 mg MDA per kg during storage of 20 days, and was significantly higher than that in the coating treatment groups, which indicated that more secondary products were produced by a higher degree of lipid oxidation in the control group samples. The lower degree of lipid oxidation in the PUL–CMC coating may be due to the oxygen barrier properties of the coating. Generally, polysaccharide coatings which were directly applied to the fish surfaces could reduce gas exchange between the fish and the environment.33 The TBA values with PUL–CMC–GA and PUL–CMC–PL were lower than that in PUL–CMC, indicating that both GA and PL could enhance the antioxidant activity of the PUL–CMC coating for retaining the quality of the sea bass. Because GA is a phenolic acid it can scavenge DPPH, and has a strong antioxidant capacity.34 Edible coatings containing PL could effectively inhibit lipid oxidation in aquatic products, which was consistent with the findings of Xu et al.35 On the 10th day of storage, the TBA values exceeded 0.7 mg MDA per kg in the control, PUL–CMC, and PUL–CMC–GA groups, and was close to 0.7 mg MDA per kg in the PUL–CMC–PL group. However, the TBA value in PUL–CMC–GA–PL group remained below 0.7 mg MDA per kg throughout the storage time, suggesting that it had a strong ability to retard lipid oxidation of the sea bass during refrigerated storage. Therefore, combining GA and PL appeared to have a synergistic effect on the antioxidant activity and in improving the quality of the sea bass during storage.3.3 pH values
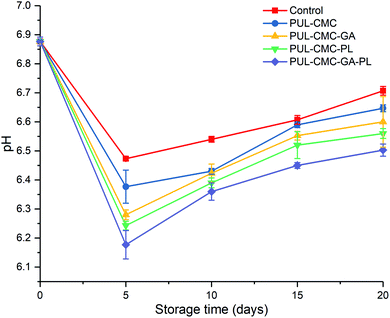
The pH value is one of the important indexes to judge the quality of aquatic products. Changes in the pH of the sea bass fillets during the refrigerated storage are shown in Fig. 3. The initial pH value was 6.88, for fish usually possess a very high post-mortem pH (>6.0). The pH value of all five groups decreased to a minimum value during the first five days of storage and subsequently showed an upward trend, which was consistent with the pH trends of the sea bass during storage reported by He et al.36 The generation and accumulation of acidic compounds such as lactic acid and phosphoric acid after the death of fish may have caused the decrease of the pH value.36,37 However, as the storage time was prolonged, accumulation of volatile bases such as ammonia and trimethylamine from the action of microorganisms and endogenous enzymes will cause the pH increase.36,37 Although changes in pH of all the groups exhibited similar trends, the pH in the coating groups progressed at a slower rate of increase than that of the control group during the whole storage time. This indicated that the PUL–CMC composite coatings could effectively reduce the accumulation of volatile bases and delay the spoilage of sea bass, and this may be due to the barrier property of the PUL–CMC coating, the antioxidant activity of GA and the antibacterial activity of PL.16,23,25 In addition, it should be noted that the pH values in PUL–CMC–GA–PL exhibited a lower pH value than other groups during storage. This may be due to the addition of GA and PL enhancing the antioxidant or antibacterial activities of the PUL–CMC coating, and a synergistic effect on the delay of fish spoilage might exist between GA and PL.3.4 Protein degradation
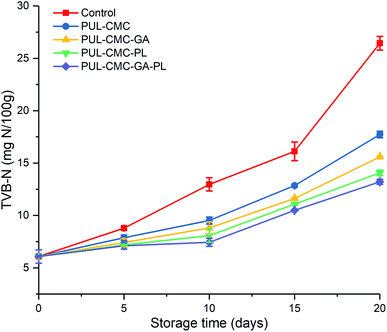
Total volatile basic nitrogen (TVB-N) is an important indicator for the evaluation of freshness of aquatic products, and it is produced by protein degradation under the action of enzymes and microorganisms during the storage of aquatic products.38 The initial TVB-N was 6.09 mg N per 100 g in this study, which indicating the good quality of the sea bass samples. Compared with the TVB-N value in the PUL–CMC composite coatings, a significant increase of TVB-N in control group was observed (p < 0.05) (Fig. 4). The results indicated that protein degradation of sea bass could be retarded by the PUL–CMC coatings. Furthermore, PUL–CMC–GA, PUL–CMC–PL, and PUL–CMC–GA–PL significantly delayed the increase of TVB-N in sea bass when compared to PUL–CMC, which suggested that the incorporation of GA, PL, and GA–PL into the PUL–CMC coating enhanced the capability of the composite coatings to inhibit protein degradation, especially the combination of GA and PL. It was reported that the formation and accumulation of TVB-N in fish during storage was mainly due to the bacterial decomposition of fish muscle.31 the TVB-N in fish mainly includes ammonia, dimethylamine (DMA), trimethylamine (TMA) and other basic volatile nitrogenous compounds, among which TMA was produced by microbial enzymes that degrade trimethylamine oxide (TMAO). Therefore, the production of TVB-N in the PUL–CMC–GA–PL sample was well below that of the other groups, which could be attributed to the synergistic effect of GA, PL and the PUL–CMC coating on the antibacterial activity and furthermore on the inhibition of protein degradation.3.5 WHC and water migration
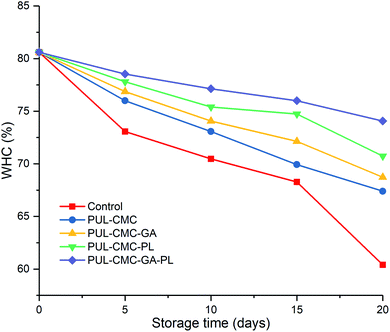
Changes in the WHC of sea bass during refrigerated storage are shown in Fig. 5. The WHC in the five groups showed a decreasing trend during the storage, and the highest decrease rate was observed in the control group. The initial WHC was 80%, and it decreased to 60%, 67%, 69%, 70% and 74% for the control, PUL–CMC, PUL–CMC–GA, PUL–CMC–PL, and PUL–CMC–GA–PL groups at the end of the storage, respectively. A lower WHC in fish muscle could be attributed to the protein denaturation of fish muscle during storage. In the muscle bundle of fish, myofibrils constitute a significant fraction. Denaturation of its myosin could cause a decrease of hydration capability, which would result in an increase of less tightly bound water in fish and thus a decrease of the WHC.30 The higher WHC in the groups which had a coating treatment indicated the good quality of the proteins of the sea bass samples, which may be related to the lower protein denaturation and degradation of fish samples under the protection of the coatings. The lowest decrease rate of WHC in the PUL–CMC–GA–PL group further confirmed the synergistic effect of the GA, PL and PUL–CMC coating on the retention of moisture and the protection of the proteins in fish during storage.The LF-NMR measurements were used to characterize the water migration in sea bass during storage, and the results are shown in Fig. 6. The water in the fish muscles can be classified into bound water, immobilized water and free water, and pT21, pT22, and pT23 represented the relative populations of these three fractions water, respectively. The pT21 slightly increased and the pT23 obviously increased in all the groups during storage to however, pT22 decreased during storage and was always the largest proportion of the three types of water, which was similar to the results found by Liu et al.39 The results indicated that the immobile water and free water exhibited more obvious changes than the bound water in the sea bass during storage. Furthermore, the trend of the change of immobile water was opposite to that of free water, which suggested that immobile water within the myofibril migrated to the extra myofibrillar space and was converted into free water with the extension of the storage time.40 In the five groups, the pT22 in the control group exhibited the fastest decreasing rate compared with coating groups. At the beginning of storage, no significant differences (p > 0.05) were observed in pT22 between the control and the PUL–CMC group. However, PUL–CMC–GA, PUL–CMC–PL, and PUL–CMC–GA–PL significantly maintained their content of immobile water and the formation of free water was reduced. The changes of muscle tissue structure and physicochemical properties of the myofibrillar protein could affect the water migration.41,42 The results indicated that the addition of GA, PL, and GA–PL could improve the ability of the PUL–CMC coating to immobilize water within the myofibril to maintain the excellent quality of the sea bass muscle during storage. The strong ability of PUL–CMC–GA–PL to maintain the quality of sea bass fillets during refrigerated storage showed the least variation in moisture migration compared with the other groups, which was consistent with the analysis of other freshness indicators.
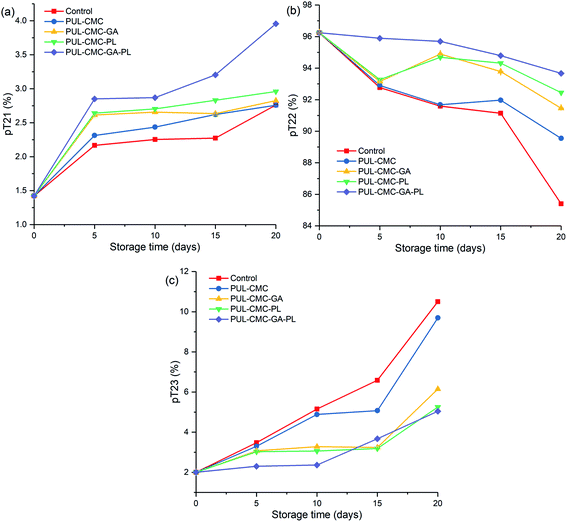 | ||
| Fig. 6 Changes in water migration of sea bass fillets during refrigerated storage for 20 days, (a) bound water, (b) immobilized water, (c) free water. | ||
3.6 Texture profile
Fish texture is an important parameter which affects consumers' preference and acceptance, and is related to the shelf-life of fish. Texture parameters including hardness, chewiness, springiness, cohesiveness, and resilience of the sea bass fillets were measured to determine the effect of coatings on the freshness changes of the sea bass. As shown in Table 1, the values of hardness in all the groups showed a decreasing trend with the prolonged storage time, which indicated a textural deterioration of all the samples. However, the samples treated with coatings had higher hardness values than that of the control, and exhibited a lower softening rate during the whole storage time. There were no significant distinctions of hardness values among the PUL–CMC, PUL–CMC–GA, and PUL–CMC–PL groups (p > 0.05), whereas the samples treated with PUL–CMC–GA–PL exhibited a significantly higher hardness value than those of the other groups. Therefore, the GA combined with PL effectively enhanced the effects of the PUL–CMC coating in delaying the softening of the sea bass fillets during storage time. The chewiness, springiness, cohesiveness, and resilience parameters showed a similar tendency to change to the hardness, which were agreement with the findings of Cai et al.2 and Xu et al.29 These results further demonstrated that the PUL–CMC–GA–PL could effectively protect the texture of the sea bass during storage.| Groups | Storage days | ||||
|---|---|---|---|---|---|
| 0 | 5 | 10 | 15 | 20 | |
| a All values were means ± standard deviation of three values. Different small letters in the same row indicate significant differences between means (p < 0.05). Different capital letters in the same column indicate significant differences between means (p < 0.05). | |||||
| Hardness (N) | |||||
| Control | 5055.30 ± 294.28aA | 1651.62 ± 164.77bC | 1613.89 ± 123.28bB | 1610.46 ± 398.19bB | 983.33 ± 143.56cC |
| PUL–CMC | 5055.30 ± 294.82aA | 2058.37 ± 161.76bB | 1822.47 ± 355.73bcB | 1796.57 ± 161.85bcAB | 1591.87 ± 113.56cB |
| PUL–CMC–GA | 5055.30 ± 294.82aA | 2159.58 ± 154.34bB | 2125.84 ± 122.47bAB | 1883.14 ± 199.74bcB | 1617.90 ± 209.17cB |
| PUL–CMC–PL | 5055.30 ± 294.82aA | 2271.88 ± 95.73bB | 2140.95 ± 746.59bAB | 1895.37 ± 49.53bB | 1693.67 ± 116.92bB |
| PUL–CMC–GA–PL | 5055.30 ± 294.82aA | 3014.18 ± 210.03bA | 2538.56 ± 39.15cA | 2298.80 ± 220.93cdA | 2034.16 ± 188.74dA |
![[thin space (1/6-em)]](https://www.rsc.org/images/entities/char_2009.gif) |
|||||
| Chewiness (N mm) | |||||
| Control | 773.07 ± 83.22aA | 219.48 ± 53.95bB | 176.21 ± 12.68bB | 174.12 ± 5.23bC | 140.07 ± 17.93bD |
| PUL–CMC | 773.07 ± 83.22aA | 225.38 ± 35.43bB | 177.41 ± 5.90bB | 174.30 ± 11.70bC | 172.32 ± 11.26bC |
| PUL–CMC–GA | 773.07 ± 83.22aA | 247.42 ± 77.85bB | 240.38 ± 17.82bAB | 201.86 ± 39.45bBC | 180.05 ± 11.80bC |
| PUL–CMC–PL | 773.07 ± 83.22aA | 258.43 ± 34.35bB | 240.50 ± 18.99bAB | 236.06 ± 16.89bB | 204.00 ± 2.82bB |
| PUL–CMC–GA–PL | 773.07 ± 83.22aA | 445.26 ± 66.98bA | 319.44 ± 142.78bcA | 315.74 ± 26.72bcA | 226.59 ± 14.29cA |
![[thin space (1/6-em)]](https://www.rsc.org/images/entities/char_2009.gif) |
|||||
| Springiness (mm) | |||||
| Control | 0.43 ± 0.02aA | 0.40 ± 0.03abC | 0.39 ± 0.01abC | 0.37 ± 0.03bA | 0.36 ± 0.03bA |
| PUL–CMC | 0.43 ± 0.02aA | 0.41 ± 0.02abBC | 0.41 ± 0.01abBC | 0.38 ± 0.06abA | 0.37 ± 0.02bA |
| PUL–CMC–GA | 0.43 ± 0.02aA | 0.44 ± 0.04aABC | 0.43 ± 0.02aAB | 0.38 ± 0.02abA | 0.38 ± 0.04bA |
| PUL–CMC–PL | 0.43 ± 0.02abA | 0.44 ± 0.00aAB | 0.44 ± 0.01abAB | 0.40 ± 0.04bcA | 0.38 ± 0.02cA |
| PUL–CMC–GA–PL | 0.43 ± 0.02aA | 0.47 ± 0.03aA | 0.46 ± 0.03aA | 0.43 ± 0.05aA | 0.42 ± 0.06aA |
![[thin space (1/6-em)]](https://www.rsc.org/images/entities/char_2009.gif) |
|||||
| Cohesiveness (N) | |||||
| Control | 0.37 ± 0.03aA | 0.25 ± 0.02bB | 0.24 ± 0.02bD | 0.23 ± 0.01bD | 0.22 ± 0.02bB |
| PUL–CMC | 0.37 ± 0.03aA | 0.27 ± 0.08bB | 0.26 ± 0.02bCD | 0.25 ± 0.01bCD | 0.24 ± 0.04bAB |
| PUL–CMC–GA | 0.37 ± 0.03aA | 0.28 ± 0.02bB | 0.27 ± 0.02bC | 0.27 ± 0.02bBC | 0.27 ± 0.04bAB |
| PUL–CMC–PL | 0.37 ± 0.03aA | 0.32 ± 0.01abAB | 0.32 ± 0.01bB | 0.30 ± 0.04bB | 0.28 ± 0.04bAB |
| PUL–CMC–GA–PL | 0.37 ± 0.03aA | 0.39 ± 0.08aA | 0.37 ± 0.03aA | 0.36 ± 0.01abA | 0.28 ± 0.04bA |
![[thin space (1/6-em)]](https://www.rsc.org/images/entities/char_2009.gif) |
|||||
| Resilience (mm) | |||||
| Control | 0.18 ± 0.01aA | 0.10 ± 0.01bB | 0.10 ± 0.01bC | 0.10 ± 0.01bC | 0.10 ± 0.00bC |
| PUL–CMC | 0.18 ± 0.01aA | 0.11 ± 0.04bB | 0.12 ± 0.02bB | 0.11 ± 0.01bC | 0.11 ± 0.01bC |
| PUL–CMC–GA | 0.18 ± 0.01aA | 0.13 ± 0.01bAB | 0.13 ± 0.01bB | 0.13 ± 0.00bB | 0.12 ± 0.01bBC |
| PUL–CMC–PL | 0.18 ± 0.01aA | 0.14 ± 0.00bAB | 0.14 ± 0.01bAB | 0.13 ± 0.00bB | 0.13 ± 0.02bAB |
| PUL–CMC–GA–PL | 0.18 ± 0.01aA | 0.16 ± 0.03abA | 0.15 ± 0.00bA | 0.15 ± 0.01bA | 0.14 ± 0.01bA |
Texture softening of fish has been proven to be related to the changes in density of muscle fibers, and the contents of collagen and fat, which was mostly attributed to proteolysis induced by endogenous autolytic enzymes and microbiological processes.29 It has also been found that the degradation of myofibrillar structural proteins, such as desmin and titin, play an important role in fish softening. The degradation of desmin and titin caused the disorganization of the striated muscle structure, which is the main cause of the softening of fish and the decrease of springiness during the refrigerated storage.43 In addition, protein conformation could be affected by oxidation which caused the structure to loosen.29 The combination of GA and PL in the PUL–CMC coating exhibited a synergistic effect on maintaining the texture of the sea bass, which may be due to the inhibition by GA and PL against the activities of endogenous enzymes, microorganisms, and oxidation.
3.7 Electronic nose analysis
Some volatiles produced from the degradation of protein and fat during the storage of fish have a putrid odor, such as trimethylamine, hydrogen sulfide, and ammonia, which affect the smell quality of the fish and can reflect the change of fish freshness.44 The electronic nose which can detect and distinguish odors, is mainly applied for quality assessment, spoilage identification, and off-flavor detection. In the present work, an electronic nose was used to detect the variation in smell quality of sea bass fillets treated with PUL–CMC coatings, and the PCA and LDA loading plots of the different variables of sea bass filets is shown in Fig. 7. The PCA plot shows the primary and secondary PC scores, PC1 and PC2. The PC1 explains 94.19% of the sample variance and PC2 explains only 4.54%. The combined sample variance of PC1 and PC2 was 98.73%, indicating that it was effective at separating the different degrees of spoilage of the samples (Fig. 7a). Compared with the fresh sample on day 0, the points of the other samples were distributed along the positive side of the PC2 axis in the PCA plot. In the LDA plot, LD1 and LD2 accounted for 49.57% and 25.44% of the sample variance, respectively, with a total variance value of 75.01% (Fig. 7b). Most points of the coating-treated samples were relatively close to those of day 0, which indicated that the treatment caused no large differences in the odor composition of the fillets. Moreover, the points of the 20 d samples gradually moved farther away from the points of the other samples during storage, along the negative side of the LD1 axis, which was due to the serious spoilage which occurred when the samples had been in storage for 20 d. These results showed good agreement with the results of TBA, TVB-N, TCA, and the texture properties.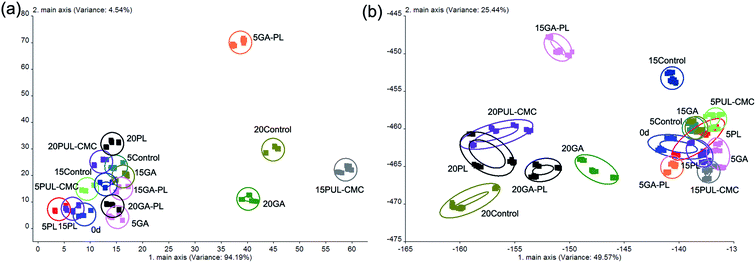 | ||
| Fig. 7 The PCA (a), and LDA (b) plots of the E-nose data for sea bass fillets during refrigerated storage. | ||
4 Conclusion
The results of the current study concluded that the addition of GA and/or PL can improve the preservation property of the PUL–CMC coating in preserving sea bass fillets. Furthermore, the combination of GA and PL was more effective than using GA or PL alone in improving the inhibition by the PUL–CMC coating of lipid oxidation, protein degradation, microbial growth, and deterioration in texture of sea bass. In the PUL–CMC–GA–PL group, TVC, TVB-N and pH were all lower than in the other groups. In addition, the TBA value in the PUL–CMC–GA–PL group remained below 0.7 mg MDA per kg after 20 d, which was extended by 10 days when compared to the results for the other groups. The WHC in PUL–CMC–GA–PL only decreased by 6.53% during 20 days of storage. Combining the results, it can be concluded that the GA and PL possess possible synergistic effects on antioxidative and antimicrobial activities in preserving sea bass fillets. The findings in this study suggest that PUL–CMC–GA–PL can be successfully used for fish preservation.Conflicts of interest
The authors declared that there are no conflicts of interest associated with this work.Acknowledgements
This work was supported by the Young Science and Technology talents "seedling" project of Liaoning Provincial Education Department (LQ2020004), and the Fund of the Beijing Engineering and Technology Research Center of Food Additives, Beijing Technology & Business University (BTBU).References
- O. Martínez, J. Salmerón, L. Epelde, M. S. Vicente and C. Vega, Food Control, 2018, 85, 168–176 CrossRef.
- L. Cai, A. Cao, F. Bai and J. Li, LWT--Food Sci. Technol., 2015, 62(2), 1053–1059 CrossRef CAS.
- S. A. A. Mohamed, M. El-Sakhawy and M. A. El-Sakhawy, Carbohydr. Polym., 2020, 238, 116178 CrossRef CAS PubMed.
- S. Dehghani, S. V. Hosseini and J. M. Regenstein, Food Chem., 2017, 240, 505–513 CrossRef PubMed.
- P. Umaraw, P. E. S. Munekata, A. K. Verma, F. J. Barba, V. P. Singh, P. Kumar and J. M. Lorenzo, Trends Food Sci. Technol., 2020, 98, 10–24 CrossRef CAS.
- S. Galus and J. Kadzińska, Trends Food Sci. Technol., 2015, 45(2), 273–283 CrossRef CAS.
- S. Kumar, A. Mukherjee and J. Dutta, Trends Food Sci. Technol., 2020, 97, 196–209 CrossRef CAS.
- N. A. Al-Tayyar, A. M. Youssef and R. Al-hindi, Food Chem., 2020, 310, 125915 CrossRef CAS PubMed.
- S. M. El-Sayed, H. S. El-Sayed, O. A. Ibrahim and A. M. Youssef, Carbohydr. Polym., 2020, 239, 116234 CrossRef CAS PubMed.
- A. M. Youssef, S. M. El-Sayed, H. S. El-Sayed, H. H. Salama, F. M. Assem and M. H. A. El-Salam, Int. J. Biol. Macromol., 2018, 115, 1002–1011 CrossRef CAS PubMed.
- A. M. Youssef, F. M. Assem, H. S. El-Sayed, S. M. El-Sayed, M. Elaaser and M. H. A. El-Salam, RSC Adv., 2020, 10, 37857–37870 RSC.
- N. A. Al-Tayyar, A. M. Youssef and R. R. Al-Hindia, Sustainable Mater. Technol., 2020, 26, e00215 CrossRef CAS.
- M. G. Kontominas, A. V. Badeka, I. S. Kosma and C. I. Nathanailides, Foods, 2021, 10, 940 CrossRef PubMed.
- X. Wei, G. Liu, S. Jia, Z. Chi, Z. Hu and Z. Chi, Carbohydr. Polym., 2021, 251, 117076 CrossRef CAS PubMed.
- S. Tabasum, A. Noreen, M. F. Maqsood, H. Umar, N. Akram, Z. Nazli, S. A. S. Chatha and K. M. Zia, Int. J. Biol. Macromol., 2018, 120, 603–632 CrossRef CAS PubMed.
- S. Li, J. Yi, X. Yu, Z. Wang and L. Wang, Mater. Sci. Eng., C, 2020, 110, 110721 CrossRef CAS PubMed.
- M. Ali, N. R. Khan, H. M. Basit and S. Mahmood, J. Polym. Res., 2020, 27(1), 1–11 CrossRef.
- A. P. S. M. Fiori, P. H. Camani, D. S. Rosa and D. J. Carastan, Ind. Crops Prod., 2019, 140, 111644 CrossRef.
- H. F. Youssef, M. E. El-Naggar, F. K. Fouda and A. M. Youssef, Food Packaging and Shelf Life, 2019, 22, 100378 CrossRef.
- S. Li, Y. Ma, T. Ji, D. E. Sameen, S. Ahmed, W. Qin, J. Dai, S. Li and Y. Liu, Carbohydr. Polym., 2020, 248, 116805 CrossRef CAS PubMed.
- P. Shao, B. Niu, H. Chen and P. Sun, Int. J. Biol. Macromol., 2018, 107(B), 1908–1914 CrossRef CAS PubMed.
- S. Choubey, S. Goyal, L. R. Varughese, V. Kumar, A. K. Sharma and V. Beniwal, Mini-Rev. Med. Chem., 2018, 18(15), 1283–1293 CrossRef CAS PubMed.
- K. Limpisophon and G. Schleining, J. Food Sci., 2017, 82(1), 80–89 CrossRef CAS PubMed.
- Z. Jia, C. Li, T. Fang and J. Chen, J. Food Sci., 2019, 84(1), 127–132 CrossRef CAS PubMed.
- H. Yang, Q. Li, L. Yang, T. Sun, X. Li, B. Zhou and J. Li, Int. J. Food Sci. Technol., 2020, 55(12), 3542–3552 CrossRef CAS.
- N. Erkan and Ö. Özden, Int. J. Food Sci. Technol., 2008, 43(9), 1549–1559 CrossRef CAS.
- A. Alemán, F. González, M. Y. Arancibia, M. E. López-Caballero, P. Montero and M. C. Gómez-Guillén, Food Control, 2016, 70, 325–332 CrossRef.
- M. Cao, A. Cao, J. Wang, L. Cai, J. Regenstein, Y. Ruan and X. Li, Food Chem., 2018, 266, 498–507 CrossRef CAS PubMed.
- Y. Xu, Y. Yin, T. Li, H. Zhao, X. Li, J. Li and T. Sun, J. Food Sci., 2020, 85(4), 1037–1044 CrossRef CAS PubMed.
- C. Wu, Y. Li, L. Wang, Y. Hu, J. Chen, D. Liu and X. Ye, Food Bioprocess Technol., 2016, 9(4), 675–685 CrossRef CAS.
- C. Wu, J. Sun, Y. Lu, T. Wu, J. Pang and Y. Hu, Int. J. Biol. Macromol., 2019, 132, 385–392 CrossRef CAS PubMed.
- Y. Xiong, M. Chen, R. D. Warner and Z. Fang, Food Control, 2020, 110, 107018 CrossRef CAS.
- T. Li, J. Li, W. Hu and X. Li, Food Chem., 2013, 138(2–3), 821–826 CrossRef CAS PubMed.
- H. Zhang, Y. Yang and Z. Zhou, J. Integr. Agric., 2018, 17, 256–263 CrossRef CAS.
- J. Xu, R. Wei, Z. Jia and R. Song, Food Hydrocolloids, 2020, 100, 105436 CrossRef CAS.
- Q. He, B. Gong, J. He and K. Xiao, Agriculture, 2019, 500, 243–249 CAS.
- Z. Ramezani, M. Zarei and N. Raminnejad, Food Control, 2015, 51, 43–48 CrossRef CAS.
- S. Na, J. Kim, H. Jang, H. Park and S. Oh, Int. J. Biol. Macromol., 2018, 115, 1103–1108 CrossRef CAS PubMed.
- W. Liu, Y. Shen, N. Li, J. Mei and J. Xie, J. Food Qual., 2019, 1, 1–8 Search PubMed.
- I. Sánchez-Alonso, P. Moreno and M. Careche, Food Chem., 2014, 153, 250–257 CrossRef PubMed.
- X. Wang and J. Xie, LWT--Food Sci. Technol., 2019, 108, 289–296 CrossRef CAS.
- M. Gudjónsdóttir, S. Arason and T. Rustad, J. Food Eng., 2011, 104(1), 23–29 CrossRef.
- F. Yang, S. Jia, J. Liu, P. Gao, D. Yu, Q. Jiang, Y. Xu, P. Yu, W. Xia and X. Zhan, Food Chem., 2019, 301, 125278 CrossRef CAS PubMed.
- T. Nisar, X. Yang, A. Alim, M. Iqbal, Z. Wang and Y. Guo, Int. J. Biol. Macromol., 2019, 124, 1156–1166 CrossRef CAS PubMed.
| This journal is © The Royal Society of Chemistry 2021 |

