 Open Access Article
Preparation of a stabilized aqueous polystyrene suspension via phase inversion
Zahra Dastbaz,
Shabnam Nargesi Dana and
Seyed Nezameddin Ashrafizadeh *
*
Research Lab for Advanced Separation Processes, Department of Chemical Engineering, Iran University of Science and Technology, Narmak, Tehran 16846-13114, Iran. E-mail: ashrafi@iust.ac.ir
First published on 13th May 2021
Abstract
Polymer suspensions have found various applications in novel technologies. In this research, an aqueous suspension of polystyrene was prepared via the phase inversion method using sodium lauryl sulfate (SLS) as an anionic surfactant and two co-surfactants. The effects of co-surfactant ratio and salt concentration were investigated and the stability and characteristics of the prepared samples were identified. All samples possessed a zeta potential lower than −50 mV which reveals an electrostatic stability. The sample PS-1, containing the lower salt concentration of 1 × 10⁻³ M, was the most stable sample, while its stability decreases with increasing salt concentration. The sample PS-5 during the electrical conductivity measurement exhibited partial instability via agglomeration of polymer on the probe. Rheology measurements revealed that the suspension behavior varies between Newtonian and non-Newtonian. Eventually, PS-1 containing 4.00 g polystyrene, 1.70 g SLS and a co-surfactant ratio of 0.66, suspended within 150 mL of 0.003 M aqueous NaCl solution, exhibited proper stability.
1. Introduction
Preparation and production of polymeric suspensions based on emulsions, via direct emulsification1 and phase inversion temperature (PIT)2,3 methods for various industrial applications, is experiencing growing demand.4–6 The best advantage of the latter methods is the lower coalescence of oil droplets due to the simultaneous application of surfactants and co-surfactants which enhances the adsorption of surface active reagents on the oil/water interface.7 Production of finely dispersed oil-in-water emulsions via direct emulsification requires the consumption of relatively large amounts of mechanical energy to overcome the Laplace pressure. Although overcoming the Laplace pressure can be achieved through further usage of surfactants, due to the unwillingness of consuming substantial amounts of surfactants in most of the applications, the phase inversion method is preferred.8 It is notable that for some high molecular weight polymers, due to their high tendency towards the oil phase, i.e. high hydrophobicity, emulsification has shown very difficult, and thus low energy methods like PIT inapplicable. In such cases, high energy methods have been employed for their emulsifications.1,9When the temperature of a mixture incorporating a nonionic surfactant is raised, due to the expanded dehydration of the nonionic surfactant chains, i.e. co-surfactant, dissolution of nonpolar substances in the mixture is increased. This goes with diminishing the tension at the O/W interface. With further increase in temperature, the chains of co-surfactants become more and more dehydrated, the surfactant becomes more lipophilic, and more and more nonpolar substances is solubilized into the increasingly asymmetric micelles. This is where the HLB of surfactants undergoes a change. In the vicinity of the cloud point of the nonionic surfactant, the surfactants of the micelles together with the solubilized substances will start to separate from the aqueous phase and form a new phase (dehydration of co-surfactant along with the increase in the surfactant hydrophobicity, change the curvature of the micelle formation). If excess oil is still present, the system now consists of three phases. As the temperature continues to increase, more and more micelles separate out of the aqueous phase and carry water and oil with them. The volume of the aqueous phase continues to decrease and that of the middle phase increases. At such conditions, through the interactions among the interfacial phases and the bulk liquid, the phase inversion commences. Since the oil–water interfacial tension is minimum at the PIT, emulsions made at this temperature should have the finest particle size. In fact, this is the point at which the smallest droplets of oil are present in the system. Therefore, by holding the emulsion at this point, a stable emulsion of very small and relatively low energy droplets will be obtained.10
In addition to temperature, all other physical and chemical variables can also change the surfactant affinity towards the water and/or oil phases.8 The success of the phase inversion method depends on various factors including the chemical composition, concentration, and nature of surfactants, water/oil phase volume ratio, and the number of carbons in the oil phase alkane.
One of the main applications of PIT method is the production of nanoemulsions where the internal droplets have diameters less than 100 nm.11 Galindo-Alvarez et al. used the so-called near-PIT method to produce nano-sized polystyrene oxide particles coated with styrene. They used a combination of Brij78 and Brij700 within a stable emulsion.12 They declared that by varying the amount of surfactant the interfacial tension changed while the main properties of the emulsion remained unaltered. Their finding is very useful in applications where the interfacial conditions are determinative.
Whenever emulsification methods are employed, a piece of knowledge on surfactants behavior is required; particularly, where the smallest size of droplets is aimed. As was described earlier, the surfactant concentration plays an important role in the stability as well as the size of the emulsion droplets formed by the PIT method. By increasing the surfactant concentration, due to increase in the interfacial area as well as decrease in the surface tension, the size of emulsion droplets decreases. Moreover, in the PIT method, for the phase inversion to proceed, the surface curvature should primarily change.13 Thananukul et al. used SDS and polyvinyl alcohol as surfactants for the polymerization of P(LA-co-GMA) copolymer through the phase inversion method.7 It was found that the presence of SDS increased the efficiency of PVA stabilizer in producing particles of narrow size distribution. They also reported that an increase in the SDS concentration facilitated the production of smaller micro droplets through reinforcement of the hydrophilic structure of PVA.
Although polymerization of styrene monomers with the use of various surfactants has been reported in a number of publications, there is no evidence on the application of the phase inversion method for the preparation of styrene suspensions. Elgammal et al.4 used Brij78 surfactant and the phase inversion emulsification method in polymerization of styrene monomers. The surfactant–monomer system exhibited a lamellar system in dilution with water which shows very stable upon further dilution. In fact, this surfactant was found suitable for the emulsification through phase inversion method. Generally, the use of one surfactant alone does not provide the required HLB for the emulsification of a particular system, while the use of two or a few surfactants of different HLBs can lower the interfacial tension and provide a stable emulsion.14 Regarding the preparation of polystyrene emulsions by direct emulsification method, using SLS as surfactant as well as cetyl and stearyl alcohols as co-surfactants, droplets with a narrow polydispersity have been produced.15,16 In the latter studies, however, the need for the application of membrane systems in producing small size droplets has been reported as a shortcoming.
The effect of salt concentration on the phase inversion temperature as well as the emulsion stability has been also studied. Pourjavaheri et al.17 investigated the effect of addition of MgCl2 on the preparation of nanoemulsions by phase inversion method. Their results revealed that the phase inversion temperature decreased by increasing the salt concentration; the PIT is only increasing up to a particular salt concentration and then decrease. The results also revealed that the sample with the lowest salt concentration exhibited the most stability.
The aim of the current research was focused on the preparation of stable and as monodisperse as possible aqueous suspensions of polystyrene through the phase inversion emulsification method. Anionic surfactant of SLS was used as the main dispersant, as well as cetyl and stearyl alcohols, were used as co-surfactants, while NaCl was also used to adjust the phase inversion temperature. The optimum suspension was finally prepared and characterized. The stability of the prepared suspensions was also investigated through the zeta potential, particle size, electrical conductivity and rheology measurements.
2. Experimentals
2.1. Chemicals
Polystyrene of industrial grade was purchased from Tabriz Petrochemical Company (Iran). Cyclohexane with a molecular weight of 84.16 was obtained from Merck (Germany). Sodium lauryl sulfate (SLS) (HLB = 40) with the molecular formula of NaC12H25SO4 and molecular weight of 288.37 g gmol−1 was used as surfactant. Stearyl alcohol (HLB = 15) and cetyl alcohol (HLB = 15), were bought from Mobtakeran Chimi (Iran) and used as co-surfactants. The chemical formulas of SLS, as well as stearyl and cetyl alcohols are provided elsewhere.1 Distilled water was used as the bulk aqueous phase.2.2. Experimental procedures
In this research, the phase inversion emulsification method was used to prepare the polystyrene aqueous suspensions.8,18 In order to prepare the organic phase of the emulsion, different ratios of stearyl and cetyl alcohols were mixed. The mixture was melted by means of heating on a magnet stirrer heater up to 60 °C and then was gradually cooled to ambient temperature. The melting process was repeated for three times to obtain a homogeneous mixture. The amount of 4.00 grams of polystyrene and 40 mL of cyclohexane were added to the mixture of alcohols. Subsequently, the whole organic phase was refluxed within a rotary vacuum evaporator at 300 rpm and 50 °C for 48 hours until a transparent solution was obtained.The aqueous phase of the emulsion was prepared through addition of 1.700 grams of SLS into 150 mL of distilled water containing either of 0.003, 0.010, 0.050, and 0.100 M of NaCl. The aqueous mixture was rest at the ambient temperature for 24 hours. The final clear aqueous phase was prepared by heating the solution up to 50 °C for 15 minutes while stirring at 300 rpm.
To commence the emulsification process, the organic phase which was heated up to 50 °C, was gradually added to the aqueous phase while the whole mixture was stirred at 300 rpm for 30 minutes at 50 °C. In this way, the primary oil-in-water macroemulsion was formed. Subsequently, the emulsion was heated while the probe of conductivity meter was put within the sample and the conductivity of the solution versus temperature rise was recorded. A thermometer was also put within the emulsions to monitor the temperature. Since the primary system is an oil-in-water emulsion, i.e. the continuous phase is an aqueous electrolyte, the conductivity increases versus the temperature. The particular temperature at which the conductivity started to decline was considered as the phase inversion temperature (PIT). By further increase in temperature beyond the PIT, the conductivity continues to decrease proving that a water-in-oil emulsion is formed. Providing that the phase inversion temperature had been recorded and the emulsion was heated up to temperatures above PIT, the emulsion was gradually cooled up to the PIT at ambient temperature while it was still stirring at 300 rpm. Upon reaching the PIT, the sample was stirred for further 30 minutes while the emulsion was kept at the same temperature in order to be well stabilized at PIT. At this moment, the emulsion was very suddenly cooled to the ambient temperature with the aid of using a cooling jacket and a cooling bath. It should be noted that the sample must be stirred within a cooling jacket and the temperature should be suddenly declined in order to prevent the phase separation and also to ensure the formation of a stable oil-in-water emulsion. Obviously, the mentioned heating which was followed by the subsequent cooling of the sample caused the breakage of the coarse droplets of the primary emulsion and the formation of a very fine and monodisperse emulsion.
Eventually, the emulsion sample was put within the rotary vacuum evaporator container, and by heating the sample at 60 °C for 5 hours while the vacuum was gradually increased up to 500 mm Hg, the cyclohexane was totally removed and a monodisperse aqueous suspension of the polymer was obtained. The schematic of the phase inversion emulsification method is illustrated in Fig. 1, and the chemical compositions of the prepared suspension samples are given in Table 1.
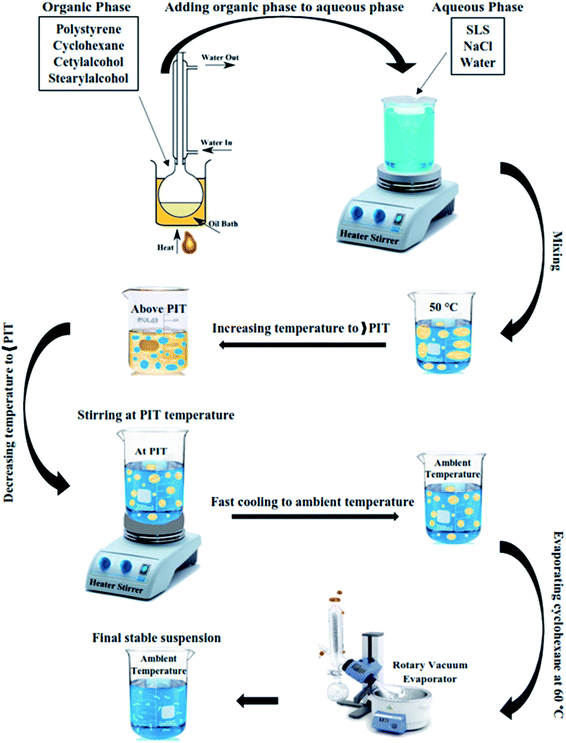 | ||
| Fig. 1 Schematic of phase inversion emulsification method for the preparation of polystyrene aqueous suspensions. | ||
| Sample name | Polystyrene (g) | SLS (g) | Cetyl alcohol (g) | Stearyl alcohol (g) | Co-surfactant ratio (stearyl/cetyl) | Initial NaCl concentration in aqueous phase (mol L−1) |
|---|---|---|---|---|---|---|
| PS-1 | 4.00 | 1.70 | 2.04 | 1.36 | 0.66 | 3 × 10⁻³ |
| PS-2 | 4.00 | 1.70 | 2.90 | 0.55 | 0.18 | 3 × 10⁻³ |
| PS-3 | 4.00 | 1.70 | 2.04 | 1.36 | 0.66 | 1 × 10⁻² |
| PS-4 | 4.00 | 1.70 | 2.04 | 1.36 | 0.66 | 5 × 10⁻² |
| PS-5 | 4.00 | 1.70 | 2.04 | 1.36 | 0.66 | 1 × 10⁻¹ |
2.3. Methods of measuring stability and sample characterizations
 | (1) |
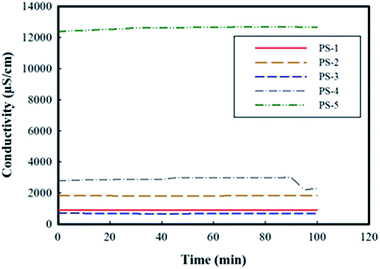
Conductivity measurements were carried out in two different stages of the experiments. Once it was employed during the emulsification process to monitor the changes in the conductivity of samples versus temperature in order to determine the phase inversion temperature. In fact, the sudden variation in the conductivity of samples was attributed to the phase inversion of the emulsions. After the preparation of the polymer suspensions, the conductivity measurements were used again in a different manner to evaluate the stability of suspensions.
3. Results and discussions
3.1. Identification of phase inversion temperature
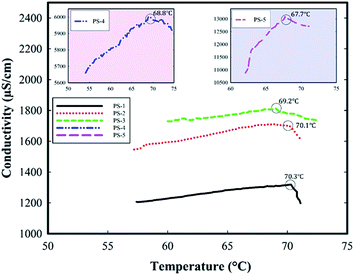
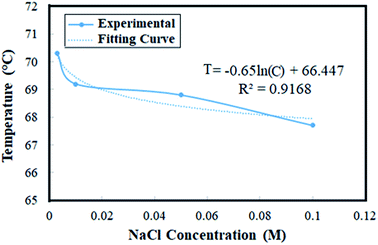
The visual observation of phase inversion temperature is very difficult since not only it happens very rapidly but also the emulsions are mostly turbid making the direct observation challenging. As such, the indirect methods of identification, observation, and visualization are required. Conductivity is the most prevalent and common method for the observation and identification of the inversion temperature via measuring the electrical conductivity in the emulsions. In such cases, the conductivity depends on the type and composition of the emulsions. In order to activate the conductivity measurements, the addition of electrolytes, e.g. NaCl, to the aqueous phase of the emulsions is a common practice. Where an O/W emulsion inverts into a W/O, since the new continuous phase is not conductive, the inversion point becomes identified through a sudden increase in the electrical resistance.22In the current research, the phase inversion temperature for a number of emulsions containing different concentrations of NaCl electrolyte, see Table 1, were investigated through conductivity measurement and the results are shown in Fig. 2. The data of phase inversion temperatures are also provided in Table 2, and the PIT curve versus the salt concentration in the aqueous phase is shown in Fig. 3.
| Sample name | PS-1 | PS-2 | PS-3 | PS-4 | PS-5 |
| NaCl concentration (mol L−1) | 3 × 10⁻³ | 3 × 10⁻³ | 1 × 10⁻² | 5 × 10⁻² | 1 × 10⁻¹ |
| Phase inversion temperature (°C) | 70.1 | 70.3 | 69.2 | 68.8 | 67.7 |
As it is shown in Fig. 2, by increasing the salt concentration from 0.003 to 0.100 M, the electrical conductivity is increased from 1000 to 12![[thin space (1/6-em)]](https://www.rsc.org/images/entities/char_2009.gif) 000 μS cm−1. An increase in the salt concentration raises the ionic compaction and increases the internal pressure of the solution. As such, the interactions among the non-ionic surfactant, i.e. the co-surfactants here, and water molecules are weakened and the activity of surfactant turns toward the hydrophobicity, i.e. HLB decreases.23 Therefore, by increasing the salt concentration, the solubility of the co-surfactant in the aqueous phase decreases and that lowers the PIT.24,25 Meanwhile, increasing the salt concentration would alter the interfacial tension in the emulsion and thus the minimum surface tension, which is expected to occur at the PIT, appears at a lower temperature.17
000 μS cm−1. An increase in the salt concentration raises the ionic compaction and increases the internal pressure of the solution. As such, the interactions among the non-ionic surfactant, i.e. the co-surfactants here, and water molecules are weakened and the activity of surfactant turns toward the hydrophobicity, i.e. HLB decreases.23 Therefore, by increasing the salt concentration, the solubility of the co-surfactant in the aqueous phase decreases and that lowers the PIT.24,25 Meanwhile, increasing the salt concentration would alter the interfacial tension in the emulsion and thus the minimum surface tension, which is expected to occur at the PIT, appears at a lower temperature.17
Here one may raise the question that behind the PIT, the conductivity should decrease very rapidly, while the conductivity of the emulsions provided in Fig. 2 declined not fast enough to prove that it was the PIT. To answer this question, in cases where the amount of salt is very low, as in this study, only a gradual decrease in the conductivity is observed. This observation is consistent with the experimental results provided in the literature.26,27 It should be also noted that as we continued to increase the temperature, the conductivity continued to decrease.
Fig. 3 shows that by increasing the salt concentration from 0.003 to 0.100 M, the phase inversion temperature is gradually decreased from 70.1 to 67.7 °C. The equation governing this decreasing curve is also provided in Fig. 3. As it was predictable, the results reveal that an increase in the salt concentration increases the electrical conductivity and somewhat lowers the phase inversion temperature. Obviously, the increase in the salt concentration leads the ionic strength to increase and then enhances the electrical conductivity of the solution.
3.2. Characteristics of the prepared suspensions
 | ||
| Fig. 4 Visual stability of suspension samples after 7 days; (a) PS-1, (b) PS-2, (c) PS-3, (d) PS-4, (e) PS-5. | ||
| Samples | PS-1 | PS-2 | PS-3 | PS-4 | PS-5 |
| H (%) | 0 | 5 | 10 | 20 | 30 |
In the stage of emulsification, by increasing the salt concentration, the interactions among the co-surfactants and water molecules gets weakened and the co-surfactants become more hydrophobic. In fact, addition of salt leads to the dehydration of co-surfactant molecules and thus their tendency towards hydrophobicity.17,27 Meanwhile, it appears that increase in the salt concentration, simultaneously with lowering the tendency of co-surfactant molecules towards water, raises the interfacial tension.17 The increase in the interfacial tension leads to the formation of bigger emulsion droplets; thereby increasing the probability of further aggregation of suspended polymer particles within the emulsion droplets. As such, increase in the salt concentration can lead to the formation of suspensions of bigger particle sizes, i.e. less stable suspensions.
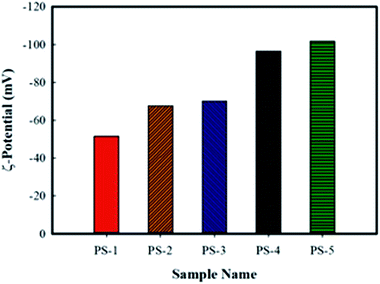
The presence of a net charge at the particle surface affects the distribution of ions in the surrounding surface area, and as a result the concentration of ions with the opposite charge of the particle increases close to the surface. The liquid layer around the particle is divided into two parts. An inner region (stern layer) to which ions are strongly bound and an outer region (diffuse) to which they are firmly associated. So there is an electric double layer around each particle. Inside the diffuse layer there is an imaginary boundary at which ions and particles form a stable existence. When a particle moves, ions move within the boundary. Ions outside this boundary remain with the bulk material. The potential at this boundary (hydrodynamic shear surface) is called the zeta potential. Zeta potential is the best indicator for determining the electrical status of the particle surface and particle charge is often reported in terms of zeta potential. The amount of zeta potential is affected by the thickness of the electrical double layer.28 Increase in the zeta potential of the particles versus increase in the electrolyte salt concentration can be attributed to the decrease in the thickness of the electrical double layer which is surrounding the particles.29 By increasing the salt concentration, i.e. increase in the ionic strength of the solution, the shear plane moves towards the particle's surface and induces a higher opposite charge to the surface. Due to the Graham theory, the increase in the zeta potential value with the increased ionic strength indicates a significantly increased interfacial charge density.30
Meanwhile, through comparing the zeta potentials of PS-1 and PS-2 samples it turns out that increase in the ratio of cetyl/stearyl alcohols has also lead an increase in the zeta potential. It has been reported that the simultaneous use of two co-surfactants of cetyl and stearyl alcohols due to the polymorphism of these co-surfactants provides a more stable emulsion system.31 As the results of zeta measurements show, both co-surfactant ratios of 0.18 and 0.66 can provide stable emulsions, and thus appropriate suspensions. However, the application of the optimum ratio of these alcohols can further stabilize the suspension system.
It should be noted that the simultaneous use of these alcohols into the emulsion gives rise to the extension of the temperature range at which emulsions are storable without deterioration. We adapted our discussion on this issue from Fukushima et al.31 where they state: “when either cetyl alcohol or stearyl alcohol was added individually, the stability of emulsion decreased. On storage at room temperature, unstable emulsions decreased inconsistency and many particles appeared. The particles were determined to be crystals of the alcohol added. When both alcohols were included in the formulation simultaneously in the appropriate ratio, the emulsions were stable and did not show such changes. This different stability can be explained in relation to the polymorphism of the alcohols. Formulating these alcohols into the emulsion by mixture thus gives rise to the extension of the temperature range where the emulsions are storable without deterioration. So as a result changing the ratio can change the stability”. To keep up, it was expected that although the simultaneous use of the co-surfactants is necessary, however, reducing the ratio of co-surfactants as a variable, could change the stability. The reduction of the co-surfactant ratio for the polystyrene suspension is accompanied by an increase in the zeta potential and reductions in particle size and conductivity.
According to the DLVO theory, where the absolute value of the zeta potential is higher than 50 mV, the electrostatic stability prevails.32 Accordingly, from the electrostatic point of view, the samples having higher zeta potentials should possess higher stabilities;33 the principle that has been violated by reality. Therefore, the lower stability of the samples containing higher salt concentrations is attributed to the previously discussed antagonistic effect of the electrolyte concentration on the formation of fine emulsions which leads to the formation of suspensions of lower stabilities.
| Sample name | PS-1 | PS-2 | PS-3 | PS-4 | PS-5 |
| Particle average size (nm) | 425.5 | 320.3 | 586.8 | 995.0 | 1290.0 |
| Polydispersity index (PDI) | 0.50 | 0.51 | 0.43 | 0.70 | 0.84 |
The provided data on particle size, given in Table 4, reveal that the particle size increases with increasing the salt concentration. The increase in particle size of the suspension can be attributed to the increase in salt concentration during the emulsification stage. In fact, by increasing the size of the emulsion droplets, more polymer particles are placed in each droplet, resulting in a suspension with larger particles. In other words, increasing the concentration of salt in the aqueous phase leads to an increase in the interfacial tension in the O/W emulsion and thus increases the droplet size of the organic phase.17 Also, increasing the salt concentration can lead to dehydration of the hydrophilic part of the co-surfactants and thus increases their hydrophobicity; that can adversely affect the stability of the emulsion system and causes slight instability in that.17 Therefore, as explained, by increasing the salt concentration and subsequent formation of larger emulsion droplets, more particles would be accommodated within each drop of the organic phase, thereby increasing the likelihood of increasing the particle size in the suspension.
Overall, the characterization of the samples shows that the PS-1, PS-2, and PS-3 samples from the viewpoints of electrostatic repulsion among the particles as well as the particle dispersion are appropriate suspensions and the phase inversion temperature do not much difference in them. In addition, they exhibit better particle sizes and dispersion qualities than the other two samples. Therefore, only the samples PS-1 and PS-2 were examined from a rheological point of view which is provided in the next section.
3.3. Rheology measurements
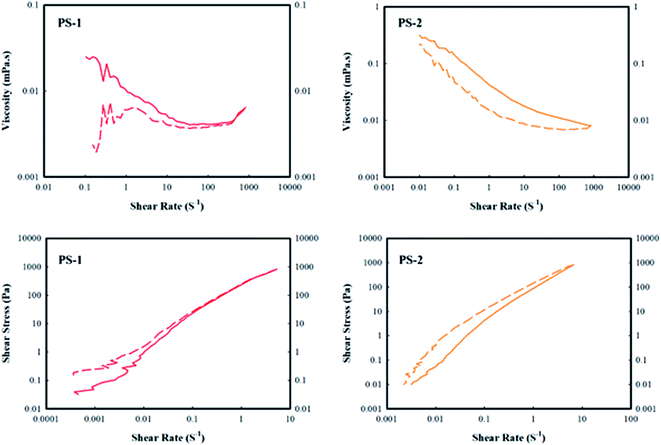
Researchers have been studying the rheology of suspensions for over a hundred years, but there are still many challenges to understanding this subject. The present study provides an overview of the rheological behavior of stable aqueous suspensions of polystyrene particles. Fig. 7 shows the viscosity and shear stress of the PS-1 and PS-2 aqueous polystyrene suspension samples versus the shear rate (strain). The viscosity diagrams in Fig. 7 reveal that the PS-1 sample exhibits a different behavior at low shear rates while the PS-2 sample behaves uniform all over the range of the applied shear rates.The reciprocating shear stress for the PS-1 sample is almost the same at high shear rates, but for the PS-2 sample, there is a gap within the shear stress of this sample in the reciprocating mode. For both samples, the shear stress is increased with increasing the shear rate. The PS-1 sample also exhibits a concave shear stress behavior at low shear rates and then the upward trend continues in a convex manner, i.e. a shear thickening and then a shear thinning behavior. However, the PS-2 sample consistently showed a shear thinning behavior, a behavior that is usually observed from the polymer suspensions. The proximity of the reciprocating shear stress behavior in the PS-1 sample confirms the stability of this sample in terms of adequate dispersion, while the difference in reciprocating behavior of the PS-2 sample indicates a partial instability in terms of the particles' aggregation.35
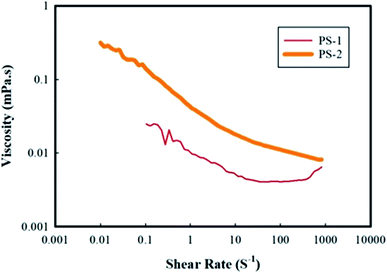
The viscosity behaviors of the two samples of PS-1 and PS-2 versus shear rate are shown in Fig. 8. According to the viscosity versus shear rate diagram, the PS-2 sample showed a shear thinning behavior at shear rates of 10−1 to 102 s−1. At low shear rates, a plateau is observed in the viscosity diagram, indicating the suspension's tendency to stabilize the regular formation of particles, i.e. the suspension tends to retain its structure. At shear rates higher than 102 s−1, however, the viscosity is independent of the shear rate and has a Newtonian behavior. Due to the shear thinning property, the polymer molecules are arranged in the direction of flow. This is due to the viscoelasticity of the polymer solution.36,37 Generally, the value of viscosity at low shear rates is responsible for creating consistency during the storage,36 while that at higher shear rates indicates the viscosity of the suspension at different stages of the process. Therefore, the presence of a small plateau at the beginning of the viscosity diagram (Fig. 8) for both samples might be an indication of the very partial aggregation of suspension particles during the storage. However, the application of stress eliminates the aggregation of particles and restores the suspension to a steady-state, i.e. reversible instability. The explanation for the existence of a plateau at the beginning of the viscosity diagram can be attributed to the fact that in colloidal suspensions, particle–particle interactions and Brownian forces play a major role in the rheological properties of the suspensions at rest. Brownian motion causes short-range gravitational forces to expand the steps between the clots to form a weak lattice or gel. Clots can be destroyed under shear stresses and show shear thinning behavior.38
Fig. 8 also reveals that the viscosity value of the PS-1 sample is less than that of the PS-2 sample. The reason for the lower viscosity may be due to the polydispersity of polystyrene suspension. If small particles are located in the vacancies within the network of larger particles, the maximum volume of particles and the minimum amount of void among the particles are obtained.39 According to previous studies, a significant reduction in the viscosity of suspensions containing a mixture of relatively coarse and fine particles was observed compared to the suspensions containing only coarse particles. On the other hand, suspensions containing large amounts of fine and medium particles show little difference in viscosity compared to the suspensions containing fine particles. As a result, where the smaller particles are placed among the larger particles, it would reduce the inter-particle gaps and ultimately reduces the viscosity. Therefore, polydispersity of particles decreases the viscosity at small stresses.40 As was provided in Table 4, the polydispersity of the PS-1 and PS-2 samples is not significantly different, but the size of particles in the PS-1 sample is larger than that in the PS-2 sample. According to the viscosity diagram in which the viscosity of the PS-1 sample is less than that of the PS-2, it seems that the sample PS-1 may contain both coarse and fine particles which reduced its viscosity.
Overall, examination of the rheology of the PS-1 and PS-2 suspension samples showed that since the prepared suspensions contain solids with a weight percentage of less than 0.25, they exhibit an almost Newtonian behavior.41 However, at such conditions, the behavior of the suspensions varies between Newtonian and non-Newtonian states. The PS-1 sample behaves shear thickening and shear thinning at low and high strain values, respectively. However, the PS-2 sample exhibits shear thinning behavior at all strain values under study.
The aqueous suspension of polystyrene was prepared by the phase inversion method and its stability was evaluated using visual observations along with zeta potential, particle size, and conductivity measurements. The rheological behavior of the suspensions was also investigated. As a summary, the physical and chemical characteristics of the PS-1 sample, which was identified as the most stable and optimal prepared suspension, are provided in Table 5.
| Characteristics | Polymer (g) | SLS (g) | Cetyl alcohol (g) | Stearyl alcohol (g) | Initial water content (mL) | Initial NaCl conc. (M) |
|---|---|---|---|---|---|---|
| PS-1 | 4.00 | 1.70 | 2.04 | 1.36 | 150 | 0.003 |
| Characteristics | Zeta potential (mV) | Average particle size (nm) | Polydispersity index | Conductivity range (μS cm−1) | Viscosity range (mPa s) | Durability of stability (day) |
|---|---|---|---|---|---|---|
| PS-1 | −51.5 | 425.5 | 0.50 | 889–894 | 0.004–0.025 | ≥7 |
4. Conclusions
• Measurement of electrical conductivity showed that by increasing the electrolyte salt concentration, the phase inversion temperature decreases.• Visual observations revealed that increasing the salt concentration reduces the stability of the final prepared suspension.
• All prepared suspensions have a zeta potential of less than −50 mV. Therefore, according to DLVO theory, they are electrostatically stable. Increasing the salt concentration leads to decreasing the thickness of the electrical double layer and thus increasing the absolute value of the zeta potential.
• The conductivity measurement of suspensions revealed that the PS-1, PS-2 and PS-3 samples have viable stability, i.e. no accumulation of particles was observed on the measuring probe and the conductivity was almost constant over time.
• The results of particle size measurements exhibited that increasing the salt concentration leads to increasing the particle size and also, in some cases, increasing the polydispersity index. The optimal value of the polydispersity belongs to the PS-3 sample and the particle size of the PS-2 sample was minimal among the samples. Nevertheless, the results revealed that the PS-1 sample possesses desirable values in terms of particle size and polydispersity index.
• Increasing the salt concentration adversely affects the stability and structure of the final suspensions made by the phase inversion method. However, variation in the ratio and concentrations of co-surfactants exhibited little effect on the particle size and stability of the suspensions. Given that the PS-1 sample was different from the PS-3 sample only in the amount of salt, their phase inversion temperature and stability were not much different.
• The rheology of the PS-1 sample exhibited shear thickening and shear thinning at low and high strain values, respectively. A plateau was also observed in the viscosity of both PS-1 and PS-2 samples at low strain values, indicating a partial instability that disappears by applying stress to the suspension sample.
• The results of rheological examinations of PS-2 sample showed that this sample is shear thinning and has viscoelastic behavior. Changing the amount of co-surfactant ratio resulted only in a slight change in the rheological behavior of the suspension samples.
Author contributions
Zahra Dastbaz: conceptualization, methodology, formal analysis, investigation, data curation, original draft preparation and visualization. Shabnam Nargesi Dana: formal analysis, investigation and data curation. Seyed Nezameddin Ashrafizadeh: writing – original draft, writing – review & editing, resources and supervision.Conflicts of interest
The authors declare that they have no known competing financial interests or personal relationships that could have appeared to influence the work reported in this paper.Acknowledgements
This work was supported by Iran National Science Foundation (INSF) [grant number 97018159].References
- Z. Dastbaz and S. N. Ashrafizadeh, Preparation, stabilization, and characterization of polyisobutylene aqueous suspension, Colloid Polym. Sci., 2020, 298, 1335–1347, DOI:10.1007/s00396-020-04727-z.
- F. Boscán, M. J. Barandiaran and M. Paulis, From miniemulsion to nanoemulsion polymerization of superhydrophobic monomers through low energy phase inversion temperature, J. Ind. Eng. Chem., 2018, 58, 1–8, DOI:10.1016/j.jiec.2017.08.052.
- Y. Sasaki, N. Konishi, M. Kasuya, M. Kohri, T. Taniguchi and K. Kishikawa, Preparation of size-controlled polymer particles by polymerization of O/W emulsion monomer droplets obtained through phase inversion temperature emulsification using amphiphilic comb-like block polymers, Colloids Surf., A, 2015, 482, 68–78, DOI:10.1016/j.colsurfa.2015.04.019.
- M. Elgammal, R. Schneider and M. Gradzielski, Preparation of latex nanoparticles using nanoemulsions obtained by the phase inversion composition (PIC) method and their application in textile printing, Colloids Surf., A, 2015, 470, 70–79, DOI:10.1016/j.colsurfa.2015.01.064.
- J. Gutiérrez, C. González, A. Maestro, I. Solè, C. Pey and J. Nolla, Nano-emulsions: new applications and optimization of their preparation, Curr. Opin. Colloid Interface Sci., 2008, 13(4), 245–251, DOI:10.1016/j.cocis.2008.01.005.
- A. Maali and M. H. Mosavian, Preparation and application of nanoemulsions in the last decade (2000–2010), J. Dispersion Sci. Technol., 2013, 34(1), 92–105, DOI:10.1080/01932691.2011.648498.
- K. Thananukul, A. Petchsuk, W. Supmak, P. Chaiyasat, A. Chaiyasat and P. Opaprakasit, Preparation of crosslinked poly(lactic acid-co-glycidyl methacrylate) microspheres by phase inversion emulsification, Chiang Mai J. Sci., 2018, 45(5), 2048–2058 CAS.
- A. Kumar, S. Li, C. M. Cheng and D. Lee, Recent developments in phase inversion emulsification, Ind. Eng. Chem. Res., 2015, 54(34), 8375–8396, DOI:10.1021/acs.iecr.5b01122.
- G. P. Mack, Aqueous polyisobutylene emulsions, US Pat., 2389796, 1945 Search PubMed.
- M. J. Rosen and J. T. Kunjappu, Surfactants and interfacial phenomena, John Wiley & Sons, New York, 3rd edn, 2004 Search PubMed.
- T. Tharwat, P. Izquierdo, J. Esquena and C. Solans, Formation and stability of nano-emulsions, Adv. Colloid Interface Sci., 2004, 9, 108–109, DOI:10.1016/j.cis.2003.10.023.
- J. Galindo-Alvarez, D. Boyd, P. Marchal, C. Tribet, P. Perrin, E. Marie-Bègue, A. Durand and V. Sadtler, Miniemulsion polymerization templates: a systematic comparison between low energy emulsification (near-PIT) and ultrasound emulsification methods, Colloids Surf., A, 2011, 374(1–3), 134–141, DOI:10.1016/j.colsurfa.2010.11.019.
- C. Solans and I. Solé, Nano-emulsions: formation by low-energy methods, Curr. Opin. Colloid Interface Sci., 2012, 17(5), 246–254, DOI:10.1016/j.cocis.2012.07.003.
- F. Jahanzad, G. Crombie, R. Innes and S. Sajjadi, Catastrophic phase inversion via formation of multiple emulsions: a prerequisite for formation of fine emulsions, Chem. Eng. Res. Des., 2009, 87(4), 492–498, DOI:10.1016/j.cherd.2008.11.015.
- K. Kim, L. Sperling, A. Klein and G. Wignall, Characterization of film formation from direct miniemulsified polystyrene latex particles via SANS, Macromolecules, 1993, 26(17), 4624–4631, DOI:10.1021/ma00069a032.
- N. Mohammadi, K. Kim, L. Sperling and A. Klein, Direct miniemulsification of anionically synthesized polystyrene to form uniform submicrometer particles, J. Colloid Interface Sci., 1993, 157(1), 124–130, DOI:10.1006/jcis.1993.1165.
- F. Pourjavaheri-Jad, R. Parthasarathy, N. Kao, R. Guang and Y. Ngothai, Properties study of MgCl2 on n-decane/Brij 30/aqueous phase nano-emulsion systems prepared by PIT method, 2nd International Conference on Nanotechnology: Fundamentals and Applications, Ottawa, Canada, July, 2011, pp. 27–29 Search PubMed.
- A. Perazzo, V. Preziosi and S. Guido, Phase inversion emulsification: current understanding and applications, Adv. Colloid Interface Sci., 2015, 222, 581–599, DOI:10.1016/j.cis.2015.01.001.
- C. Zheng, Y. Cheng, Q. Wei, X. Li and Z. Zhang, Suspension of surface-modified nano-SiO2 in partially hydrolyzed aqueous solution of polyacrylamide for enhanced oil recovery, Colloids Surf., A, 2017, 524, 169–177, DOI:10.1016/j.colsurfa.2017.04.026.
- V. J. Sovilj and L. B. Petrović, Influence of hydroxypropylmethyl cellulose–sodium dodecylsulfate interaction on the solution conductivity and viscosity and emulsion stability, Carbohydr. Polym., 2006, 64(1), 41–49, DOI:10.1016/j.carbpol.2005.10.030.
- F. Greco, G. D'Avino and P. Maffettone, Rheology of a dilute suspension of rigid spheres in a second order fluid, J. Non-Newtonian Fluid Mech., 2007, 147(1–2), 1–10, DOI:10.1016/j.jnnfm.2007.06.002.
- J. M. Lee, H. J. Shin and K. H. Lim, Morphologies of three-phase emulsions of the ternary nonionic amphiphile/oil/water systems and their determination by electrical method, J. Colloid Interface Sci., 2003, 257(2), 344–356, DOI:10.1016/S0021-9797(02)00051-6.
- A. A. M. Sharif, A. M. Astaraki, P. A. Azar, S. A. Khorrami and S. Moradi, The effect of NaCl and Na2SO4 concentration in aqueous phase on the phase inversion temperature O/W nanoemulsions, Arabian J. Chem., 2012, 5(1), 41–44, DOI:10.1016/j.arabjc.2010.07.021.
- H. Kunieda, N. Yano and C. Solans, The stability of gel—emulsions in a water/nonionic surfactant/oil system, Colloids Surf., 1989, 36(3), 313–322, DOI:10.1016/0166-6622(89)80246-X.
- K. Shinoda and H. Takeda, The effect of added salts in water on the hydrophile–lipophile balance of nonionic surfactants: the effect of added salts on the phase inversion temperature of emulsions, J. Colloid Interface Sci., 1970, 32(4), 642–646, DOI:10.1016/0021-9797(70)90157-8.
- S. Mashhadi, H. Javadian, I. Tyagi, S. Agarwal and V. K. Gupta, The effect of Na2SO4 concentration in aqueous phase on the phase inversion temperature of lemon oil in water nano-emulsions, J. Mol. Liq., 2016, 215, 454–460, DOI:10.1016/j.molliq.2016.01.045.
- G. Ren, Z. Sun, Z. Wang, X. Zheng, Z. Xu and D. Sun, Nanoemulsion formation by the phase inversion temperature method using polyoxypropylene surfactants, J. Colloid Interface Sci., 2019, 540, 177–184, DOI:10.1016/j.jcis.2019.01.018.
- J. H. Masliyah and S. Bhattacharjee, Electrokinetic and colloid transport phenomena, John Wiley & Sons, Hoboken, New Jersey, 2006 Search PubMed.
- B. Midmore and R. Hunter, The effect of electrolyte concentration and co-ion type on the ζ-potential of polystyrene lattices, J. Colloid Interface Sci., 1988, 122(2), 521–529, DOI:10.1016/0021-9797(88)90387-6.
- F. Yang, W. Wu, S. Chen and W. Gan, The ionic strength dependent zeta potential at the surface of hexadecane droplets in water and the corresponding interfacial adsorption of surfactants, Soft Matter, 2016, 13(3), 638–646, 10.1039/C6SM02174C.
- S. Fukushima, M. Takahashi and M. Yamaguchi, Effect of cetostearyl alcohol on stabilization of oil-in-water emulsion: I. Difference in the effect by mixing cetyl alcohol with stearyl alcohol, J. Colloid Interface Sci., 1976, 57(2), 201–206, DOI:10.1016/0021-9797(76)90193-4.
- L. L. Schramm, Emulsions, foams, suspensions, and aerosols: microscience and applications, Wiley-VCH, Weinheim, Germany, 2014 Search PubMed.
- D. J. Shaw, Introduction to colloid and surface chemistry, Butterworths, London, 3rd edn, 1980 Search PubMed.
- S. Bhattacharjee, DLS and zeta potential – what they are and what they are not?, J. Controlled Release, 2016, 235, 337–351, DOI:10.1016/j.jconrel.2016.06.017.
- M. Larsson, A. Hill and J. Duffy, Suspension stability; why particle size, zeta potential and rheology are important, Annual Transactions of the Nordic Rheology Society, 2012, vol. 20, pp. 209–214 Search PubMed.
- E. Morris and L. Taylor, Oral perception of fluid viscosity, Prog. Food Nutr. Sci., 1982, 6, 285–296 CAS.
- S. Race, Improved product quality through viscosity measurement, Food Technol., 1991, 45(7), 86–88 Search PubMed.
- J. A. Molina-Bolívar, F. Galisteo-González and R. Hidalgo-Alvarez, Colloidal stability of protein–polymer systems: a possible explanation by hydration forces, Phys. Rev. E: Stat. Phys., Plasmas, Fluids, Relat. Interdiscip. Top., 1997, 55(4), 4522, DOI:10.1103/PhysRevE.55.4522.
- Z. Ai, R. Deng, Q. Zhou, S. Liao and H. Zhang, High solid content latex: preparation methods and application, Adv. Colloid Interface Sci., 2010, 159(1), 45–59, DOI:10.1016/j.cis.2010.05.003.
- H. M. Laun, Rheological properties of aqueous polymer dispersions, Angew. Makromol. Chem., 1984, 123(1), 335–359, DOI:10.1002/apmc.1984.051230115.
- S. Mueller, E. W. Llewellin and H. M. Mader, The rheology of suspensions of solid particles, Proc.: Math., Phys. Eng. Sci., 2010, 466(2116), 1201–1228, DOI:10.1098/rspa.2009.0445.
| This journal is © The Royal Society of Chemistry 2021 |

