DOI:
10.1039/D1RA02188E
(Paper)
RSC Adv., 2021,
11, 15710-15721
The exploration of the crystal nucleation parameters and physico-chemical analysis of a single crystal: 2-amino-4,6-dimethoxypyrimidinium hydrogen (2R,3R)-tartrate 2-amino-4,6-dimethoxypyrimidine
Received
19th March 2021
, Accepted 9th April 2021
First published on 11th May 2021
Abstract
This paper discusses the structural orientations and the physico-chemical properties of a single crystal of 2-amino-4,6-dimethoxypyrimidinium hydrogen (2R,3R)-tartrate 2-amino-4,6-dimethoxypyrimidine (2ADT). The experimental investigation of the properties of the compound improves the potential for the utilization of the crystalline compound in the fabrication of optical limiting and nonlinear optical devices. For the growth process, an organic nonlinear optical crystal of 2ADT is synthesized conventionally at varying molar concentrations to achieve an excellent yield. The structural orientations and refinements of the compound are identified and discussed with reference to a single crystal X-ray diffraction study and its supporting computations. The results of the experimental analysis via UV-vis-NIR spectrometry and a z-scan setup with a laser beam source are used in an in-depth discussion on the linear and nonlinear optical properties of the crystal together with its damage threshold induced by a Nd:YAG laser beam at 1064 nm. With optical transparency of 55% in the entire visible region, a lower cut-off wavelength at 228 nm, and a bandgap at 5.2 eV, the crystal was demonstrated to be suitable for use in optical device fabrication. The thermogravimetrically assessed thermal stability of 2ADT was examined up to 147 °C. In addition, the thermodynamic parameters responsible for activation reactions are also discussed because these give information about the material's thermal behavior. An optical limiting study revealed that the transmitted output power increases linearly with the input power at about 1.89 mW cm−2.
1. Introduction
In the most general sense, nonlinear optical devices (NLO) are derived from crystalline components, and so understanding the physical and chemical properties is an important tool in understanding the process of crystallization from solutions. The advances in ultrafast signal processing can be pointed mainly towards the materials possessing NLO susceptibility of a higher order originating from higher order nonlinearity.1 In this respect, organic NLO materials have gained much attention in the past due to their relatively high nonlinearity and fast response. Notable benefits of organic systems over their inorganic counterparts include their high electronic susceptibility through high molecular hyperpolarizability and simple modification through standard synthetic methods.2,3 Therefore, great effort has been contributed to searching for optimal molecular crystalline materials of firm chromophoric molecules with large molecular hyperpolarizabilities using augmented orientation for large macroscopic nonlinear optical effects.1 In this vein, organic NLO materials have gained much consideration due to their relatively high nonlinearity and fast response. The advanced benefits of organic NLO assemblies over their inorganic counterparts includes their high electronic susceptibility via high molecular hyperpolarizability and the number of optical gadgets that they are incorporated in ref. 2. When aiming to regulate charge transfer, carefully identified modifications ought to be made to the donor and acceptor π-conjugate units to achieve the desired molecular properties. It is well-known that the stabilization of the crystalline compound can be attained during the strong hydrogen bond interactions in the acidic standard. Specifically, in organic crystals, wide-ranging intermolecular charge transfer sandwiched between the donor and acceptor molecules gives rise to a sturdy third order nonlinearity.3 This results in the more appealing physical and chemical properties of the NLO crystals. The association of organic compounds with their structure-oriented crystallization kinetics strongly suggests the effective modification in nucleation and growth rate. This inference is reinforced by observations of the growth of organic crystalline compounds in different conditions, including solvents, pH, molar ratios and controlled temperatures. These parameters have a profound influence on the structure determination of crystals with specific crystallographic orientations and morphology during the nucleation stage. Consequently, the goal of this research paper is to explain the breadth and depth of the physical and chemical characteristics behind crystallization in addition to the nucleation and growth parameters. Experimental observations and a pilot study that have been undertaken for the organic crystalline material, 2-amino-4,6-dimethoxypyrimidinium hydrogen (2R,3R)-tartrate 2-amino-4,6-dimethoxypyrimidine (2ADT) to provide a bulk crystal by controlled nucleation. The crystallization process is carried out using the controlled cooling method and the results are obtained from the solubility and growth kinetic measurements. In this work, all aspects of the harvested crystal, including its solubility, growth rate, structure orientation, linear and nonlinear optical, and thermal evaluations are determined and reported systematically. As far as is known, the thermal kinetics of activation and the laser induced damage threshold have been reported for the first time in order to showcase the optoelectronic device realization of the 2ADT single crystals.
2. Experimental
2.1 Crystal nucleation and growth
The most frequently used and most significant method of producing single crystals is by the solvent evaporation method and the controlled cooling rate was employed to harvest 2ADT single crystals. The expected reaction scheme to obtain the final product of 2ADT is shown in Fig. 1. The solution is first prepared by adding the salts 2-amino-4,6-dimethoxypyrimidine and L-tartaric acid (1![[thin space (1/6-em)]](https://www.rsc.org/images/entities/char_2009.gif) :
:![[thin space (1/6-em)]](https://www.rsc.org/images/entities/char_2009.gif) 1 molar ratio) to 300 mL of hot methanol solvent in order to maintain a suitable temperature throughout the process. During the stirring process, a white precipitate is formed. The precipitate was then dissolved using the same solvent. The dissolved solution was stirred continuously for 6 h to achieve homogeneity. The homogeneity of the solution is predominantly considered to determine the pH of the solution in the process of crystallization where the pH of the solution plays an important role in authorizing the crystal morphology and physical optical transparency in addition to the determination of their structure. Later, the homogeneous product was filtered and covered with a perforated polythene sheet to restrict evaporation. The pH of the solution was found to be 3.4. The whole of the solution was again placed in a constant temperature bath with a controlled temperature at 45 °C. After 45 days the crystalline product of 2ADT was harvested and it had dimensions of 7 mm × 6 mm × 2 mm as shown in Fig. 2. The crystals were collected from the mother solution, ground and recrystallized in order to obtain larger crystals, but there was no change in the dimensions. Then more 2-amino-4,6-dimethoxypyrimidine was added to give a molar ratio of 2
1 molar ratio) to 300 mL of hot methanol solvent in order to maintain a suitable temperature throughout the process. During the stirring process, a white precipitate is formed. The precipitate was then dissolved using the same solvent. The dissolved solution was stirred continuously for 6 h to achieve homogeneity. The homogeneity of the solution is predominantly considered to determine the pH of the solution in the process of crystallization where the pH of the solution plays an important role in authorizing the crystal morphology and physical optical transparency in addition to the determination of their structure. Later, the homogeneous product was filtered and covered with a perforated polythene sheet to restrict evaporation. The pH of the solution was found to be 3.4. The whole of the solution was again placed in a constant temperature bath with a controlled temperature at 45 °C. After 45 days the crystalline product of 2ADT was harvested and it had dimensions of 7 mm × 6 mm × 2 mm as shown in Fig. 2. The crystals were collected from the mother solution, ground and recrystallized in order to obtain larger crystals, but there was no change in the dimensions. Then more 2-amino-4,6-dimethoxypyrimidine was added to give a molar ratio of 2![[thin space (1/6-em)]](https://www.rsc.org/images/entities/char_2009.gif) :
:![[thin space (1/6-em)]](https://www.rsc.org/images/entities/char_2009.gif) 1, and the pH was measured to be 4.7. The solution was left undisturbed to ensure proper crystallization occurred. After 27 days, a crystal of a much larger size was harvested, as shown in Fig. 3. The larger size occurred because the supersaturation ratio played a larger role in faster crystallization of the 2ADT material. The larger size crystals which occurred after the second of addition of 2-amino-4,6-dimethoxypyrimidine may have led to an increase in the concentration of H+ ions, and thus ensured a shift in the equilibrium condition for forming molecular species, ion pairs.4 Hence the crystal with the varied molar ratio (2
1, and the pH was measured to be 4.7. The solution was left undisturbed to ensure proper crystallization occurred. After 27 days, a crystal of a much larger size was harvested, as shown in Fig. 3. The larger size occurred because the supersaturation ratio played a larger role in faster crystallization of the 2ADT material. The larger size crystals which occurred after the second of addition of 2-amino-4,6-dimethoxypyrimidine may have led to an increase in the concentration of H+ ions, and thus ensured a shift in the equilibrium condition for forming molecular species, ion pairs.4 Hence the crystal with the varied molar ratio (2![[thin space (1/6-em)]](https://www.rsc.org/images/entities/char_2009.gif) :
:![[thin space (1/6-em)]](https://www.rsc.org/images/entities/char_2009.gif) 1) was harvested on day 27 with dimensions of 27 mm × 13 mm × 11 mm, and the controlled rate of crystalline growth was clearly seen. Thus, by controlling the molar ratio, the growth process of crystalline material could also be regularized in terms of size and morphology.
1) was harvested on day 27 with dimensions of 27 mm × 13 mm × 11 mm, and the controlled rate of crystalline growth was clearly seen. Thus, by controlling the molar ratio, the growth process of crystalline material could also be regularized in terms of size and morphology.
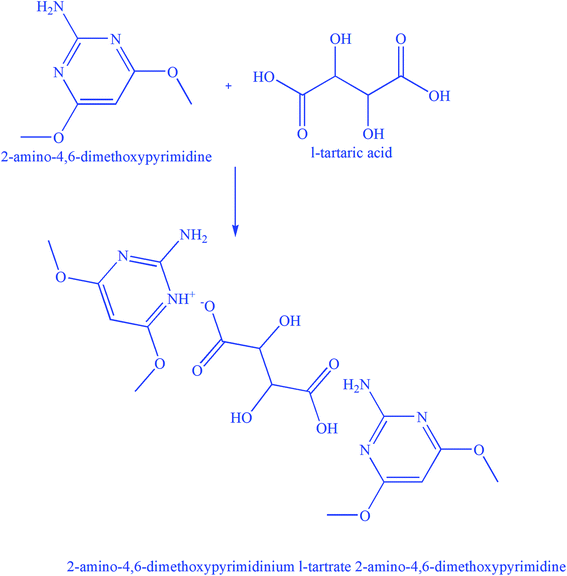 |
| | Fig. 1 Reaction scheme of 2ADT. | |
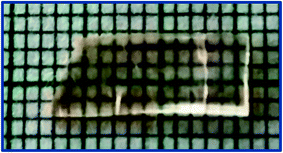 |
| | Fig. 2 An as-grown 2ADT crystal at a 1![[thin space (1/6-em)]](https://www.rsc.org/images/entities/char_2009.gif) : :![[thin space (1/6-em)]](https://www.rsc.org/images/entities/char_2009.gif) 1 molar concentration. 1 molar concentration. | |
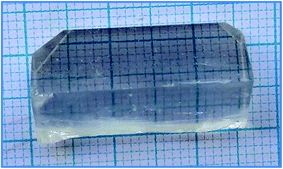 |
| | Fig. 3 An as-grown 2ADT crystal at a 2![[thin space (1/6-em)]](https://www.rsc.org/images/entities/char_2009.gif) : :![[thin space (1/6-em)]](https://www.rsc.org/images/entities/char_2009.gif) 1 molar concentration. 1 molar concentration. | |
2.2 Solubility
Good optical quality 2ADT crystals were ground and used for solubility studies in order to validate the saturation of the compound. The solubility data was taken as the function of the temperature, ranging from 30 °C to 50 °C with 5 °C intervals, in a constant temperature water bath with ±0.01 °C precision. With reference to the solubility data of the 2ADT product, the solubility at 50 °C was found to be 37.4 g/100 mL as shown in Fig. 4, and the solubility of the material was revealed to have positive solubility, when the concentration of the solution increased as the temperature increased. Positive solubility can contribute towards the endothermic reaction.4
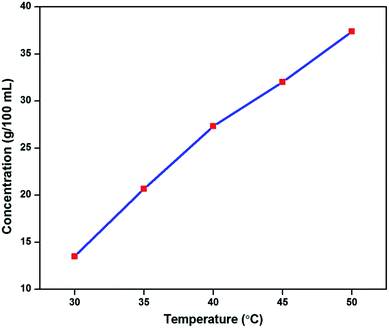 |
| | Fig. 4 Solubility curve of the 2ADT compound. | |
2.3 Nucleation kinetics
The initial formation of crystals, i.e., the process of nucleation and the purpose of its kinetic parameter measurements were examined experimentally, with the aim of characterizing the growth mechanism of the crystalline material. The intended nucleation is achieved as a result of specks of crystals obtained upon extending the limits of saturation. Nucleation in the solution is supersaturated, under isothermal conditions. Beyond this limit, the phase transformation of the compound occurs in a continuous process by a controlled thermodynamic potential. The experimental conditions, including the concentration, may be utilized to achieve a suitable physical and chemical mechanism in a time-dependent manner based on the phase stability. Potentially, the transformation of phase is typically identified with nucleation kinetics where the crystallization process will be effected in the region of metastability at supersaturation, and hence, the metastable zone width was determined. The nucleation parameter near the limit of supersaturation determines the kinetics of nucleation which stabilizes the formation of crystals. The calculated volume of the saturated solution was prepared on the basis of solubility data using a conventional polythermal method. The entire volume of the solution was maintained at the saturation temperature in a constant temperature water bath (CTB). To determine the metastable zone width, the CTB was set at 5 °C excess temperature and the water was stirred to attain homogeneity.5 On reaching the required temperature and concentration, the solution temperature was then allowed to decrease until the first speck of the visible crystal was observed by a direct visualisation method. The specific temperature of this critical nucleus was noted. This procedure was followed for the remaining temperatures and the data are plotted in Fig. 5. The results in Fig. 5, confirmed that the reliable path between the solubility curve and nucleation curve represented the metastable zone width responsible for the crystallization process of 2ADT. From reports in the literature, expedient growth of bulk single crystals is considered to ensure a wide metastable zone width region. Simultaneously it is also mandatory to ration the time taken for the materialization of a critical nucleus, after reaching supersaturation. The measurement of time taken with respect to temperature is termed as the induction period and it is typically very short and essential for crystallization to occur. The induction period was typically resolved by an isothermal method supporting the kinetics of nucleation.5 The induction period for particular supersaturation ratios at 40 °C is shown in Fig. 6. From Fig. 6, it is observed that the induction period decreases exponentially with supersaturation which evidently increases the rate of nucleation. Therefore, the study of induction period against supersaturation gives a clear prediction on the growth rate and morphology of the 2ADT crystal.
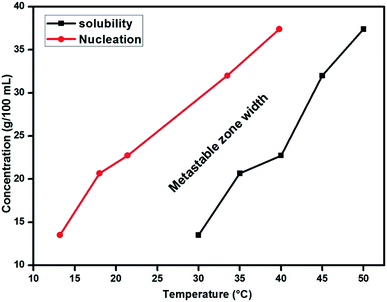 |
| | Fig. 5 The metastable zone width of 2ADT. | |
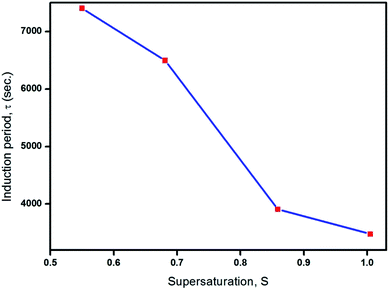 |
| | Fig. 6 Induction period vs. supersaturation for a 2ADT crystal. | |
3. Results and discussion
3.1 Single crystal X-ray diffraction study
The compound crystallizes in the monoclinic P21 space group with two molecules in the unit cell (a = 7.3245(2) Å, b = 15.8349(6) Å, c = 8.9264(3) Å, α = 90°, β = 105.251(2)°, γ = 90° and Z = 2).6 The three-dimensional molecular structure of this compound was determined by XRD7 crystallography using SHELXS-97 and later refined by SHELXL-16 to obtain a final R-value of 4.91%. The asymmetric unit of the 2ADT comprised 2-amino-4,6-dimethoxypyrimidine (C6H9N3O2), 2-amino-4,6-dimethoxypyrimidinium hydrogen (C6H10N3O2+) and L-tartrate (C4H5O6−). The structures of the neutral 2-amino-4,6-dimethoxypyrimidine (2ADP), 2-amino-4,6-dimethoxypyrimidinium hydrogen cation and L-tartrate anion molecule were obtained in a 1![[thin space (1/6-em)]](https://www.rsc.org/images/entities/char_2009.gif) :
:![[thin space (1/6-em)]](https://www.rsc.org/images/entities/char_2009.gif) 1
1![[thin space (1/6-em)]](https://www.rsc.org/images/entities/char_2009.gif) :
:![[thin space (1/6-em)]](https://www.rsc.org/images/entities/char_2009.gif) 1 ratio after refinement of the XRD data. The mean planes of the cation and anion were inclined to one another by 18.4(3)° and the neutral 2ADP and anion were inclined to one another by 32.3(3)°. In the cation, one of the nitrogen atoms (N1A) in the pyrimidine ring was protonated and this was reflected in an increase in bond angle at N1A[C6A–N1A–C2A = 119.9(2)°], when compared with the unprotonated atom (N3A) [C4A–N3A–C2A = 116.8(2)°]. The values were compared with the corresponding angle of (N1B) [C6B–N1B–C2B = 116.9(2)°] and (N3B) [C4B–N3B–C2B = 115.9(2)°] in the neutral 2ADP. The methoxy substituent groups at C4A and C6A of the cation were essentially coplanar with the ring, the C7A–O1A–C4A–N3A and C8A–O2A–C6A–N1A torsion angles being −4.9(3)° and −178.7(2)°, respectively. For the neutral of 2ADP, the methoxy substituent groups at C4B and C6B were essentially coplanar with the ring, the C7B–O1B–C4B–N3B and C8B–O2B–C6B–N1B torsion angles being −2.2(4)° and −177.7(2)°, respectively. The anion of the L-tartrate molecule had extended conformation, which can be seen from the torsion angle C9–C10–C11–C12 = 175.3(2)°.
1 ratio after refinement of the XRD data. The mean planes of the cation and anion were inclined to one another by 18.4(3)° and the neutral 2ADP and anion were inclined to one another by 32.3(3)°. In the cation, one of the nitrogen atoms (N1A) in the pyrimidine ring was protonated and this was reflected in an increase in bond angle at N1A[C6A–N1A–C2A = 119.9(2)°], when compared with the unprotonated atom (N3A) [C4A–N3A–C2A = 116.8(2)°]. The values were compared with the corresponding angle of (N1B) [C6B–N1B–C2B = 116.9(2)°] and (N3B) [C4B–N3B–C2B = 115.9(2)°] in the neutral 2ADP. The methoxy substituent groups at C4A and C6A of the cation were essentially coplanar with the ring, the C7A–O1A–C4A–N3A and C8A–O2A–C6A–N1A torsion angles being −4.9(3)° and −178.7(2)°, respectively. For the neutral of 2ADP, the methoxy substituent groups at C4B and C6B were essentially coplanar with the ring, the C7B–O1B–C4B–N3B and C8B–O2B–C6B–N1B torsion angles being −2.2(4)° and −177.7(2)°, respectively. The anion of the L-tartrate molecule had extended conformation, which can be seen from the torsion angle C9–C10–C11–C12 = 175.3(2)°.
The crystal structure of the 2ADT is comprised of a three-dimensional network of N–H⋯O, O–H⋯N, C–H⋯O, O–H⋯O and π–π interactions which gives the following supramolecular aggregation. In the crystal, the cation of the protonated nitrogen atom (N1A) formed an intramolecular interaction with the anion atom O4 (N1A–H1A⋯O4) and the cation amino nitrogen atom (N2A) which formed an intramolecular interaction with the anion atom O3 (N2A–H2A2⋯O3). Both the N–H⋯O intramolecular hydrogen bond interactions generated an eight-membered R22(8) ring motif as shown in Fig. 7. The neutral molecule of the amino nitrogen atom (N2B) formed an intramolecular interaction with the anion atom O7 (N2B–H2B1⋯O7) and the anion atom (O8), forming an intramolecular interaction with the neutral molecule of the pyrimidine N1B atom (O8–H8⋯N1B). The N–H⋯O and O–H⋯N hydrogen bond interactions generated an eight membered R22(8) ring motif as shown in Fig. 7. In the cation and neutral molecules, the amino nitrogen N2A and N2B acted as donor atoms forming a hydrogen bond interaction with the acceptor of O5 and O3 atoms, respectively, and the anion through N2A–H2A1⋯O5i and N2B–H2B2⋯O3ii intermolecular hydrogen bonds listed in Table 1, formed approximate slabs lying parallel to plane (001) as shown in Fig. 8. The corresponding symmetry codes were (i) x, y, 1 + z and (ii) x, y, −1 + z. The C8A and C8B carbon atoms forming a hydrogen bond interaction with the acceptor of O7 and O6 atoms, respectively. It connects through anion atoms C8A–H8A1⋯O7iii and C8B–H8B2⋯O6iv hydrogen bond interactions viewed down the “a” axis as shown in Fig. 9 and the corresponding symmetry codes were (iii) 1 − x, 1/2 + y, −z and (iv) 1 − x, −1/2 + y, −z. The anion molecule of oxygen O6 as a donor atom formed a hydrogen bond interaction with the acceptor of the neutral molecule of the O1B atom (O6–H6⋯O1Bv) as shown in Fig. 10, and the corresponding symmetry code was 1 − x, 1/2 + y, −1 − z. In the crystal, the molecules were stacked in layers held together by π–π interactions, with a distance of Cg1⋯Cg2 of 3.6248(15) Å, between the centroid of the adjacent two pyrimidine ring viewed down the “a” axis as shown in Fig. 11.
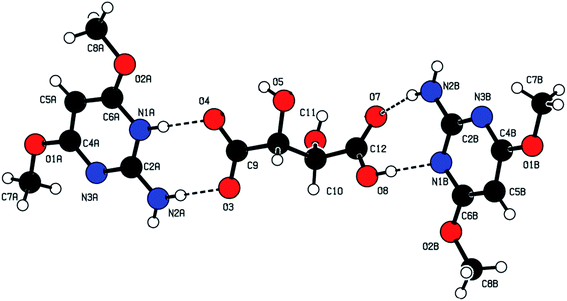 |
| | Fig. 7 The three-dimensional molecular structure of the 2ADT salt. The N–H⋯O and O–H⋯N contacts are shown as thin dashed lines. | |
Table 1 Hydrogen bond geometry for the 2ADT salt (Å and °)a
| D–H⋯A |
D–H (Å) |
H⋯A (Å) |
D⋯A (Å) |
D–H⋯A (°) |
| Symmetry codes: (i) x, y, 1 + z; (ii) x, y, −1 + z; (iii) 1 − x, 1/2 + y, −z; (iv) 1 − x, −1/2 + y, −z and (v) 1 − x, 1/2 + y, −1 − z. |
| N1A–H1A⋯O4 |
0.86 |
1.87 |
2.728 (3) |
179 |
| O8–H8⋯N1B |
0.82 |
1.82 |
2.631 (3) |
171 |
| N2B–H2B1⋯O7 |
0.86 |
2.09 |
2.935 (3) |
165 |
| N2A–H2A2⋯O3 |
0.86 |
1.96 |
2.814 (3) |
176 |
| N2A–H2A1⋯O5 (i) |
0.86 |
2.30 |
3.090 (3) |
152 |
| N2B–H2B2⋯O3 (ii) |
0.86 |
2.19 |
2.878 (3) |
137 |
| C8A–H8A1⋯O7 (iii) |
0.96 |
2.54 |
3.328 (4) |
140 |
| C8B–H8B2⋯O6 (iv) |
0.96 |
2.37 |
3.308 (3) |
166 |
| O6–H6⋯O1B (v) |
0.82 |
2.20 |
2.860 (3) |
138 |
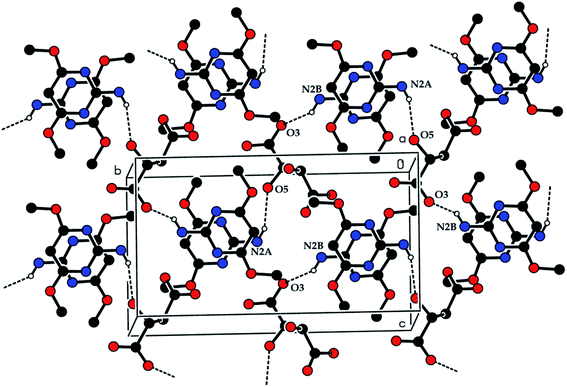 |
| | Fig. 8 The N2A–H2A1⋯O5i and N2B–H2B2⋯O3ii intermolecular hydrogen bonds. [Symmetry code: (i) x, y, 1 + z and (ii) x, y, −1 + z]. | |
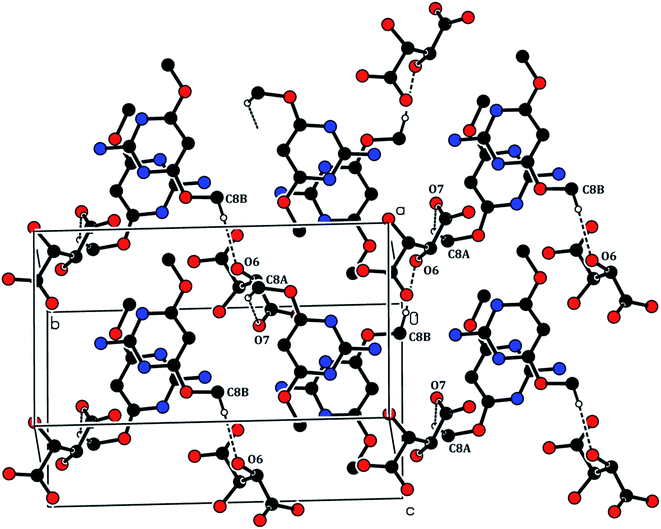 |
| | Fig. 9 The C8A–H8A1⋯O7iii and C8B–H8B2⋯O6iv hydrogen bond interactions. [Symmetry code: (iii) 1 − x, 1/2 + y, −z and (iv) 1 − x, −1/2 + y, −z]. | |
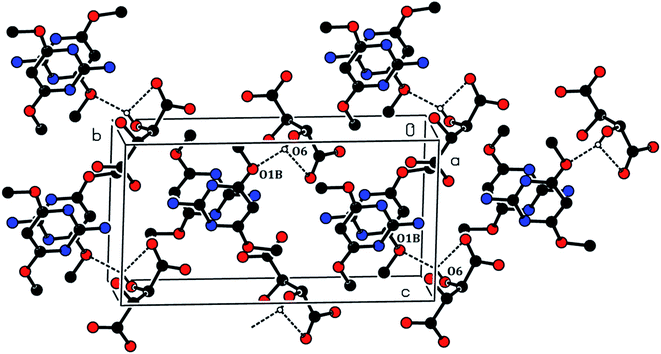 |
| | Fig. 10 The O6–H6⋯O1Bv intermolecular hydrogen bonds. [Symmetry code: (v) 1 − x, 1/2 + y, −1 − z]. | |
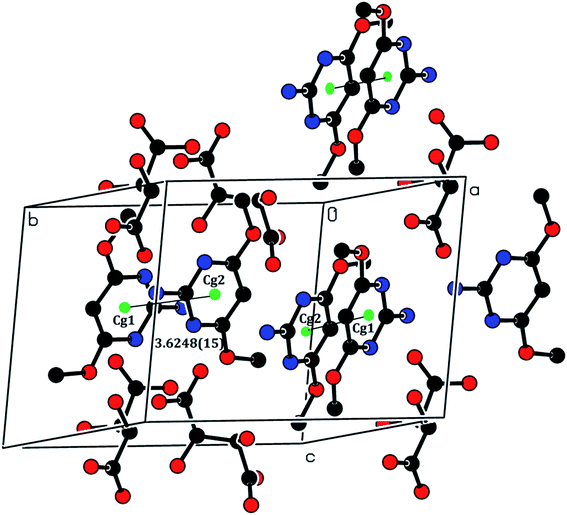 |
| | Fig. 11 The π–π interactions of the 2ADT salt viewed down the “a” axis. [Symmetry code: (vi) 2x, 1/2 + y, −z]. | |
3.2 Linear optical study
A linear optical study is a powerful analytical technique used to determine the optical properties such as transmittance, reflectance and absorbance of crystalline compounds. The linear optical behavior is processed by weak light beams, where the field will be insufficient to produce any considerable change in the properties of the medium, resulting in the linear optical behavior reported using a UV-vis-NIR study. A 3032 UV-vis-NIR spectrophotometer (Labindia) was employed to characterize the sample of 2ADT in the scan range of 190 nm to 900 nm. In general, the concentrations of the chemical structures of a compound were determined by the absorption of light across the desired optical range. A 2ADT sample with a dimension of 10 × 10 × 1 mm3 was used to determine the transmission spectra over the entire optical range. The spectra may be predominantly due to the orbital electronic transitions from a lower energy state σ and a higher energy state π.8 The transition assignments for the compound formation was also supported by the single crystal XRD data. The resultant spectrum of the 2ADT crystal sample was recorded and is shown in Fig. 12. From the data obtained it was predicted that the 2ADT crystal acquired a maximum transparency of 55% in the visible and NIR regions. The cut-off wavelength and the energy bandgap were also plotted and the graphical showed that the lower cut-off was 228 nm and the bandgap was 5.2 eV. The energy bandgap plot was supported by extrapolating the linear measure of a Tauc plot to the equivalent energy axis as shown in Fig. 13. From the obtained cut-off value, it was understood that the protonation of the 2ADT compound may be due to the electronic transition in this region with π–π* transitions at the orbital levels.9 This electron transition state pattern predominantly influenced the hyperpolarizability of the crystal. Together with the hyperpolarizability, the transmittance nature of the crystal also allowed the crystal to be a suitable material for optoelectronic device fabrications. In addition to the experimental results, a range of theoretical optical constants were used to focus on determining the relationships for extinction coefficient (k), refractive index (n) and reflectance (R) in terms of the absorption coefficient (α).10
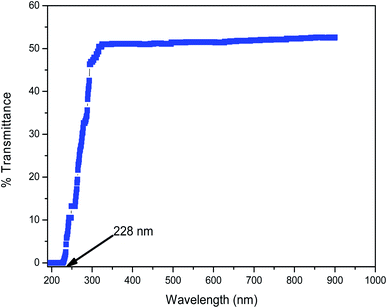 |
| | Fig. 12 The transmittance spectrum of the 2ADT crystal. | |
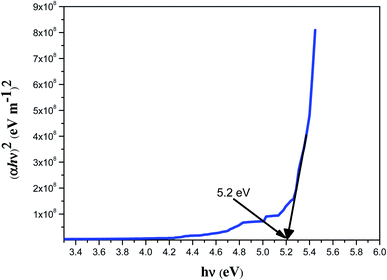 |
| | Fig. 13 The Tauc plot of the 2ADT crystal. | |
The experimentally obtained refractive index and the extinction coefficient are shown in Fig. 14 which completely relied on the wavelength of the incident radiation. Together, the refractive index and the extinction coefficient depend on the absorption coefficient (α) to support the electronic absorption of the material. As the internal effectiveness of the device depends on the absorption coefficient, the value of α can be tailored for the fabrication of the devices.11 The tapering behavior and value of the refractive index (1.412 at 532 nm) indicate that the 2ADT crystal was suitable for low dispersion applications.12 The final results of high optical transparency, low absorbance and low refractive index of the 2ADT crystal in the desired region indicate its suitability for NLO applications.
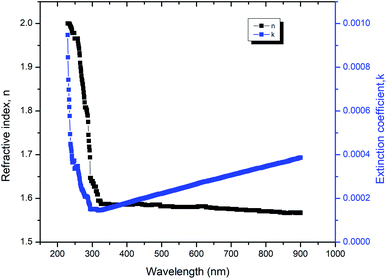 |
| | Fig. 14 Variation of n and k with wavelength. | |
3.3 Nonlinear optical study
A nonlinear optical study has the aim of describing the behavior of light in nonlinear media, including the propagation of intense light beams and their interaction with matter in all phases, such as solid, liquid, and gas. The occurrence of light-matter interaction is accepted when an incident laser beam is provided with sufficiently high intensity. The high intensity of the incident light with a strong light field changes the optical properties of the material medium, essentially relating to the refractive index (n2), susceptibility (χ(3)) and absorption coefficient (α). Reports in recent years of many experimental studies13 have suggested that the z-scan arrangement plays a crucial role in measuring the strength of photon absorption and nonlinear optics parameters when taking into consideration the typical curve conditions. The crystals of prominent materials such as ADP, KDP, and so on, with third-order optical nonlinearities have been examined extensively for use in wide-ranging applications. A nonlinear refractive index arises when two or more photons are absorbed instantaneously in a single absorption, with the absorbed power proportional to the square of the incident laser beam intensity and this pattern was observed as the change in transmittance between the peak and valley.14 The crystal sample itself acts as a thin lens with varying focal lengths as it is moved through the focal plane for both the closed and open aperture configuration.15 Based on the z-scan technique, the nonlinearity of periodic 2ADT has been studied and the results are discussed in this paper. The z-scan setup utilized in this measurement was carried out using a continuous wave (CW) semi-conductor laser light source radiation of wavelength 532 nm. The significant nonlinear optical characteristics appeared by the effect of laser light source was plotted using the optimal peak, and this had significant implications for optical applications, including light-switching, optical limiting, and surface-enhanced.16 The sample of 1 mm thickness running along the −Z to +Z axial direction of laser beam propagation was measured at two different foci regions to obtain n2 with a closed aperture alignment and β and χ(3) with open aperture alignment. The experimentally plotted closed aperture and open aperture curves with enhanced peaks with normalized transmittance are shown in Fig. 15 and 16, respectively. The experimental results of closed and open aperture curves describe the self-defocussing effect and the saturation absorption, respectively. The saturation absorption of the grown 2ADT crystal was confirmed from the open aperture curve. The quantitative results associated with the nonlinear refractive index, nonlinear absorption coefficient and optical susceptibility values for the 2ADT crystal are shown in Table 2. The calculations were carried out using standard equations.17
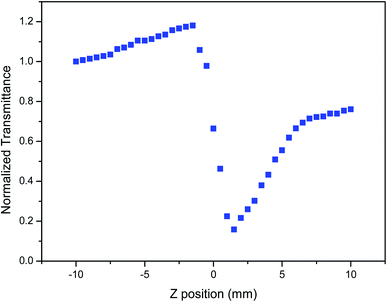 |
| | Fig. 15 The closed aperture curve of the 2ADT crystal. | |
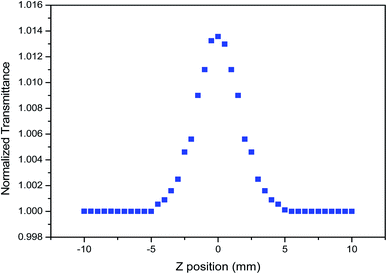 |
| | Fig. 16 The open aperture curve of the 2ADT crystal. | |
Table 2 Experimental results from the z-scan technique
| α |
n0 |
n2 × 10−4 cm2 W−1 |
β × 10−4 cm W−1 |
χ(3) × 10−6 esu |
| 0.877 |
1.88 |
−7.01 |
0.01 |
6.28 |
3.4 Laser damage threshold study
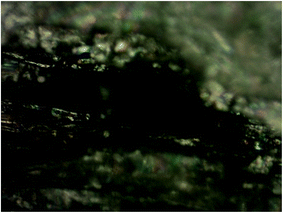
The laser induced surface damage threshold (LDT) is the extreme limit at which an optical crystalline material will be dented by a laser beam specified by the fluence (energy per unit area), intensity (a), and wavelength. Where, fluence and intensity are energy per unit area and power per unit area, respectively. The results of LDT at 1064 nm wavelength of Nd:YAG laser radiation are relevant to both transmissive and reflective optical elements. For various applications, optical components with sufficiently high optical damage, laser induced modification or destruction of a crystalline material is the intended threshold outcome. The laser-induced damage is more likely to be generated with intense pulses. For CW lasers the damage threshold can be calculated from the peak power (Pd) and beam diameter (r). For long pulses or CW lasers the primary damage mechanism tended to be thermal. Because transmitting and reflecting optics both have non-zero absorption, the laser can provide thermal energy and affect the optical quality of the crystalline materials. The output laser intensity was obtained using Q-switched lasers and with ultrafast amplifiers. For the given pulse energy of 152 mJ, the pulse duration was as short as 10 ns, and the peak power density was 3.8 GW cm−2. If such a beam was focused to a beam radius of 685 μm, an enormous optical peak intensity of 3.8 GW cm−2 was reached in the sample. The surface power density of the crystal was calculated using the relationship:
where E is the input energy (mJ), τ is the pulse width (ns) and r is the radius of the spot (mm). The laser induced damage threshold of the 2ADT crystal was compared with some of the first reported optical materials and this is presented in Table 3. The LDT pattern of the crystal is shown in Fig. 17.
Table 3 A comparison of laser induced damage threshold values of some nonlinear optical materials
| Compound |
LDT (GW cm−2) |
Ref. |
| GT |
0.344 |
18 |
| 2A4PTS |
0.36 |
19 |
| p-TTS |
0.30 |
20 |
| 2ADT |
3.80 |
Present work |
 |
| | Fig. 17 Laser-induced damage on the 2ADT crystal surface. | |
 |
| | Fig. 18 The TG-DTA curve of 2ADT. | |
3.5 Thermal study
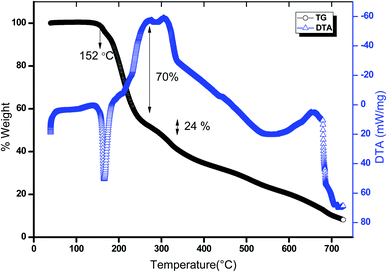
The thermal stability of 2ADT was studied using thermogravimetric (TG) and differential thermal analyses (DTA). The 2ADT sample weighing 4.576 g was analyzed using a STA 409 PL thermal analyzer (NETZSCH) in the range 30–750 °C under a nitrogen atmosphere and the results of this experiment are shown in Fig. 18. From the TG curve, it was evident that the 2ADT material was stable up to 152 °C and moisture free. The TG curve shows a two-stage weight loss pattern. A major weight loss starting from 155 °C to 230 °C with a mass change of 70% was due to the elimination of the 2amino-4,6-dimethoxypyrimidinium L-tartrate molecule. The 2-amino-4,6-dimethoxypyrimidinium L-tartrate had a mass of 306.18 g mol−1 (observed 70%, calculated 66%). The second stage weight loss was from 246 °C to 292 °C A small endotherm in the DTA curve at about 318 °C confirmed that the absorption of energy for breaking was due to the elimination of a neutral 2-amino-4,6-dimethoxypyrimidine molecule. The neutral molecule had a mass of 155.6 g mol−1 (observed 24%, calculated 33%). The decomposition process was carried out up to 750 °C with the conversion of the material into gaseous products (a mixture of CO, CO2, NO and hydrocarbons). Hence from the previous observations it was clear that the grown 2ADT crystal could be exploited for any applications below 150 °C.
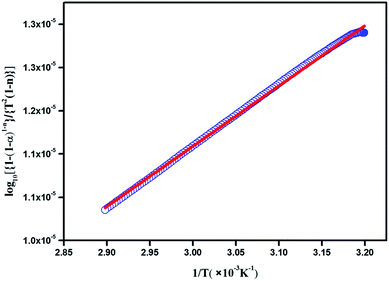
3.5.1 Thermodynamic parameters of the activation reaction. In current research, an extensive estimation of the thermodynamic parameters, including the activation energy, is necessary to judge the spontaneity of a process. The kinetic functions such as the Arrhenius constant, the enthalpy of activation, the entropy of activation and the Gibb's free energy change of decomposition were governed by the following relationships. For solid state reactions, a thermogravimetric kinetic mechanism of decomposition was determined by measuring fractional mass loss using a conversion process (αc) and the degradation rate could be accurately obtained from the Arrhenius relationship:21
where W is the actual mass at any degradation time (mg), W0 is the initial mass (mg) and Wf is the final mass at the end of thermal degradation process (mg), k is the rate constant, A is the Arrhenius constant, Ea is the activation energy, R is the gas constant and T is the temperature (K). The plot between inverse of T and log10[{1 − (1 − α)1−n}/{T2(1 − n)}] in Fig. 19 shows the effective activation energy from the slope and the Arrhenius constant from the intercept. Furthermore, the obtained values of Ea and A are absorbed to bring out the kinetic parameters such as entropy of activation (ΔS), enthalpy of activation (ΔH) and Gibb's energy (ΔG) using the following equations:22
where, Af is the frequency factor, ℏ is the Planck's constant, kB is the Boltzmann constant and T is the DTA peak temperature (K). The theoretically determined thermodynamic parameters of the activation reaction are shown in Table 4. The range of Ea values between 100 to 200 kJ mol−1 is typically high enough to determine the bond nature. The formation or the breaking of the bonds could be attributed to reliable values of Ea. The bond activation (Ea) for ADT may be due to electronic or phononic energy.23 In the process of decomposition, the dynamic Gibb's free energy change may be due to the fundamental criteria of spontaneous reaction.24 The negative scale of entropy was assigned to the highly ordered structure of the activated complex rather than to that of its reactants.25 The endothermic nature of dissociation processes were authenticated by the positive value of enthalpy.26
 |
| | Fig. 19 A plot of 1/T vs. log10[{1 − (1 − α)1−n}/{T2(1 − n)}]. | |
Table 4 The estimated kinetic parameters of the 2ADT crystal
| Kinetic parameter |
Values |
| Activation energy, Ea (kJ mol−1) |
133.47 |
| Arrhenius constant, A (s−1) |
−268.68 |
| Enthalpy of activation, ΔH (kJ mol−1) |
−58.70 |
| Entropy of activation, ΔS (Jk−1 mol−1) |
−10.96 |
| Gibb's energy, ΔG (k mol−1) |
38.41 |
3.6 Optical limiting measurements
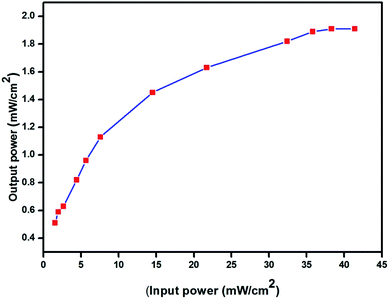
The recorded optical limiting response of the 2ADT crystal as a function of incident power which varied from 1.50 mW to 45 mW is shown in Fig. 20. It can be observed that the output power varied linearly up to an incident power of about 1.89 mW. At an incident power higher than 1.89 mW, the output power became nonlinear. Moreover, the optical limiting threshold was important if this material was to be used in the protection of human eyes.25 In general, various physical mechanisms such as the saturation absorption, and photoinduced change in the refractive index have been established to be responsible for the limitation of laser radiation.
 |
| | Fig. 20 The optical limiting behavior of the 2ADT crystal. | |
4. Conclusions
Structurally oriented single crystals of 2-amino-4,6-dimethoxypyrimidinium hydrogen (2R,3R)-tartrate 2-amino-4,6-dimethoxypyrimidine with good nonlinear optical properties have been synthesized and grown at two different molar concentrations using a solvent evaporation growth method. The crystallographic confinements were estimated and refined via a single-crystal XRD study. The optical transmittance of the 2ADT crystal showed π–π* interactions with a promising percentage of transmittance. The optical band gap and the refractive index of the 2ADT crystal were evaluated to be 5.2 eV and 1.412, respectively. A laser-source-induced nonlinear optical study with its parameters determined via the z-scan technique and the laser-induced damage threshold determined via an LDT study show that the 2ADT crystal can act as a suitable material for nonlinear optical and optoelectronic applications. The measured higher value of LDT for 2ADT of 3.8 GW cm−2 at a Nd:YAG laser wavelength of 1064 nm suggests the endurance of the crystal for use in high-power laser systems. The thermal decomposition and the corresponding stability together with the thermodynamic kinetics and the activation energy of the 2ADT crystal were assessed and computed using the results of the TG and DTA analyses. The good optical nonlinearity and optical limiting indicated that the new 2ADT crystal should find potential applications in all-optical limiting and switching devices. The results of the present investigation promise the use of the 2ADT crystal for various optical limiting and nonlinear optical applications.
Conflicts of interest
There are no conflict to declare.
References
- R. D. Wampler, N. J. Begue and G. J. Simpson, Cryst. Growth Des., 2008, 8, 2589–2594 CrossRef CAS.
- J. M. Adams and R. W. H. Small, Acta Crystallogr., Sect. B: Struct. Crystallogr. Cryst. Chem., 1974, 30, 2191–2193 CrossRef.
- K. Sangwal and E. Olczyk, Cryst. Res. Technol., 1990, 25, 65–70 CrossRef CAS.
- P. Era, R. M. Jauhar, V. Viswanathan, G. Vinitha and P. Murugakoothan, J. Mol. Struct., 2020, 1204, 127476 CrossRef CAS.
- D. A. BaldwiN, L. Denner, T. J. Egan and A. J. Markwell, Acta Crystallogr., Sect. C: Cryst. Struct. Commun., 1986, 42, 1197–1199 CrossRef.
- K. Thanigaimani, P. Thomas Muthiah and D. E. Lynch, Acta Crystallogr., Sect. C: Cryst. Struct. Commun., 2007, 63(Pt 5), 295–300 CrossRef.
- Bruker, APEX2, SAINT and SADABS, Bruker AXS Inc., Madison,Wisconsin, USA, 2009 Search PubMed.
- J. C. Monicka and C. James, J. Mol. Struct., 2014, 1075, 335–344 CrossRef CAS.
- X. Liu, X. Wang, X. Yin, S. Liu, H. Wen, L. Zhu, G. Zhang and X. Dong, CrystEngComm, 2014, 16, 930–938 RSC.
- R. W. Boyd, Nonlinear Optics, Academic Press, Newyork, 2003 Search PubMed.
- P. Era, R. M. Jauhar and P. Murugakoothan, Opt. Mater., 2020, 99, 109558–109565 CrossRef CAS.
- R. M. Jauhar, P. Era, V. Viswanathan, P. Vivek, G. Vinitha, V. Devadasan and P. Murugakoothan, New J. Chem., 2018, 42, 2439 RSC.
- Z. Li, S. Xu, L. Huang, X. Huang, L. Niu, Z. Chen, Z. Zhang, F. Zhang and K. Kasatani, Chem. Phys. Lett., 2007, 441, 123 CrossRef CAS.
- M. Dhavamurthy, G. Peramaiyan, M. Nizam Mohideen., S. Kalainathan and R. Mohan, J. Nonlinear Opt. Phys. Mater., 2015, 24(4), 1550045 CrossRef CAS.
- S. B. Monaco, L. E. Davis, S. P. Velsko, F. T. Wang, D. Eimerl and A. Zalkin, J. Cryst. Growth, 1987, 85, 252 CrossRef CAS.
- A. J. Kiran, A. Mithun, B. S. Holla, H. D. Shashikala, G. Umesh and K. Chandrasekaran, Opt. Commun., 2007, 269, 35 Search PubMed.
- P. Era, R. M. Jauhar, G. Vinitha and P. Murugakoothan, Opt. Laser Technol., 2018, 101, 127–137 CrossRef CAS.
- P. Vijayakumar, G. Anandha Babu. and P. Ramasamy, Mater. Res. Bull., 2012, 47, 957–962 CrossRef CAS.
- G. Anandha Babu. and P. Ramasamy, Spectrochim. Acta, Part A, 2011, 82, 521–526 CrossRef CAS PubMed.
- A. W. Coats and J. P. Redfern, Nature, 1964, 201, 68–69 CrossRef CAS.
- P. Era, R. M. Jauhar, P. Vivek and P. Murugakoothan, Mater. Chem. Phys., 2021, 257, 123647–123655 CrossRef CAS.
- H. Jing, S. Hong, L. Zhang, F. Gan and Y.-S. Ho, Fresenius Environ. Bull., 2011, 19, 2651–2656 Search PubMed.
- Y. Ren, L. Dan, Y. Jianhua, F. Zhao, M. Haixia, X. Kangzhen and J. Song, Bull. Korean Chem. Soc., 2010, 31, 1988–1992 CrossRef CAS.
- P. V. Dalal, K. B. Saraf, N. G. Shimpi and N. R. Shah, J. Cryst. Process Technol., 2021, 2, 156–160 CrossRef.
- S. Mallakpour, M. Dinari and M. Chin, J. Polym. Sci., Part A: Polym. Chem., 2010, 28, 685–694 CAS.
- N. K. M. N. Srinivas, S. V. , Rao, D. V. G. L. N. Rao, B. K. Kimball, M. Nakashima, B. S. Decristofano and D. N. Rao, J. Porphyrins Phthalocyanines, 2001, 5, 549–554 CrossRef CAS.
|
| This journal is © The Royal Society of Chemistry 2021 |
Click here to see how this site uses Cookies. View our privacy policy here.  Open Access Article
 *ab,
RO. MU. Jauhar
 c,
V. Viswanathand,
M. Madhangib,
G. Vinithae,
M. Basheer Ahameda and
P. Murugakoothanb
![[thin space (1/6-em)]](https://www.rsc.org/images/entities/char_2009.gif) :
:![[thin space (1/6-em)]](https://www.rsc.org/images/entities/char_2009.gif) 1 molar ratio) to 300 mL of hot methanol solvent in order to maintain a suitable temperature throughout the process. During the stirring process, a white precipitate is formed. The precipitate was then dissolved using the same solvent. The dissolved solution was stirred continuously for 6 h to achieve homogeneity. The homogeneity of the solution is predominantly considered to determine the pH of the solution in the process of crystallization where the pH of the solution plays an important role in authorizing the crystal morphology and physical optical transparency in addition to the determination of their structure. Later, the homogeneous product was filtered and covered with a perforated polythene sheet to restrict evaporation. The pH of the solution was found to be 3.4. The whole of the solution was again placed in a constant temperature bath with a controlled temperature at 45 °C. After 45 days the crystalline product of 2ADT was harvested and it had dimensions of 7 mm × 6 mm × 2 mm as shown in Fig. 2. The crystals were collected from the mother solution, ground and recrystallized in order to obtain larger crystals, but there was no change in the dimensions. Then more 2-amino-4,6-dimethoxypyrimidine was added to give a molar ratio of 2
1 molar ratio) to 300 mL of hot methanol solvent in order to maintain a suitable temperature throughout the process. During the stirring process, a white precipitate is formed. The precipitate was then dissolved using the same solvent. The dissolved solution was stirred continuously for 6 h to achieve homogeneity. The homogeneity of the solution is predominantly considered to determine the pH of the solution in the process of crystallization where the pH of the solution plays an important role in authorizing the crystal morphology and physical optical transparency in addition to the determination of their structure. Later, the homogeneous product was filtered and covered with a perforated polythene sheet to restrict evaporation. The pH of the solution was found to be 3.4. The whole of the solution was again placed in a constant temperature bath with a controlled temperature at 45 °C. After 45 days the crystalline product of 2ADT was harvested and it had dimensions of 7 mm × 6 mm × 2 mm as shown in Fig. 2. The crystals were collected from the mother solution, ground and recrystallized in order to obtain larger crystals, but there was no change in the dimensions. Then more 2-amino-4,6-dimethoxypyrimidine was added to give a molar ratio of 2![[thin space (1/6-em)]](https://www.rsc.org/images/entities/char_2009.gif) :
:![[thin space (1/6-em)]](https://www.rsc.org/images/entities/char_2009.gif) 1, and the pH was measured to be 4.7. The solution was left undisturbed to ensure proper crystallization occurred. After 27 days, a crystal of a much larger size was harvested, as shown in Fig. 3. The larger size occurred because the supersaturation ratio played a larger role in faster crystallization of the 2ADT material. The larger size crystals which occurred after the second of addition of 2-amino-4,6-dimethoxypyrimidine may have led to an increase in the concentration of H+ ions, and thus ensured a shift in the equilibrium condition for forming molecular species, ion pairs.4 Hence the crystal with the varied molar ratio (2
1, and the pH was measured to be 4.7. The solution was left undisturbed to ensure proper crystallization occurred. After 27 days, a crystal of a much larger size was harvested, as shown in Fig. 3. The larger size occurred because the supersaturation ratio played a larger role in faster crystallization of the 2ADT material. The larger size crystals which occurred after the second of addition of 2-amino-4,6-dimethoxypyrimidine may have led to an increase in the concentration of H+ ions, and thus ensured a shift in the equilibrium condition for forming molecular species, ion pairs.4 Hence the crystal with the varied molar ratio (2![[thin space (1/6-em)]](https://www.rsc.org/images/entities/char_2009.gif) :
:![[thin space (1/6-em)]](https://www.rsc.org/images/entities/char_2009.gif) 1) was harvested on day 27 with dimensions of 27 mm × 13 mm × 11 mm, and the controlled rate of crystalline growth was clearly seen. Thus, by controlling the molar ratio, the growth process of crystalline material could also be regularized in terms of size and morphology.
1) was harvested on day 27 with dimensions of 27 mm × 13 mm × 11 mm, and the controlled rate of crystalline growth was clearly seen. Thus, by controlling the molar ratio, the growth process of crystalline material could also be regularized in terms of size and morphology.
![[thin space (1/6-em)]](https://www.rsc.org/images/entities/char_2009.gif) :
:![[thin space (1/6-em)]](https://www.rsc.org/images/entities/char_2009.gif) 1
1![[thin space (1/6-em)]](https://www.rsc.org/images/entities/char_2009.gif) :
:![[thin space (1/6-em)]](https://www.rsc.org/images/entities/char_2009.gif) 1 ratio after refinement of the XRD data. The mean planes of the cation and anion were inclined to one another by 18.4(3)° and the neutral 2ADP and anion were inclined to one another by 32.3(3)°. In the cation, one of the nitrogen atoms (N1A) in the pyrimidine ring was protonated and this was reflected in an increase in bond angle at N1A[C6A–N1A–C2A = 119.9(2)°], when compared with the unprotonated atom (N3A) [C4A–N3A–C2A = 116.8(2)°]. The values were compared with the corresponding angle of (N1B) [C6B–N1B–C2B = 116.9(2)°] and (N3B) [C4B–N3B–C2B = 115.9(2)°] in the neutral 2ADP. The methoxy substituent groups at C4A and C6A of the cation were essentially coplanar with the ring, the C7A–O1A–C4A–N3A and C8A–O2A–C6A–N1A torsion angles being −4.9(3)° and −178.7(2)°, respectively. For the neutral of 2ADP, the methoxy substituent groups at C4B and C6B were essentially coplanar with the ring, the C7B–O1B–C4B–N3B and C8B–O2B–C6B–N1B torsion angles being −2.2(4)° and −177.7(2)°, respectively. The anion of the L-tartrate molecule had extended conformation, which can be seen from the torsion angle C9–C10–C11–C12 = 175.3(2)°.
1 ratio after refinement of the XRD data. The mean planes of the cation and anion were inclined to one another by 18.4(3)° and the neutral 2ADP and anion were inclined to one another by 32.3(3)°. In the cation, one of the nitrogen atoms (N1A) in the pyrimidine ring was protonated and this was reflected in an increase in bond angle at N1A[C6A–N1A–C2A = 119.9(2)°], when compared with the unprotonated atom (N3A) [C4A–N3A–C2A = 116.8(2)°]. The values were compared with the corresponding angle of (N1B) [C6B–N1B–C2B = 116.9(2)°] and (N3B) [C4B–N3B–C2B = 115.9(2)°] in the neutral 2ADP. The methoxy substituent groups at C4A and C6A of the cation were essentially coplanar with the ring, the C7A–O1A–C4A–N3A and C8A–O2A–C6A–N1A torsion angles being −4.9(3)° and −178.7(2)°, respectively. For the neutral of 2ADP, the methoxy substituent groups at C4B and C6B were essentially coplanar with the ring, the C7B–O1B–C4B–N3B and C8B–O2B–C6B–N1B torsion angles being −2.2(4)° and −177.7(2)°, respectively. The anion of the L-tartrate molecule had extended conformation, which can be seen from the torsion angle C9–C10–C11–C12 = 175.3(2)°.


