 Open Access Article
Mn-based catalysts supported on γ-Al2O3, TiO2 and MCM-41: a comparison for low-temperature NO oxidation with low ratio of O3/NO†
Lijun Liu a,
Boxiong Shen*ab,
Meng Si
 a,
Peng Yuana,
Fengju Lua,
Hongpei Gaoc,
Yan Yaod,
Cai Liange and
Hongjie Xuf
aSchool of Energy and Environmental Engineering, Hebei University of Technology, Tianjin, China. E-mail: shenbx@hebut.edu.cn
bSchool of Chemical Engineering, Hebei University of Technology, Tianjin, China
cChina Huaneng Group, Clean Energy Technology Research Institute Co. Ltd, Beijing, China
dSuzhou TPRI Energy & Environment Technology Co. Ltd, Suzhou, China
eChengdu Dongfang KWH Environmental Protection Catalysts Co. Ltd, Chengdu, China
fXi'an Thermal Engineering Institute, Xi'an, China
First published on 25th May 2021
Abstract
Mn-Based catalysts supported on γ-Al2O3, TiO2 and MCM-41 synthesized by an impregnation method were compared to evaluate their NO catalytic oxidation performance with low ratio O3/NO at low temperature (80–200 °C). Activity tests showed that the participation of O3 remarkably promoted the NO oxidation. The catalytic oxidation performance of the three catalysts decreased in the following order: Mn/γ-Al2O3 > Mn/TiO2 > Mn/MCM-41, indicating that Mn/γ-Al2O3 exhibited the best catalytic activity. In addition, there was a clear synergistic effect between Mn/γ-Al2O3 and O3, followed by Mn/TiO2 and O3. The characterization results of XRD, EDS mapping, BET, H2-TPR, XPS and TG showed that Mn/γ-Al2O3 had good manganese dispersion, excellent redox properties, appropriate amounts of coexisting Mn3+ and Mn4+ and abundant chemically adsorbed oxygen, which ensured its good performance. In situ DRIFTS demonstrated the NO adsorption performance on the catalyst surface. As revealed by in situ DRIFTS experiments, the chemically adsorbed oxygen, mainly from the decomposition of O3, greatly promoted the NO adsorption and the formation of nitrates. The Mn-based catalysts showed stronger adsorption strength than the corresponding pure supports. Due to the abundant adsorption sites provided by pure γ-Al2O3, under the interaction of Mn and γ-Al2O3, the Mn/γ-Al2O3 catalyst exhibited the strongest NO adsorption performance among the three catalysts and produced lots of monodentate nitrates (–O–NO2) and bidentate nitrates (–O2NO), which were the vital intermediate species for NO2 formation. Moreover, the NO–TPD studies also demonstrated that Mn/γ-Al2O3 showed the best NO desorption performance among the three catalysts. The good NO adsorption and desorption characteristics of Mn/γ-Al2O3 improved its high catalytic activity. In addition, the activity test results also suggested that Mn/γ-Al2O3 exhibited good SO2 tolerance.
1 Introduction
NO and SO2 exhaust from coal-fired power plants can cause a number of environmental issues including acid rain and photochemical smog, as well as being severely detrimental to human health.2–6 At present, selective catalytic reduction (SCR) of NO with NH3 (NH3-SCR) and subsequent wet flue-gas desulfurization technology (WFGD) have been widely used to control NO and SO2 emissions from power plants. However, there are still several issues with this technology, such as a large carbon footprint, a relatively complex system, and poor low temperature activity.7,8 Accordingly, developing a low-temperature efficient and simple desulfurization and denitrification system has become a research focus. Low temperature NO oxidation is regarded as a promising method for the oxidation of NO to NO2, which can be removed simultaneously with SO2 by subsequent wet scrubbing,9,10 simplifying the complexity of the denitration system and achieving the goal of simultaneous desulfurization and denitrification. Thus, the oxidation of NO to NO2 in this method is the focus of research.Compared with noble metal catalysts such as Pt, Pd and Rh, transition metals are widely used in the research of NO oxidation due to their low prices, excellent redox performance and flexible valence states.11,12 Among them, Mn-based catalysts exhibit good performance for NO oxidation due to its multiple oxidation states,3,12,13 and manganese oxides are environmentally friendly active components.4,14 Therefore, many attentions are focused on Mn-based catalysts for NO catalytic oxidation.15–20 As a strong oxidant, ozone (O3) could decompose to oxygen without producing self-derived byproducts,21,22 and is widely used to oxidize pollutants. However, direct ozonation is not recommended, as it consumes large amounts of ozone, and high energy consumption by ozone generating system.23,24 This problem may be overcome through the use of catalytic ozonation, which reduces the ozone requirements compared to direct oxidation25,26 and improve the decomposition of ozone. In the process of catalytic ozonation, the catalysts provide active sites on the surfaces to decompose ozone into free radicals, thereby enhancing the oxidation rate.27 Previous studies showed that manganese-based catalysts had higher ozone decomposition efficiency than other transition metal-based catalysts in gaseous media.28,29 Therefore, catalytic ozonation with Mn-based catalysts has great value to be investigated in NO control.
In particular, the researches of catalytic ozonation mainly focus on removal VOC, such as toluene,30 benzene,16,31 formaldehyde,32 at reaction temperature below 100 °C. Just few studies have reported catalytic ozonation NO. Indrek et al.33 found that the presence of TiO2 could promote the catalytic destruction of ozone creating surface-bound oxygen atoms at higher temperature, thus enhancing the deep oxidation of NO. The consistent conclusion27 was also drawn on spherical alumina, and the deep oxidation of NO was further improved with the addition of MnOx to spherical alumina. The main reason is that the catalyst promotes the decomposition of ozone into active oxygen and then facilitates the reaction. In addition, Lin et al.34 studied a series of monometallic catalysts for NO deep oxidation by ozone and found that manganese oxides displayed the highest NO deep-oxidation efficiency of 80% at O3/NO = 2.0. Besides, Ce–Mn/SA (SA: spherical alumina) and Fe–Mn/SA showed good performance and excellent stability at O3/NO = 1.5 for NO deep oxidation. The synthetic action of higher surface area, better pore parameters, more oxygen vacancies and the relative balance distribution between Mn3+ and Mn4+ all favored NO deep oxidation. However, these works were carried out with high ratio of O3 (O3/NO > 1) for NO removal, increasing the extremely energy consumption, thus it was imperative to reduce the amount of O3.
Besides, active catalysts are usually supported on different supports in industrial applications, such as Al2O3, TiO2, silica and zeolite, which possess high surface, strong mechanical strength and high thermal stability.35,36 However, the supports has great impact on the catalytic performance of catalysts.37–40 Both the nature of supports (such as surface acidity15,41) and the interaction between support and metal oxides would result in great influence on specific surface area, valence states and dispersion of metal oxides, surface oxygen content and redox ability of catalysts,1,39,42,43 further affecting the catalytic performance of catalysts. As catalyst support, Al2O3 could provide amount adsorbed sites for surface adsorption oxygen and reactant gas,43,44 and the interaction between manganese oxides and Al2O3 showed large surface area, highly dispersed MnOx and optimum Mn3+/Mn4+, which all benefited to the excellent performance of Mn/Al2O3.27,45,46 The interaction between manganese oxides and TiO2, could improve the acidic strength and redox properties,41,42 thus Mn/TiO2 catalyst also showed good NO conversion performance. MCM-41 with high specific area and porosity,28 is also used as catalyst support.47,48 Therefore, it is necessary to investigate the NO oxidation behavior over Mn-based catalysts with different supports in the presence of ozone. TiO2, γ-Al2O3 and MCM-41 were selected as supports for NO conversion in this research.
In this work, the performance of Mn-based catalysts prepared with γ-Al2O3, TiO2 and MCM-41 as supports for ozone-assisted NO catalytic oxidation at low temperature (80–200 °C) were investigated. Unlike previous studies, the low ratio of O3/NO was used to participate in NO catalytic oxidation (O3/NO < 1). Meanwhile, various characterization methods were performed to investigate the physicochemical properties of catalysts, and the in situ diffuse reflectance infrared Fourier transform spectroscopy (in situ DRIFTS) was used to study the change of intermediate species on the catalyst surface under different atmosphere, and further found the difference of NO adsorption on the Mn-based catalysts. This study obtains high NO oxidation efficiency at low O3 concentration, and provides theoretical support for the selection of catalyst support.
2. Material and methods
2.1. Chemicals
Manganese acetate (Mn(CH3COOH)2·4H2O), MCM-41 and titanium dioxide (TiO2) were obtained from Fengchuan Chemical Reagent Technologies Co., Ltd in Tianjin, China. Alumina was purchased from Jingjing New Material Co., Ltd in Jiangsu, China. All chemicals used were of AR grade and no further purified. Some parameters of pure supports were shown in Table 1. In addition, the XRD profiles and N2 adsorption–desorption isotherms and pore size distribution curves of γ-Al2O3, TiO2 and MCM-41 were shown in Fig. 3 and 4, which were similar to the corresponding Mn-based catalysts.| Sample | Crystal phase | Particle size (nm) | Material form | BET surface area (m2 g−1) | Pore volume (cm3 g−1) | Average pore diameter (nm) |
|---|---|---|---|---|---|---|
| γ-Al2O3 | Al2O3 | 20 | Powder | 204.7 | 0.53 | 10.4 |
| TiO2 | Anatase | 10–25 | Powder | 122.5 | 0.49 | 16.1 |
| MCM-41 | SiO2 | 100–1000 | Powder | 672.9 | 0.68 | 4.0 |
2.2. Catalyst preparation
All catalysts were prepared via the impregnation method. The catalysts prepared from TiO2, alumina and MCM-41 supports were denoted as Mn/γ-Al2O3, Mn/TiO2 and Mn/MCM-41, respectively. The preparation procedure for a given catalyst sample was as follows: first, Mn(CH3COOH)2·4H2O was dissolved ultrasonically in 80 mL deionized water at room temperature. The corresponding mass support was then added to the solution such that the mass fraction of Mn to the support was 5 wt% and stirred for another 6 h. After refluxing in a water-bath at 80 °C for 4 h, the solid was dried at 110 °C overnight and calcined in air at 500 °C for 4 h at a temperature ramp rate of 5 °C min−1. Finally, the samples obtained using this method were crushed and sieved to 40–60 mesh.2.3. Catalyst characterization
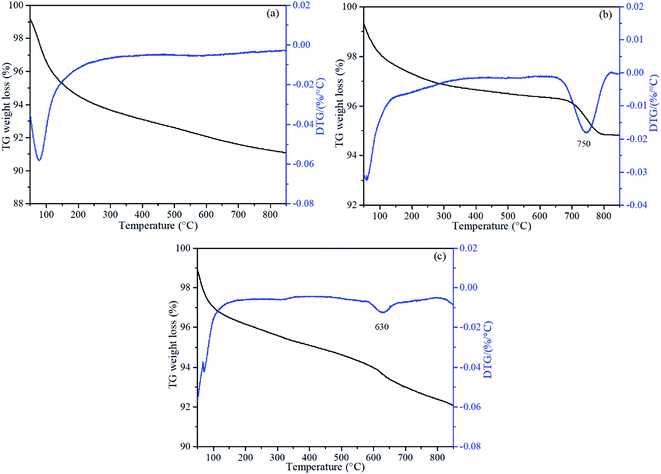
The reduction properties of the catalysts in H2 were obtained via H2-TPR measurements on a PCA-1200 chemisorption analyzer (Builder, China). In each run, 150 mg of catalyst was used, which was pretreated to 300 °C in a flow of pure N2 (50 mL min−1) for 90 minutes and cooled to room temperature before being exposed to a flow of 10% H2/N2 (30 mL min−1) and heated to 900 °C at a rate of 10 °C min−1. NO-TPD was performed using the same instrument as the H2-TPR. Typically, 150 mg catalysts was pretreated in 50 mL min−1 N2 for 90 minutes at 300 °C and then treated in a flow of 5% NO/N2 (50 mL min−1) for 60 minutes at room temperature. The residual NO was purged by pure N2 and the catalyst was heated to 900 °C in N2 (30 mL min−1) at a rate of 10 °C min−1.The specific surface areas of the catalysts were measured by the standard BET method with N2 adsorption using an ASAP 2020 HD88 (Micromeritics, USA). XPS analysis was performed on an ESCALAB 250Xi (ThermoFischer, USA) scanning X-ray microprobe using Al Kα radiation (1486.6 eV) as the excitation source. Binding energies were calibrated relative to the C 1s peak from carbon contamination at 284.8 eV. The crystal structures of the catalysts were recorded using a D8 Discover (Bruker, Germany) XRD with Cu Kα radiation in the 2θ range from 10° to 90°. Thermogravimetric analysis (TG-DTG) experiments were performed on a SDT-Q600 (TA Instruments, USA) instrument under pure nitrogen flow (100 mL min−1) to study the weight changes with temperature. The samples were heated from room temperature to 850 °C at 10 °C min−1. Scanning electron microscopy coupled with energy dispersive spectrometer (SEM-EDS) (Hitachi, Japan) was applied to verify the dispersion of Mn on the catalysts.
Finally, the in situ DRIFTS were investigated using a Tendor II (Bruker, Germany) FTIR spectrometer equipped with an MCT/A detector cooled by liquid nitrogen and an in situ DRIFT accessory. Prior to experiments, the catalyst was pretreated at 300 °C in N2 for 1 h and then cooled to the desired temperature. Background spectra were collected with the pretreated catalyst sample in a reaction cell containing ZnSe windows under N2 flow at the reaction temperature. Subsequently, the reactant gas mixtures were introduced into the cell and DRIFTS spectra were recorded from 600 to 4000 cm−1 with a resolution of 4 cm−1.
2.4. Catalytic performance tests
The O3-assisted catalytic oxidation of NO was plain homogenous gas phase reaction and carried out in a fixed bed quartz reactor (i.d. = 8 mm). Catalyst, supported by silica wool, was added into the reactor at a gas hourly space velocity (GHSV) of 24![[thin space (1/6-em)]](https://www.rsc.org/images/entities/char_2009.gif) 000 h−1 and the reactor temperature was set by means of a temperature controller. Ozone was generated from pure O2 using an ozone generator and its concentrations were measured using a GM-6000-OEM ozone detector (ANSEROS, Germany). The experimental system was connected with corrosion-resistant materials, and no gas leakage was detected during the whole experiment. Quantitative analysis of the reaction products was carried out using a KM940 flue gas analyzer (Kane, England). The reaction gas consisted of a 500 ppm NO, O3 (the molar ratio of O3/NO < 1), 5 vol% O2, and N2 (as balance). The total flowrate was 400 mL min−1. The NO conversion rate was calculated using the following formula:
000 h−1 and the reactor temperature was set by means of a temperature controller. Ozone was generated from pure O2 using an ozone generator and its concentrations were measured using a GM-6000-OEM ozone detector (ANSEROS, Germany). The experimental system was connected with corrosion-resistant materials, and no gas leakage was detected during the whole experiment. Quantitative analysis of the reaction products was carried out using a KM940 flue gas analyzer (Kane, England). The reaction gas consisted of a 500 ppm NO, O3 (the molar ratio of O3/NO < 1), 5 vol% O2, and N2 (as balance). The total flowrate was 400 mL min−1. The NO conversion rate was calculated using the following formula:
 | (1) |
3. Results and discussion
3.1. Catalytic performance
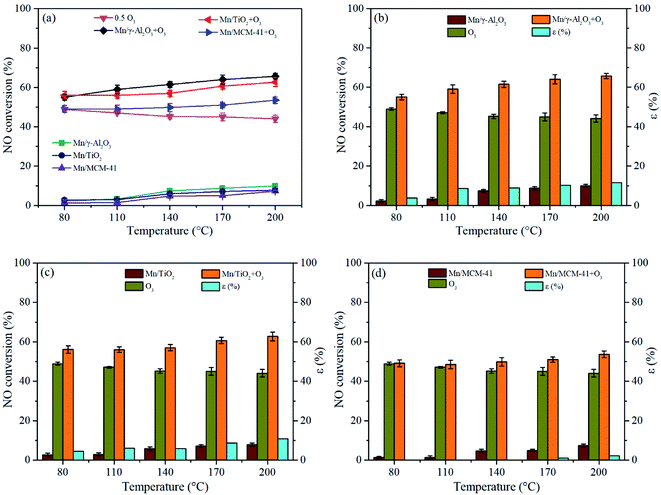
The results of NO conversion over single catalysts (Mn/γ-Al2O3, Mn/TiO2, Mn/MCM-41), single O3 (0.5O3: the molar ratio of O3/NO = 0.5), and the combination of catalysts and O3 (Mn/γ-Al2O3 + O3, Mn/TiO2 + O3, Mn/MCM-41 + O3) between 80–200 °C were shown in Fig. 1(a). It could be seen that in the absence of O3, the NO conversion increased with temperature, and Mn/γ-Al2O3 exhibited better catalytic performance than that of other two catalysts. But overall, these catalysts presented a relative low NO conversion at test temperature. The NO conversion by single O3 was much higher than that of single catalyst and maintained at about 45%. However, NO conversion decreased slightly as temperature increase, which was because the decomposition of O3 enhanced with the increase of temperature. Notably, with the participation of O3, the O3-assisted NO conversion of three catalysts significantly enhanced, demonstrating that O3 could apparently improve NO catalytic oxidation. For instance, the NO conversion over Mn/γ-Al2O3 increased from 7% to 62% after adding O3 at 140 °C. Moreover, the catalyst-O3 combination exhibited better activity than O3 alone. Besides, it could be observed that with or without O3, Mn/γ-Al2O3 presented the best performance among the three catalysts, followed by Mn/TiO2. The similar results could be found when the molar ratio of O3/NO = 0.3 (Fig. 1(a)) or 0.7 (Fig. 1(e)).In order to study the synergistic effect between catalyst and O3, the results of catalyst oxidation, sole ozonation and catalyst-O3 composite oxidation were compared, as shown in Fig. 1(b)–(d). Meanwhile, the synergistic factor was calculated according to the following formula:
| ε (%) = ηcatalyst/O3 − (ηcatalyst + ηO3) |
3.2. Results of catalyst characterization
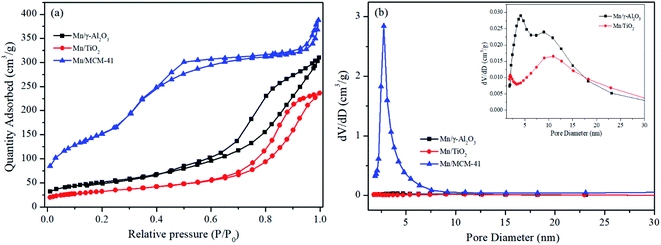 | ||
| Fig. 2 N2 adsorption–desorption isotherms (a) and pore size distribution curves (b) of the Mn/γ-Al2O3, Mn/TiO2 and Mn/MCM-41 catalysts. | ||
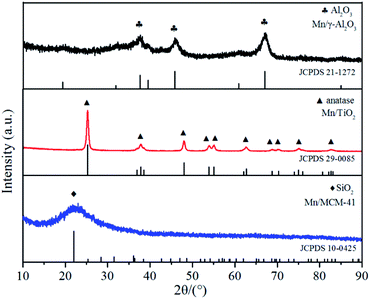
The XRD patterns of the three catalyst samples were shown in Fig. 3. For Mn/TiO2, only the pure anatase phase was observed, with diffraction angles located at 25.3°, 37.8°, 48.0°, 53.9°, 55.1°, 62.7°, 68.8°, 70.3°, 75.0°, and 82.7° (JCPDS 21-1272). For MCM-41, the only diffraction peak, at 2θ = 22.0°, was correlated to SiO2 (JCPDS 29-0085). For Mn/γ-Al2O3, the weak diffraction peaks for Al2O3 appeared at 37.6°, 45.9°, and 67.0° (JCPDS 10-0425). No crystalline manganese oxide peaks were found in the XRD spectra of any of the catalysts, probably due to the low loading or high dispersion in amorphous or microcrystalline on the surface of catalyst. The Mn elemental mapping images of Mn/γ-Al2O3, Mn/TiO2 and Mn/MCM-41 was depicted in Fig. 2. It showed that Mn in Mn/γ-Al2O3, Mn/TiO2 and Mn/MCM-41 were all highly dispersed. In addition, The Mn contents of the three catalysts were detected by ICP-OES that they are similar to the expected Mn/support mass ratio (∼5%), and the results are shown in Table 2.
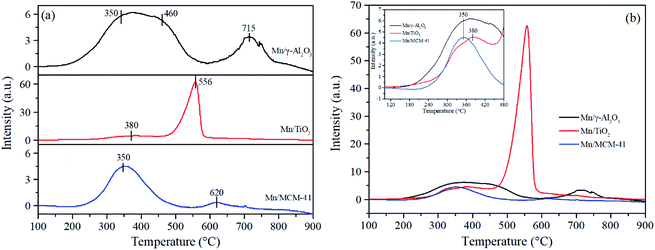
Previous report revealed that Mn3+–O was easy to break, furthermore, the presence of Mn3+ was more conducive to the combination of O and NO, and then promoted the formation and release of NO2 product.57 Moreover, a portion of Mn3+ neighbored with oxygen vacancies, which could accelerate the decomposition of O3 into adsorbed oxygen. When the oxygen vacancies were filled up with adsorbed oxygen, Mn3+ would be oxidized into unstable Mn4+ to balance charge neutralization and produced more active sites of redox couples on the surface of catalysts.58,59 The above analysis indicated that the coexistence of Mn3+ and Mn4+ could provide more active sites and further promote NO oxidation in the presence of ozone, which was consistent with result of Fig. 1 that Mn/γ-Al2O3 and Mn/TiO2 with Mn3+ and Mn4+ exhibited higher activity than Mn-MCM-41. Eqn (2) and (3) may represent ozone decomposition reactions on the surface of Mn-based catalysts:
| [Mn3+] + O3 → O2 + Oads−–[Mn4+] | (2) |
| Oads−–[Mn4+] + O3 → 2O2 + [Mn3+] | (3) |
| Oads−–[Mn4+] + NO → NO2 + [Mn3+] | (4) |
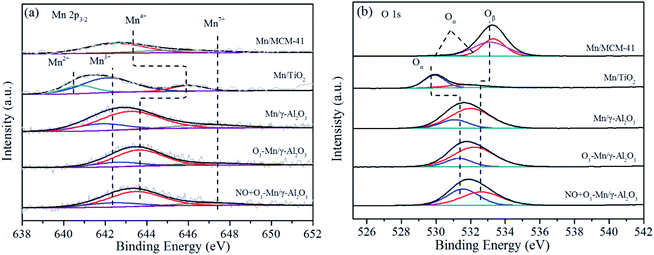
Comparing between the different Mn/γ-Al2O3 based samples, the ratios of Mn3+/Mn decreased in the following sequence: Mn/γ-Al2O3 > NO + O3–Mn/γ-Al2O3 > O3–Mn/γ-Al2O3, as shown in Table 3. Meanwhile, the ratio of Mn4+ increased after O3 adsorption and reaction, indicating that the Mn3+ was oxidized to Mn4+ by O3 in the flue gas via a transition of the Mn valance state. Reed et al.60 found that the electron transfer between the catalyst and O3 caused the decomposition of the latter into active oxygen. In addition, only a very small amount of Mn3+ was converted to Mn4+, suggesting that Mn3+ and Mn4+ were in a dynamic transformation equilibrium state. Therefore, it might be tentatively surmised that the ozone decomposition process did followed eqn (2) and (3), whereby ozone was catalytically decomposed to active atomic oxygen,27 which was conducive to the NO oxidation.20
| Samples | Mn 2p3/2 | O 1s | ||||
|---|---|---|---|---|---|---|
| Mn2+/Mn | Mn3+/Mn | Mn4+/Mn | Mn7+/Mn | Oα/O | Oβ/O | |
| Mn/γ-Al2O3 | — | 0.21 | 0.66 | 0.13 | 0.23 | 0.77 |
| Mn/TiO2 | 0.18 | 0.66 | 0.16 | — | 0.70 | 0.30 |
| Mn/MCM-41 | — | — | 0.77 | 0.23 | 0.47 | 0.53 |
| O3–Mn/γ-Al2O3 | — | 0.18 | 0.69 | 0.13 | 0.21 | 0.79 |
| NO + O3–Mn/γ-Al2O3 | — | 0.20 | 0.67 | 0.13 | 0.49 | 0.51 |
The O 1s spectra of the Mn-based catalysts were presented in Fig. 5(b), with the valence state ratios listed in Table 3. The O 1s spectra showed two peaks for both Mn/γ-Al2O3 and Mn/TiO2. The low binding energy peaks (529.9–531.6 eV) corresponded to surface lattice oxygen (Oα), and those with high binding energy (531.7–532.6 eV) assigned to surface adsorbed oxygen (Oβ).61 However, for Mn/MCM-41, three peaks were observed, which were attributed to lattice oxygen (Oα) of metal oxides (Mn–O) and Si–O and adsorbed –OH groups (Oβ) at 530.9 eV, 533.3 eV and 532.8 eV,2,3,62,63 respectively. It was widely accepted that Oβ was more beneficial for the NO oxidation than Oα due to its higher mobility.64 From the XPS analysis results in Table 3, it could be detected that Mn/γ-Al2O3 with the highest catalytic activity contained the largest amount of Oβ. Although the content of Oβ in Mn/MCM-41 was higher than that in Mn/TiO2, there was no Mn3+ in Mn/MCM-41. It was likely that the combined action of Oβ and Mn3+ made the activity of Mn/TiO2 higher than that of Mn/MCM-41. Compared to the plain Mn/γ-Al2O3 catalyst, the Oβ/O ratio increased slightly for O3–Mn/γ-Al2O3, which indicated that the decomposition of O3 on the surface of catalyst generated the adsorbed oxide species via eqn (2). Nevertheless, the ratio Oβ/O of NO + O3–Mn/γ-Al2O3 significantly decreased, which might be due to the adsorbed oxygen presented on the surface of catalysts or produced by ozone decomposition were consumed via eqn (4). Consequently, it could be inferred that proper ratio of Mn3+ and Mn4+ and abundant Oβ on the catalyst surface played the significant role in NO oxidation. Although the atomic ratio of Mn3+ for Mn/γ-Al2O3 was lower than that of Mn/TiO2, a better NO oxidation performance was obtained with Mn/γ-Al2O3, which could be rationalized by the high concentration of Oβ and proper ratio of Mn3+ and Mn4+ in the catalyst.
3.3. In situ DRIFTS
In order to study the difference of NO catalytic oxidation performance over three catalysts, the NO adsorption behavior at different atmospheres and the evolution of reaction intermediates over three catalysts were investigated via in situ DRIFTS experiments. For reference, the spectra of pure supports of corresponding catalysts were also studied.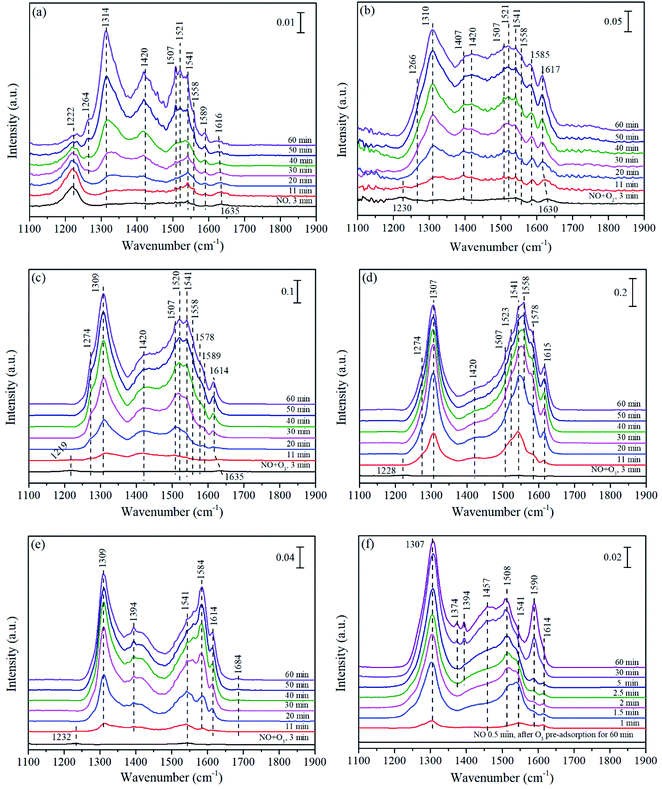 | ||
| Fig. 7 In situ DRIFTS of Mn/γ-Al2O3 (a–d and f) and pure γ-Al2O3 (e) exposed to NO (a), NO + O2 (b), NO + O3 at 140 °C (c and e), NO + O3 at 200 °C (d), and NO after O3 pre-adsorption at 140 °C (f). | ||
Fig. 7(e) showed the FTIR spectra of pure γ-Al2O3 exposed to NO + O3 at 140 °C. Obviously, after the introduction of NO + O3, weak bridged nitrites (1232 cm−1) emerged at the beginning and quickly disappeared in 11 min, followed by the appearance and rapid enhancement of monodentate nitrates (1309 cm−1), bidentate nitrates (1541 and 1584 cm−1) as well as monodentate nitrite (1394 cm−1). In particular, weakly adsorbed NO were also observed at 1684 cm−1.6 NO was supposed to adsorb on the sites of positive charged alumina ions,74 and then was catalytically oxidized to various nitrates and nitrites,75 indicating that the pure γ-Al2O3 promoted the NO adsorption on the catalyst surface followed by the formation of nitrates. At times, it could be found that the lineshape of pure γ-Al2O3 were similar to that of Mn/γ-Al2O3 in Fig. 7(c), but the intensity was weaker than that of Mn/γ-Al2O3. These phenomena indicated that the addition of Mn promoted the adsorption of NO and the formation of intermediate species. Research had proved that O3 decomposition with Mn/γ-Al2O3 was much higher than that with pure γ-Al2O3, and amount active oxygen would be produced to accelerate the oxidation of NO.27 As revealed by XPS, the coexistence of Mn3+ and Mn4+ could promote more active sites, which accelerated the decomposition of ozone to produce active oxygen. Therefore, Mn/γ-Al2O3 exhibited better adsorption for NO than that of pure γ-Al2O3.
After O3 pretreatment, abundant chemically adsorbed oxygen was stored on the surface of Mn/γ-Al2O3 as shown in Fig. 7(f). Once NO was introduced into the system, various N-species appeared and increased with time. After NO adsorption for 60 min, the peak intensity in Fig. 7(f) was stronger than that in Fig. 7(a), demonstrating that chemically adsorbed oxygen decomposed from O3 remarkably enhanced the NO adsorption on the surface of catalysts.
 | ||
| Fig. 8 In situ DRIFTS of Mn/TiO2 (a–d and f) and pure TiO2 (e) exposed to NO (a), NO + O2 (b), NO + O3 at 140 °C (c and e), NO + O3 at 200 °C (d), and NO after O3 pre-adsorption at 140 °C (f). | ||
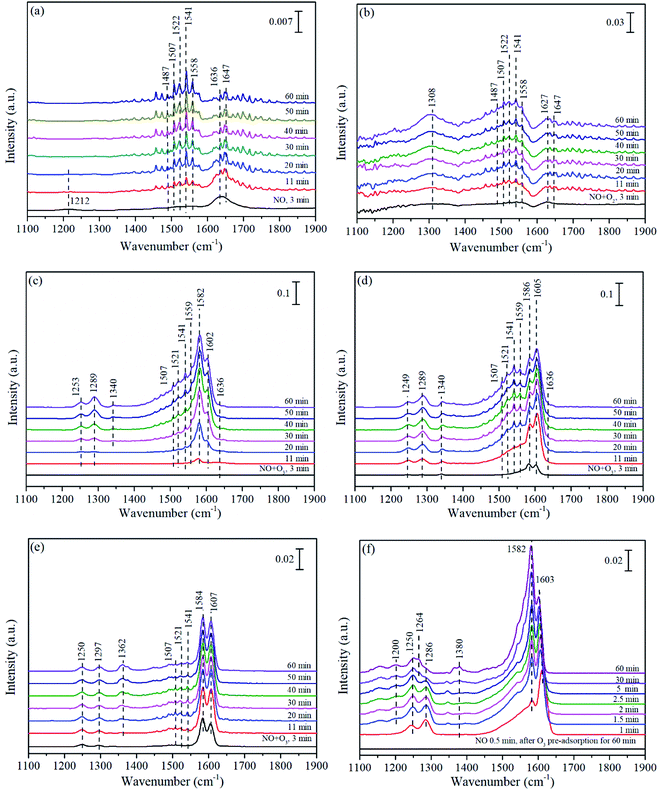
With the participation of O3, monodentate nitrates at 1308 cm−1 in Fig. 8(b) did not appear in Fig. 8(c), replaced by monodentate nitrates (1253 and 1289 cm−1) and nitro compound (1340 cm−1). Comparing the peak intensity of Fig. 8(b) and (c), similar to the above conclusion could be drawn on Mn/TiO2 that O3 further promoted the adsorption and oxidation of NO. Fig. 8(d) showed the co-adsorption behavior of NO + O3 for Mn/TiO2 at 200 °C. In comparison with Fig. 8(c), the adsorption bands in Fig. 8(d) reached their highest intensity within 30 min, while it was more than 60 min in Fig. 8(c). It demonstrated that the adsorption–desorption process obtained equilibrium state more quickly on Mn/TiO2 at 200 °C, which was also the reason why Mn/TiO2 exhibited higher performance at 200 °C than that at 140 °C. Otherwise, the intensity of bidentate nitrates at 1586 cm−1 at 200 °C decreased significantly than that at 140 °C, while monodentate nitrates (1289, 1507 and 1521 cm−1) and bridge nitrates (1605 cm−1) were slightly increased in their intensity. As the main intermediate species, the transformation of bidentate nitrates, monodentate nitrates and bridged nitrates promoted the catalytic oxidation of NO and synergistic effect between Mn/TiO2 and O3.
Fig. 8(e) showed the spectra of pure TiO2 exposed to NO + O3. In Fig. 8(e), two strong peaks of bidentate nitrates (1584 cm−1) and bridged nitrates (1607 cm−1) appeared quickly and grew as the predominant species. In addition, some inconspicuous monodentate nitrates (1250, 1297, 1507 and 1521 cm−1), bidentate nitrates (1541 cm−1)3,72 and nitro compound (1362 cm−1) were also observed. It was worth noting that the peak intensity of Mn/TiO2 (Fig. 8(c)) was stronger than that on pure TiO2, especially for monodentate nitrates (1507 and 1521 cm−1). This also suggested that the addition of Mn could facilitate the NO adsorption on Mn/TiO2, probably due to easily accessible multiple oxidation states of Mn, which was conducive to O3 decomposition into active oxygen, accompanied by the formation of pivotal intermediate species of monodentate nitrates.
The DRIFT spectra of NO adsorption after O3 pre-adsorption for 60 min was displayed in Fig. 8(f). It could be seen that the bridge nitrates (1603 cm−1) emerged rapidly in 1 min then grew slow, and even weakened with time, while the bidentate nitrates (1582 cm−1) increased and became shaper than bridge nitrates, probably due to the conversion of the former to the later. The monodentate nitrates at 1286 cm−1 first increased then decreased and shifted to 1250 and 1264 cm−1, which all assigned to monodentate nitrates. Additionally, weakly adsorbed NO species (1200 cm−1)76 and monodentate nitrites (1380 cm−1) were also observed. Similarly, the intensity of peaks in Fig. 8(f) was much stronger than that in Fig. 8(a), implying the chemically adsorbed oxygen from O3 decomposition greatly improved the NO adsorption on the surface of Mn/TiO2.
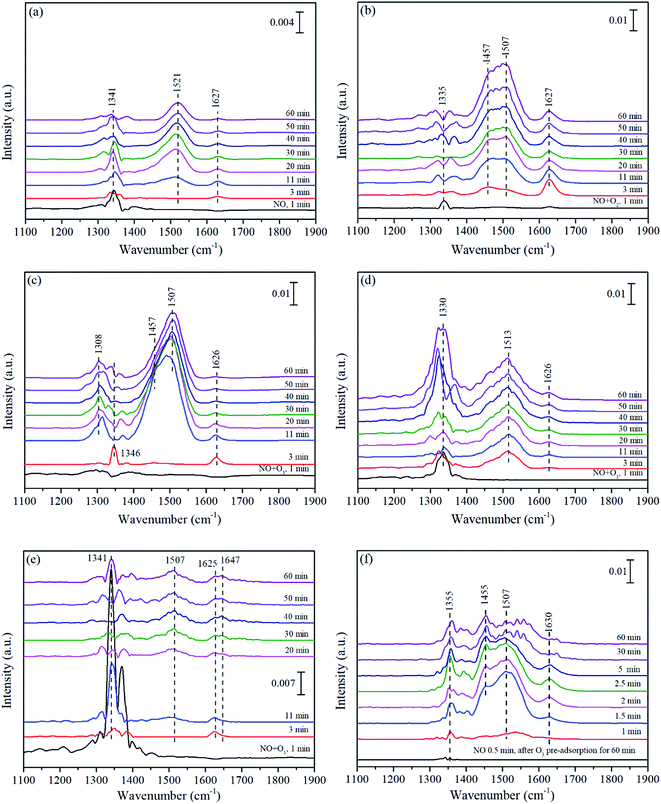 | ||
| Fig. 9 In situ DRIFTS of Mn/MCM-41 (a–d and f) and pure MCM-41 (e) exposed to NO (a), NO + O2 (b), NO + O3 at 140 °C (c and e), NO + O3 at 200 °C (d), and NO after O3 pre-adsorption at 140 °C (f). | ||
In Fig. 9(d), monodentate nitrates (1513 cm−1) quickly formed within 3 min, which was faster than that in Fig. 9(c), and then gradually increased. However, the intensity of monodentate nitrates in Fig. 9(d) was lower than that in Fig. 9(c), suggesting that the decomposition of monodentate nitrates was further enhanced at 200 °C and more active sites were released, which in turn promoted the formation of monodentate nitrates, so the monodentate nitrates were continuously generated over time. In combination with the result of Fig. 1(d), it could also be speculated that the highly reactive and easily decomposed monodentate nitrates were an important intermediate species in the catalytic oxidation of NO for Mn/MCM-41.
Fig. 9(e) displayed the adsorption behavior of NO over pure MCM-41 in NO + O3 at 140 °C. It could be seen from Fig. 9(e) that nitro compound (1341 cm−1) emerged first within 1 min and weakened over time, after that bridged nitrates (1625–1647 cm−1) appeared and reached the maximum intensity in 3 min due to the decomposition of nitro compound. With the consumption of nitro compound and bridged nitrates, monodentate nitrate (1507 cm−1) occurred and grew progressively over time (Fig. 9(e)). However, the intensity of adsorption peaks on pure MCM-41 was very weak, indicating that MCM-41 could only provide very few adsorption sites. Fig. 9(f) showed the in situ DRIFT spectra of Mn/MCM-41 exposed to NO after O3 pre-adsorption for 60 min. All peaks reached the strongest in 2.5 min and then quickly weakened due to the consumption of chemically adsorbed oxygen on the surface of catalyst.
The in situ DRIFTS analysis suggested that the adsorption of NO and the formation of nitrates on the surface of catalysts were remarkably promoted by chemically adsorbed oxygen, especially from O3. Comparing the peak intensities of Mn-based catalysts, the order was as follows: Mn/γ-Al2O3 > Mn/TiO2 > Mn/MCM-41, indicating that the supports had effect on NO adsorption and Mn/γ-Al2O3 possessed the best adsorption performance of NO, which was consistent with the activity test in Fig. 1. Nitrates was supposed to the vital intermediate in the formation of NO2.78 In comparison with the nitrates intensity of Mn-based catalysts in NO + O3 at 140 °C (Fig. 7(c), 8(c) and 9(c)), Mn/γ-Al2O3 (mainly monodentate and bidentate nitrates) displayed stronger nitrates intensity than that of Mn/TiO2 and Mn/MCM-41, which might be the reason why the synergistic effect between Mn/γ-Al2O3 and O3 was significantly higher than that between Mn/TiO2 and O3, and between Mn/MCM-41 and O3. Besides, the Mn-based catalysts showed better NO adsorption performance than the corresponding pure supports. Under the interaction between Mn and corresponding supports, the NO adsorption and oxidation was further promoted, probably due to the formation of more active sites with the addition of Mn. According to the characterization analyses, the Mn3+ usually generated the oxygen vacancies,55 which contributed to the excellent activity.52 O3 were adsorbed on the oxygen vacancies to form adsorbed oxygen during the electrons transfer between Mn3+ and Mn4+, resulting in more active oxygen for the adsorption and activation of NO to form nitrates, and then nitrates decomposed into NO2.27,78–80 Therefore, more co-existence of Mn3+ and Mn4+ as well as more adsorbed oxygen benefited to the NO oxidation. Based on the results of H2-TPR and XPS, Mn/γ-Al2O3 catalyst possessed high content of Mn3+ and Mn4+ as well as amount adsorbed oxygen, which was conductive to its excellent NO adsorption performance and further improved its catalytic activity.
3.4 NO-TPD analysis
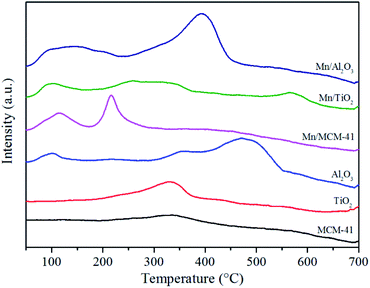
Fig. 10 displayed the NO-TPD profiles of catalysts and the corresponding supports. The desorption peaks below 300 °C was attributed to the monodentate nitrates and bridged nitrates, while the high temperature peaks above 300 °C was assigned to the bidentate nitrates and bridged nitrates.81 It could be seen that the Mn-based catalysts possessed larger desorption area of NO than the corresponding supports, and desorption peaks were also shifted to the low temperature, indicating that the addition of Mn contributed to the formation and desorption of N-species. In addition, Mn/γ-Al2O3 had the largest value and lowest initial desorption temperature among three Mn-based catalysts, suggesting that the surface of Mn/γ-Al2O3 was most favorable for NO desorption, which was also consistent with that Mn/γ-Al2O3 had the strongest NO adsorption capacity (Section 3.3). Interestingly, there were two obvious desorption peaks of monodentate nitrates and bridged nitrates for Mn/MCM-41 at low temperature, consisting with the results of Fig. 9. It demonstrated that NO could be easily desorbed from Mn/MCM-41, but because of the limited adsorption capacity of Mn/MCM-41 for NO, Mn/MCM-41 still did not show high activity.3.5 Effect of SO2 on NO conversion
Since SO2 existed in the exhaust, it was critical to investigate the influence of SO2 on NO conversion. As shown in Fig. 11, after SO2 was added into the feed gas, the NO conversion of Mn/γ-Al2O3, Mn/TiO2 and Mn/MCM-41 rapidly decreased by about 8%, and then stabilized at 58%, 46% and 38%, respectively. With the removal of SO2, NO conversion recovered to a certain extent, but not to the initial state, probably due to the passivation of SO2 that metal sulfates formed on the surface of catalyst and occupied part of the active sites. However, SO2 had little effect on NO oxidation by O3 alone. Except Mn/MCM-41, Mn/γ-Al2O3 and Mn/TiO2 catalysts still showed better performance than O3 alone, especially Mn/γ-Al2O3, suggesting that Mn/γ-Al2O3 showed better SO2 tolerance in the presence of O3.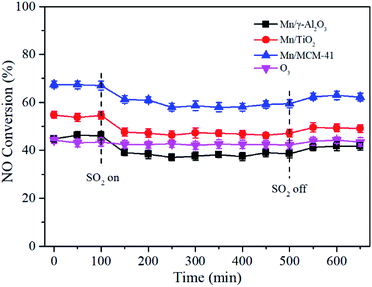 | ||
Fig. 11 Effect of SO2 on NO conversion over Mn/γ-Al2O3, Mn/TiO2, and Mn/MCM-41 catalysts. Reaction conditions: NO = 500 ppm, O2 = 5 vol%, GHSV = 24![[thin space (1/6-em)]](https://www.rsc.org/images/entities/char_2009.gif) 000 h−1, T = 140 °C, O3/NO = 0.5, SO2 = 300 ppm. 000 h−1, T = 140 °C, O3/NO = 0.5, SO2 = 300 ppm. | ||
4. Conclusions
Mn/γ-Al2O3, Mn/TiO2 and Mn/MCM-41 catalysts were compared for NO catalytic oxidation with low ratio of O3/NO (O3/NO < 1) at low temperatures of 80–200 °C. The NO conversion for three catalysts were in the order of Mn/γ-Al2O3 > Mn/TiO2 > Mn/MCM-41. Moreover, there was a clear synergistic effect between Mn/γ-Al2O3 and O3, followed by Mn/TiO2 and O3, while for Mn/MCM-41, almost no synergistic effect occurred between Mn/MCM-41 and O3. The characterization results of XRD, EDS mappings, BET, H2-TPR, XPS and TG showed that Mn/γ-Al2O3 possessed good manganese dispersion, excellent redox performance, abundant chemically adsorbed oxygen and the coexistence of Mn3+ and Mn4+ in a proper amount, which were the vital factors that contributed to its high activity. The in situ DRIFTS results indicated that the chemically adsorbed oxygen species produced by O3 decomposition greatly promoted the adsorption of NO as well as the formation of nitrates on the catalyst surface. Meanwhile, the Mn-based catalysts showed stronger adsorption bands than the corresponding pure supports. Besides, it also showed that pure γ-Al2O3 support provided amount active sites for NO adsorption. Under the interaction between Mn and γ-Al2O3, Mn/γ-Al2O3 had the strongest NO adsorption performance among three catalysts and greatly accelerated the formation of monodentate nitrates and bidentate nitrates, which were the vital intermediate species for NO2 formation and further ensured excellent catalytic activity of Mn/γ-Al2O3. The NO-TPD outcomes also showed that the Mn-based catalysts showed stronger desorption bands than the corresponding pure supports, and Mn/γ-Al2O3 had the best NO desorption performance among three catalysts. The excellent NO adsorption, conversion and desorption performance of Mn/γ-Al2O3, all contributed to the high activity of Mn/γ-Al2O3. In addition, Mn/γ-Al2O3 also exhibited excellent SO2 tolerance.Conflicts of interest
There are no conflicts to declare.Acknowledgements
The project was supported by National Key Research and Development Program of China (2018YFB0605101), Research Fund of International Young Scientists (51550110237), and the Science and Technology Key Project of Tianjin, China (19ZXSZSN00050 and 19ZXSZSN00070), Innovation funding project for Postgraduates in Hebei Province in 2020 (CXZZBS2020035).References
- G. Cheng, X. Liu, X. Song, X. Chen, W. Dai, R. Yuan and X. Fu, Appl. Catal., B, 2020, 277, 119196 CrossRef CAS.
- X. Hou, J. Qian, L. Li, F. Wang, B. Li, F. He, M. Fan, Z. Tong, L. Dong and L. Dong, Ind. Eng. Chem. Res., 2018, 57, 16675–16683 CrossRef CAS.
- F. Gao, X. Tang, H. Yi, C. Chu, N. Li, J. Li and S. Zhao, Chem. Eng. J., 2017, 322, 525–537 CrossRef CAS.
- H. Chen, Y. Wang and Y.-K. Lyu, Mol. Catal., 2018, 454, 21–29 CrossRef CAS.
- Y. Wan, W. Zhao, Y. Tang, L. Li, H. Wang, Y. Cui, J. Gu, Y. Li and J. Shi, Appl. Catal., B, 2014, 148–149, 114–122 CrossRef CAS.
- A. Wang, Y. Guo, F. Gao and C. H. F. Peden, Appl. Catal., B, 2017, 202, 706–714 CrossRef CAS.
- B. Wang, H. Su and S. Yao, Process Saf. Environ. Prot., 2020, 133, 216–223 CrossRef CAS.
- S. Xie, L. Li, L. Jin, Y. Wu, H. Liu, Q. Qin, X. Wei, J. Liu, L. Dong and B. Li, Appl. Surf. Sci., 2020, 515, 146014 CrossRef CAS.
- W. Wang, W. Li, R. Guo, Q. Chen, Q. Wang, W. Pan and G. Hu, J. Rare Earths, 2016, 34, 876–881 CrossRef CAS.
- Z. Wang, F. Lin, S. Jiang, K. Qiu, M. Kuang, R. Whiddon and K. Cen, Fuel, 2016, 166, 352–360 CrossRef CAS.
- J. Shao, F. Lin, Y. Huang, Z. Wang, Y. Li, G. Chen and K. Cen, Appl. Surf. Sci., 2020, 503, 144064 CrossRef CAS.
- H. Wang, H. Chen, Y. Wang and Y.-K. Lyu, Chem. Eng. J., 2019, 361, 1161–1172 CrossRef CAS.
- B. Hao, Y. Sun, Q. Shen, X. Zhang and Z. Zhang, Chemosphere, 2020, 243, 125406 CrossRef CAS PubMed.
- M. L. Saladino, E. Kraleva, S. Todorova, A. Spinella, G. Nasillo and E. Caponetti, J. Alloys Compd., 2011, 509, 8798–8803 CrossRef CAS.
- B. Zhao, R. Ran, X. Wu, D. Weng, X. Wu and C. Huang, Catal. Commun., 2014, 56, 36–40 CrossRef CAS.
- M. Jin, J. H. Kim, J. M. Kim, J.-K. Jeon, J. Jurng, G.-N. Bae and Y.-K. Park, Catal. Today, 2013, 204, 108–113 CrossRef CAS.
- X. Tang, F. Gao, Y. Xiang, H. Yi and S. Zhao, Catal. Commun., 2015, 64, 12–17 CrossRef CAS.
- S. Thampy, Y. Zheng, S. Dillon, C. Liu, Y. Jangjou, Y.-J. Lee, W. S. Epling, K. Xiong, Y. J. Chabal, K. Cho and J. W. P. Hsu, Catal. Today, 2018, 310, 195–201 CrossRef CAS.
- Z. Wu, N. Tang, L. Xiao, Y. Liu and H. Wang, J. Colloid Interface Sci., 2010, 352, 143–148 CrossRef CAS PubMed.
- L. Wang, H. He, C. Zhang, Y. Wang and B. Zhang, Chem. Eng. J., 2016, 288, 406–413 CrossRef CAS.
- R. Huang, B. Lan, Z. Chen, H. Yan, Q. Zhang, J. Bing and L. Li, Chem. Eng. J., 2012, 180, 19–24 CrossRef CAS.
- H. Einaga and S. Futamura, Appl. Catal., B, 2005, 60, 49–55 CrossRef CAS.
- J. Shao, Y. Yang, R. Whiddon, Z. Wang, F. Lin, Y. He, S. Kumar and K. Cen, Energy Fuels, 2019, 33, 4454–4461 CrossRef CAS.
- Z. Han, J. Wang, T. Zou, D. Zhao, C. Gao, J. Dong and X. Pan, Energy Fuels, 2020, 34, 2080–2088 CrossRef CAS.
- J. Nawrocki and B. Kasprzyk-Hordern, Appl. Catal., B, 2010, 99, 27–42 CrossRef CAS.
- M. T. N. Dinh, J.-M. Giraudon, A. M. Vandenbroucke, R. Morent, N. de Geyter and J.-F. Lamonier, Appl. Catal., B, 2015, 172–173, 65–72 CrossRef CAS.
- F. Lin, Z. Wang, Q. Ma, Y. Yang, R. Whiddon, Y. Zhu and K. Cen, Appl. Catal., B, 2016, 198, 100–111 CrossRef CAS.
- M. Sui, J. Liu and L. Sheng, Appl. Catal., B, 2011, 106, 195–203 CAS.
- Y. Liu, W. Yang, P. Zhang and J. Zhang, Appl. Surf. Sci., 2018, 442, 640–649 CrossRef CAS.
- E. Rezaei, J. Soltan and N. Chen, Appl. Catal., B, 2013, 136–137, 239–247 CrossRef CAS.
- H. Einaga, N. Maeda, S. Yamamoto and Y. Teraoka, Catal. Today, 2015, 245, 22–27 CrossRef CAS.
- B. Zhu, X.-S. Li, P. Sun, J.-L. Liu, X.-Y. Ma, X. Zhu and A.-M. Zhu, Chin. J. Catal., 2017, 38, 1759–1769 CrossRef CAS.
- I. Jõgi, K. Erme, J. Raud and M. Laan, Fuel, 2016, 173, 45–51 CrossRef.
- F. Lin, Z. Wang, J. Shao, D. Yuan, Y. He, Y. Zhu and K. Cen, Chin. J. Catal., 2017, 38, 1270–1280 CrossRef CAS.
- B. M. Reddy and A. Khan, Catal. Rev., 2005, 47, 257–296 CrossRef CAS.
- V. K. Patel and S. Sharma, Catal. Today, 2020, 71, 53 Search PubMed.
- L. Qu, C. Li, G. Zeng, M. Zhang, M. Fu, J. Ma, F. Zhan and D. Luo, Chem. Eng. J., 2014, 242, 76–85 CrossRef CAS.
- G. A. R. L. McCormick, Catal. Today, 2000, 55, 269–280 CrossRef.
- R. Cui, S. Ma, J. Wang and S. Sun, Chemosphere, 2019, 234, 302–309 CrossRef CAS PubMed.
- E. Rezaei and J. Soltan, Chem. Eng. J., 2012, 198–199, 482–490 CrossRef CAS.
- R. Jin, Y. Liu, Z. Wu, H. Wang and T. Gu, Chemosphere, 2010, 78, 1160–1166 CrossRef CAS PubMed.
- P. G. Smirniotis, P. M. Sreekanth, D. A. Peña and R. G. Jenkins, Ind. Eng. Chem. Res., 2006, 45, 6436–6443 CrossRef CAS.
- D. Wang, H. Li, Q. Yao, S. Hui and Y. Niu, Green Energy Environ., 2020, 225, 134 Search PubMed.
- D. Wang, Q. Yao, S. Liu, S. Hui and Y. Niu, J. Energy Inst., 2019, 92, 1852–1863 CrossRef CAS.
- K. H. P. Reddy, B.-S. Kim, S. S. Lam, S.-C. Jung, J. Song and Y.-K. Park, Environ. Res., 2021, 195, 110876 CrossRef CAS PubMed.
- H. W. Ryu, M. Y. Song, J. S. Park, J. M. Kim, S.-C. Jung, J. Song, B.-J. Kim and Y.-K. Park, Environ. Res., 2019, 172, 649–657 CrossRef CAS PubMed.
- A. Jankowska, A. Chłopek, A. Kowalczyk, M. Rutkowska, W. Mozgawa, M. Michalik, S. Liu and L. Chmielarz, Microporous Mesoporous Mater, 2021, 315, 110920 CrossRef CAS.
- J. Li, J. Guo, X. Shi, X. Wen, Y. Chu and S. Yuan, Appl. Surf. Sci., 2020, 534, 147592 CrossRef CAS.
- D. Wang, Q. Yao, C. Mou, S. Hui and Y. Niu, Fuel, 2019, 254, 115719 CrossRef CAS.
- G. S. Pozan, J. Hazard. Mater., 2012, 221–222, 124–130 CrossRef CAS PubMed.
- J. Li, L. Li, W. Cheng, F. Wu, X. Lu and Z. Li, Chem. Eng. J., 2014, 244, 59–67 CrossRef CAS.
- Q. Shen, L. Zhang, N. Sun, H. Wang, L. Zhong, C. He, W. Wei and Y. Sun, Chem. Eng. J., 2017, 322, 46–55 CrossRef CAS.
- L. Liu, B. Wang, X. Yao, L. Yang, W. Jiang and X. Jiang, Fuel, 2021, 283, 119336 CrossRef CAS.
- D. Fang, J. Xie, H. Hu, H. Yang, F. He and Z. Fu, Chem. Eng. J., 2015, 271, 23–30 CrossRef CAS.
- X. Zhang, H. Zhao, Z. Song, W. Liu, J. Zhao, Z. a. Ma, M. Zhao and Y. Xing, Appl. Surf. Sci., 2019, 493, 9–17 CrossRef CAS.
- J. Liu, R. Guo, M. Li, P. Sun, S. Liu, W. Pan, S. Liu and X. Sun, Fuel, 2018, 223, 385–393 CrossRef CAS.
- C. Alessandro and I. Valerio, J. Catal., 1974, 33, 493–496 CrossRef.
- S. Ma, X. Wang, T. Chen and Z. Yuan, Chem. Eng. J., 2018, 354, 191–196 CrossRef CAS.
- X. Chen, Z. Zhao, S. Liu, J. Huang, J. Xie, Y. Zhou, Z. Pan and H. Lu, J. Rare Earths, 2020, 38, 175–181 CrossRef CAS.
- C. Reed, Y.-K. Lee and S. T. Oyama, J. Phys. Chem. B, 2006, 110, 4207–4216 CrossRef CAS PubMed.
- F. Gao, X. Tang, H. Yi, S. Zhao, W. Zhu and Y. Shi, J. Environ. Sci., 2020, 89, 145–155 CrossRef PubMed.
- W. Li and F. Fu, Microporous Mesoporous Mater., 2020, 298, 110060 CrossRef CAS.
- N. I. Cuello, V. R. Elías, C. E. Rodriguez Torres, M. E. Crivello, M. I. Oliva and G. A. Eimer, Microporous Mesoporous Mater., 2015, 203, 106–115 CrossRef CAS.
- Q. Chen, R. Guo, Q. Wang, W. Pan, W. Wang, N. Yang, C. Lu and S. Wang, Fuel, 2016, 181, 852–858 CrossRef CAS.
- J. Jia, P. Zhang and L. Chen, Appl. Catal., B, 2016, 189, 210–218 CrossRef CAS.
- V. P. Santos, M. F. R. Pereira, J. J. M. Órfão and J. L. Figueiredo, Top. Catal., 2009, 52, 470–481 CrossRef CAS.
- B. Zhao, R. Ran, X. Wu and D. Weng, Appl. Catal., A, 2016, 514, 24–34 CrossRef CAS.
- K. I. Hadjiivanov, Catal. Rev., 2000, 42, 71–144 CrossRef CAS.
- L. Li, Q. shen, J. Cheng and Z. Hao, Catal. Today, 2010, 158, 361–369 CrossRef CAS.
- X. Yao, L. Chen, J. Cao, Y. Chen, M. Tian, F. Yang, J. Sun, C. Tang and L. Dong, Chem. Eng. J., 2019, 369, 46–56 CrossRef CAS.
- G. Qi and W. Li, Catal. Today, 2015, 258, 205–213 CrossRef CAS.
- Z. Fan, J.-W. Shi, C. Gao, G. Gao, B. Wang, Y. Wang, C. He and C. Niu, Chem. Eng. J., 2018, 348, 820–830 CrossRef CAS.
- W. Li, H. Liu, M. Zhang and Y. Chen, RSC Adv., 2019, 9, 31035–31042 RSC.
- Y. Huang, Y. Yang, H. Hu, M. Xu, H. Liu, X. Li, X. Wang and H. Yao, Proc. Combust. Inst., 2019, 37, 2951–2957 CrossRef CAS.
- Y. Xie, Y. Chen, Y. Ma and Z. Jin, J. Hazard. Mater., 2011, 195, 223–229 CrossRef CAS PubMed.
- E. Gao, H. Pan, W. Zhang, Y. Li, G. Cao, M. T. Bernards, Y. He and Y. Shi, Chem. Eng. J., 2020, 386, 123956 CrossRef CAS.
- L. Wei, S. Cui, H. Guo and L. Zhang, Comput. Mater. Sci., 2018, 144, 216–222 CrossRef CAS.
- N. Tang, Y. Liu, H. Wang and Z. Wu, J. Phys. Chem. C, 2011, 115, 8214–8220 CrossRef CAS.
- F. Gao, C. Chu, W. Zhu, X. Tang, H. Yi and R. Zhang, Appl. Surf. Sci., 2019, 479, 548–556 CrossRef CAS.
- Y. Liu and P. Zhang, Appl. Catal., A, 2017, 530, 102–110 CrossRef CAS.
- W. Cai, Y. Zhao, M. Chen, X. Jiang, H. Wang, M. Ou, S. Wan and Q. Zhong, Chem. Eng. J., 2018, 333, 414–422 CrossRef CAS.
Footnote |
| † Electronic supplementary information (ESI) available. See DOI: 10.1039/d1ra01820e |
| This journal is © The Royal Society of Chemistry 2021 |

