 Open Access Article
How to identify a smoker: a salient crystallographic approach to detect thiocyanate content†
Khushboo Iman‡
 a,
M. Naqi Ahamad‡
 a,
Monikab,
Azaj Ansari
 b,
Hatem A. M. Saleha,
M. Shahnawaz Khan
 a,
Musheer Ahmad
 c,
Rosenani A. Haque
 d and
M. Shahid
 *a
*a
aFunctional Inorganic Materials Lab (FIML), Department of Chemistry, Aligarh Muslim University, Aligarh 202002, India. E-mail: shahid81chem@gmail.com
bDepartment of Chemistry, Central University of Haryana, Mahendergarh 123031, Haryana, India
cDepartment of Applied Chemistry (ZHCET), Aligarh Muslim University, Aligarh 202002, India
dSchool of Chemical Sciences, Universiti Sains Malaysia, USM, 11800, Penang, Malaysia
First published on 7th May 2021
Abstract
There is an increasing demand for monitoring environmental pollutants and the control requires new sensing materials with better sensitivity, selectivity and reliability. In this study, a series of Co7 clusters incorporating various flexible polyhydroxyamine ligands are explored, with the first report of thiocyanate recognition triggered by crystal formation using a Co7 crystal (1). For this, we have fortunately synthesized three new mixed metal Co7 clusters with fascinating structural features. The clusters were characterized by spectroscopic and single crystal X-ray diffraction methods and later by DFT calculations. Due to its better emission spectrum, 1 was further utilized for evaluating its sensing ability towards various anions in water. Surprisingly, 1 shows better quenching ability towards the recognition of SCN− with a better binding constant. The luminescence quenching towards SCN− detection was further verified by the single crystal method, HSAB principle (symbiosis) and theoretical calculations such as DFT studies. The SCXRD data clearly suggest that the Co7 (1) can be converted into Co14 (1a) by direct reaction with NaSCN under ambient conditions. Besides the soft/hard acid–base concept (symbiosis), the energies of formation, and Co–NCS and Co–OH2 bond energies (as unravelled by DFT) are responsible for this transformation. Therefore, 1 can be used as a selective and sensitive sensor for the detection of thiocyanate anions based on the fluorescence amplification and quenching method. Further, the designed cluster has also been utilized to detect anions in human blood samples to differentiate a smoker and a non-smoker. It has been concluded that the samples of smokers have a high degree of thiocyanate (∼12 or 9.5 mg L−1) in comparison to those of non-smokers (2–3 mg L−1). Thus, this kind of cluster material has high potentiality in the field of bio-medical science in future endeavours for identification of the extent of thiocyanate content in smokers.
1. Introduction
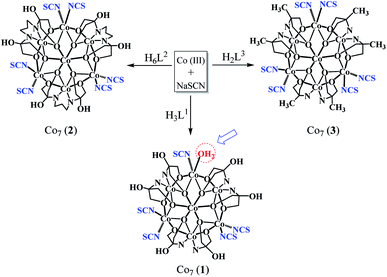
Over the past two decades, the toxicological extent of thiocyanate has been clear as its toxicity is like cyanide, which has received much attention from researchers in various fields such as environmental science, food chemistry, and medicine.1 Thiocyanate anion (SCN−) is extracted from different sources, such as manufacturing processes, e.g. industrial wastewater, organism metabolites, pesticide residues, fabric dyeing, hydrometallurgy, electroplating, and photofinishing, tobacco smoke, diet and even car exhaust,2 which presents a significant threat to the atmosphere and the human body as a result of its cumulative action. SCN− could be turned to extremely radioactive cyanide by irradiation and chlorination, resulting in serious health and environmental issues.3 Tobacco smoke contains high concentrations of this ion and clinical tests have found that the concentration of saliva thiocyanate is greater for smokers than for non-smokers. Therefore, the thiocyanate concentration is known to be a successful test to differentiate between smokers and non-smokers.4 In addition, SCN− appears to become a small metabolite of CN−, the aggregation of which results from access to prolonged tobacco smoke.5 Specifically, SCN− can effectively inhibit thyroid gland absorption of iodide ions, resulting in less thyroxine and iodide deficiency, which is more severe for pregnant women and babies.6 In food analysis, the development of techniques for SCN− detection has gained substantial interest. For the detection of SCN−, there are several techniques such as voltammetry,7 ion chromatography,8,9 capillary zone electrophoresis,10 high performance liquid chromatography (HPLC),11 flow injection analysis,12 fluorescence approaches,13–15 colorimetry,16–18 and surface-enhanced Raman scattering (SERS).19,20 While these methods are quite useful for SCN-detection, several of them need sophisticated instruments, time-consuming methods, technical expertise and even costly or toxic reagents for sample pre-treatment. In addition, some of them eventually interact with some other coexisting anions. Therefore, it is very important to establish a simple, quick and sensitive method for the detection of SCN. Biomonitoring is an emerging area that combines environmental monitoring and public health surveillance. It involves the collection of samples of human biospecimens such as blood, saliva, or urine for measuring human exposure to chemical substances. Biomarkers are defined as an indicator of a certain physiological or pathophysiological condition for the purpose of biomonitoring. Thiocyanate anion, a detoxification product of cyanide in urine, saliva and blood, is a biomarker of exposure to tobacco smoke components and distinguishes smokers from non-smokers. Thiocyanate ion is naturally present in human body fluids and its concentration varies according to diet but its high concentration exhibits an evil effect among other factors, which is characterized by a relatively long half-life in the human body, i.e., 6 days.21 But its concentration increases when there is an exposure to cyanide. It has been found that smokers have significantly higher amounts of SCN in their urine and saliva than non-smokers. The concentration of thiocyanate ion in the saliva of non-smokers ranges between 0.5 and 2 mM, while in smokers concentrations as high as 6 mM can be found.1 In this manuscript, we present three mixed-valent heptanuclear cobalt clusters (1, 2 and 3) (Scheme 1) designed by the use of three different flexible polyhyrdoxylamine ligands viz. tris(hydroxymethyl)amino methane (H3L1), {2-[bis(2-hydroxyethyl) amino]-2-(hydroxymethyl) propane-1,3-diol} (H6L2) and 2-amino-2-methyl-1,3-propanediol (H2L3) respectively, acting as multidentate ligands (Scheme 2) and NaSCN as an auxiliary ligand. The clusters thus obtained, [Co4ΙΙCo3ΙΙΙ(H3L1)5(μ2-O)6(μ3-O)6(NCS)5H2O] (1), [Co4IICo3III(H6L2)3(μ2-O)6(μ3-O)6(NCS)6] (2) and [CoII4CoΙΙΙ3(L3)6(μ2-O)6(μ3-O)6(NCS)6] (3), contain a similar Co7 core. Coordination of ligands is almost similar in such a way that 2 and 3 are alike and comprise 6 Co-NCS bonds while 1 differs comparatively, ligated by 5 NCS and 1 H2O molecule to peripheral cobalt centres. We take advantage of this peculiar feature and successfully replaced the water molecule in 1 with NaSCN. Consequently, reaction of 1 with SCN results in the NaSCN (guest) induced monomeric (Co7) to sodium bridged dimeric (Co14) direct transformation, thus leading to the detection of thiocyanate by 1.2. Experimental
2.1. Materials and methods
All reagents including H3L1, H6L2, H2L3, NaOH, NaSCN, CoCl2·6H2O and Co(OAc)2·4H2O are of analytical grade which have been purchased from Sigma-Aldrich Chemical Co., India, and are used without further purification. All experiments were performed in compliance with the authors' institute's policy on animal use and ethics.2.2. Physical methods
The FTIR spectra of the compounds were recorded within the range 4000–400 cm−1 using KBr pellets on a PerkinElmer Model spectrum GX spectrophotometer. Fluorescence measurements are made on a Hitachi F-2700 spectrophotometer. The electronic absorption spectra (900–200 nm) of the complexes are recorded at room temperature using a PerkinElmer Lambda-45 UV-vis spectrophotometer, with cuvettes of 1 cm path length. PXRD patterns have been recorded with a “Miniflexll X-ray diffractometer” with Cu-Kα radiation. Single crystal X-ray diffraction of the complexes was performed at 296 K on a Bruker SMART APEX CCD diffractometer. Thermal gravimetric analysis (TGA) data are measured from room temperature to 550 °C at a heating rate of 20 °C min−1. A Shimadzu TGA-50H instrument is used for the TGA data collection.2.3. Computational details
All the calculations were computed using Gaussian 09 program.22 A fragmentation approach is available in Gaussian which was used for the calculations. From our previous studies,23–25 we concluded that the B3LYP-D226–28 functional is the most suitable functional for the spin states and the energetics; thus, here we have confined our calculations on the B3LYP-D2 functional incorporating dispersion correction of Grimme et al. The LACVP basis set comprising the LanL2DZ Los Alamos effective core potential for Co29–31 and a 6-31G32,33 basis set for the other atoms (hydrogen, carbon, nitrogen, oxygen and sulphur) was used for the single point calculations.2.4. X-ray crystal structure determination and refinements
Single-crystal X-ray data of 1, 2 and 1a are collected at 100 or 298 K on a Bruker SMART APEX CCD diffractometer using graphite monochromated Mo-Kα radiation (λ = 0.71073 Å). The crystal structure data were collected using graphite monochromated Mo-Kα radiation (λ = 0.71073 Å). The international X-ray crystallography tables have taken the linear absorption coefficients, the dispersion factors of the atoms, and the unusual dispersion corrections.34 SAINT software has been used to facilitate data integration and reduction.35 The collected reflections were corrected by empirical absorption with SADABS,36 and an XPREP determination of the complex space group was carried out. Both of the structures were refined using Olex2.Refine37–39 and solved with SIR-97.39 The complex solution was performed using the direct solution method. CCDC reference numbers for 1, 2 and 1a are, respectively, 2005500, 2005499 and 2005498.†2.5. Designing of 1–3
![[thin space (1/6-em)]](https://www.rsc.org/images/entities/char_2009.gif) :
:![[thin space (1/6-em)]](https://www.rsc.org/images/entities/char_2009.gif) 5 v/v MeOH
5 v/v MeOH![[thin space (1/6-em)]](https://www.rsc.org/images/entities/char_2009.gif) :
:![[thin space (1/6-em)]](https://www.rsc.org/images/entities/char_2009.gif) H2O mixture (10 mL) is added to a solution of H3L1 (0.121 g, 1 mmol) in a 95
H2O mixture (10 mL) is added to a solution of H3L1 (0.121 g, 1 mmol) in a 95![[thin space (1/6-em)]](https://www.rsc.org/images/entities/char_2009.gif) :
:![[thin space (1/6-em)]](https://www.rsc.org/images/entities/char_2009.gif) 5 v/v MeOH
5 v/v MeOH![[thin space (1/6-em)]](https://www.rsc.org/images/entities/char_2009.gif) :
:![[thin space (1/6-em)]](https://www.rsc.org/images/entities/char_2009.gif) H2O mixture (25 mL), which turns the colorless solution into blue. After stirring for 1 h, methanolic solution of sodium thiocyanate (0.081 g, 1 mmol) is added to give a purple color solution and the resultant solution is stirred for 6 h at room temperature. Slow evaporation of the solvent at room temperature led to the formation of purple block-shaped crystals suitable for single-crystal X-ray diffraction within a period of 25 days.
H2O mixture (25 mL), which turns the colorless solution into blue. After stirring for 1 h, methanolic solution of sodium thiocyanate (0.081 g, 1 mmol) is added to give a purple color solution and the resultant solution is stirred for 6 h at room temperature. Slow evaporation of the solvent at room temperature led to the formation of purple block-shaped crystals suitable for single-crystal X-ray diffraction within a period of 25 days.Anal calc. (%): C 24.37, H 3.38, N 9.80; found for C29H48Co7N10O20S5: C 24.44, H 3.35, N 9.76. TGA: temperature range/°C (weight loss%): 20–250 (5.10%); 250–460 (34%); 460–550 (39.39%). FTIR spectra (KBr pellets, cm−1): ν(H2O): 3469, 3416; ν(SCN): 2070; ν(O–H): 3416 ν(C–H): 2865; ν(C–O): 1639, 1617; ν(NH2): 3242, ν(Co–O–Co): 807, 928.
Anal calc. (%): C 28.88, H 3.73, N 10.36; found for C39H60Co7N12O20S6: C 28.51, H 3.30, N 9.66. TGA: temperature range/°C (weight loss%): 20–250 (8.8%); 250–500 (36.22%); 500–600 (29.30%). FTIR spectra (KBr pellets, cm−1): ν(O–H): 3240, 3518; ν(C–H): 2436; ν(SCN): 2075; ν(C–O): 1646; ν(NH2): 3216; ν(Co–O–Co): 945 and 825.
3. Results and discussion
3.1. Description of crystal structures
Single crystal X-ray data (Table 1) reveal that 1 crystallizes in the monoclinic space group P21/n to give a mixed-valence heptanuclear cobalt complex [Co7(H3L1)6(μ2-O)6(μ3-O)6(NCS)5H2O] (Fig. 1). The star shaped metal core is formed by the bridging of six μ2-alkoxo groups between six cobalt ions on the rim which are linked to the central cobalt ion through six μ3-alkoxy bridging groups, resulting in a structure which is best described as a wheel-shaped disc like structure. Co1 and Co3 on the rim adopt CoN2O4 configuration ligated by two NCS, two μ2-alkoxo groups and two μ3-alkoxy groups each. Co5 adopts CoNO5 configuration ligated by one NCS, one water molecule, two μ2-alkoxo groups and two μ3-alkoxy groups. Co2, Co4 and Co6 adopt CoN2O4 configuration ligated by two H3L1, two μ2-alkoxo groups and two μ3-alkoxy groups. The central cobalt ion Co7 is ligated by six μ3-alkoxy groups. All the cobalt centres have a distorted octahedron geometry. The asymmetric unit of 1 consists of one complete [Co7(H3L1)6(μ2-O)6(μ3-O)6(NCS)5H2O] unit, two water molecules and one free oxygen atom. Bond-valence sum calculations (Table S1†) and charge consideration establish that Co1, Co3, Co5 and Co7 are in the +2 oxidation state while Co2, Co4 and Co6 are in the +3 oxidation state. Moreover, the hydrogen atoms of the coordinated H3L1 in 1 form moderately strong hydrogen bonds (C4–H1b⋯Ο6 = 2.422 Å; C18–H18⋯O4 = 2.704 Å; O4–H4⋯O17 = 2.161 Å) with the acceptor oxygen atoms of neighboring H3L1. The packing features of 1 reveal a 1D chain as a result of non-covalent interactions as illustrated in Fig. S1 and S2.† 2 crystallizes in the triclinic space group P![[1 with combining macron]](https://www.rsc.org/images/entities/char_0031_0304.gif) to give a mixed-valence heptanuclear cobalt complex, [Co7(H6L2)3(μ2-O)6(μ3-O)6(NCS)6] (Fig. 1). All the cobalt centers have a distorted octahedral geometry. The asymmetric unit of 2 is similar to that of 1 and consists of one complete unit of [Co7(H6L2)3(μ2-O)6(μ3-O)6(NCS)6] (Fig. 1) and two lattice water. Bond-valence sum calculations confirm Co3, Co4 and Co7 to be in +3 the oxidation state while Co1, Co2, Co5 and Co6 in the +2 state (Table S1†). Moreover, the coordinated H6L2 in 2 forms strong hydrogen bonds (O031–H031⋯O026 = 1.873 Å) with the acceptor oxygen atoms of neighboring H6L2. The packing diagram of 2 indicates the existence of a 2D sheet due to the non-covalent interactions (Fig. S1 and S3†). The crystal structure of 3 i.e., [CoII4CoIII3(L3)6(μ2-O)6(μ3-O)6(NCS)6] is already given in our earlier report33 (Fig. 1), so there is no need to discuss it here and this complex has been taken into consideration for comparison purpose only.40,41
to give a mixed-valence heptanuclear cobalt complex, [Co7(H6L2)3(μ2-O)6(μ3-O)6(NCS)6] (Fig. 1). All the cobalt centers have a distorted octahedral geometry. The asymmetric unit of 2 is similar to that of 1 and consists of one complete unit of [Co7(H6L2)3(μ2-O)6(μ3-O)6(NCS)6] (Fig. 1) and two lattice water. Bond-valence sum calculations confirm Co3, Co4 and Co7 to be in +3 the oxidation state while Co1, Co2, Co5 and Co6 in the +2 state (Table S1†). Moreover, the coordinated H6L2 in 2 forms strong hydrogen bonds (O031–H031⋯O026 = 1.873 Å) with the acceptor oxygen atoms of neighboring H6L2. The packing diagram of 2 indicates the existence of a 2D sheet due to the non-covalent interactions (Fig. S1 and S3†). The crystal structure of 3 i.e., [CoII4CoIII3(L3)6(μ2-O)6(μ3-O)6(NCS)6] is already given in our earlier report33 (Fig. 1), so there is no need to discuss it here and this complex has been taken into consideration for comparison purpose only.40,41
| Empirical formula | C29H49Co7N11O22S5 (1) | C60H112Co14N24Na2O48S12 (1a) | C38H64Co7N12O18.5S6 (2) |
|---|---|---|---|
| Formula weight | 1476.64 | 3193.53 | 1621.91 |
| Temperature/K | 100(2) | 100(2) | 100(2) |
| Crystal system | Monoclinic | Triclinic | Triclinic |
| Space group | P21/n | P![[1 with combining macron]](https://www.rsc.org/images/entities/char_0031_0304.gif) |
P![[1 with combining macron]](https://www.rsc.org/images/entities/char_0031_0304.gif) |
| a/Å | 10.4402(5) | 10.6166(4) | 12.3559(8) |
| b/Å | 22.5053(11) | 13.9034(5) | 12.4348(8) |
| c/Å | 22.5028(11) | 19.5343(6) | 20.8341(13) |
| α/° | 90 | 94.8730(10) | 82.586(2) |
| β/° | 90.962(2) | 102.5290(10) | 81.206(2) |
| γ/° | 90 | 92.8500(10) | 68.792(2) |
| Volume/Å3 | 5286.5(4) | 2797.67(17) | 2939.7(3) |
| Z | 4 | 1 | 1 |
| ρcalc, g cm−3 | 1.8552 | 1.8954 | 1.7961 |
| μ/mm−1 | 2.423 | 2.343 | 2.216 |
| F(000) | 2993.6 | 1623.2 | 1625.0 |
| Crystal size/mm3 | 0.31 × 0.2 × 0.15 | 0.36 × 0.23 × 0.14 | 0.47 × 0.38 × 0.19 |
| Radiation | Mo Kα (λ = 0.71073) | Mo Kα (λ = 0.71073) | Mo Kα (λ = 0.71073) |
| 2θ range for data collection/° | 4.28 to 50.1 | 5.08 to 50.1 | 5.02 to 50.1 |
| Index ranges | −13 ≤ h ≤ 13, −30 ≤ k ≤ 30, −29 ≤ l ≤ 29 | −14 ≤ h ≤ 14, −18 ≤ k ≤ 18, −25 ≤ l ≤ 26 | −16 ≤ h ≤ 16, −16 ≤ k ≤ 16, −27 ≤ l ≤ 27 |
| Reflections collected | 82![[thin space (1/6-em)]](https://www.rsc.org/images/entities/char_2009.gif) 786 786 |
45![[thin space (1/6-em)]](https://www.rsc.org/images/entities/char_2009.gif) 252 252 |
48![[thin space (1/6-em)]](https://www.rsc.org/images/entities/char_2009.gif) 182 182 |
| Independent reflections | 9357 [Rint = 0.0945, Rsigma = 0.0643] | 9901 [Rint = 0.0662, Rsigma = 0.0711] | 10![[thin space (1/6-em)]](https://www.rsc.org/images/entities/char_2009.gif) 401 [Rint = 0.0407, Rsigma = 0.0438] 401 [Rint = 0.0407, Rsigma = 0.0438] |
| Data/restraints/parameters | 9357/0/680 | 9901/0/731 | 10![[thin space (1/6-em)]](https://www.rsc.org/images/entities/char_2009.gif) 401/0/758 401/0/758 |
| Goodness-of-fit on F2 | 1.095 | 1.048 | 1.046 |
| Final R indexes [I ≥ 2σ(I)] | R1 = 0.0535, wR2 = 0.1338 | R1 = 0.0501, wR2 = 0.1150 | R1 = 0.0784, wR2 = 0.2110 |
| Final R indexes [all data] | R1 = 0.0768, wR2 = 0.1572 | R1 = 0.0696, wR2 = 0.1297 | R1 = 0.0877, wR2 = 0.2202 |
| Largest diff. peak/hole/e Å−3 | 2.00/−2.10 | 2.41/−1.24 | 3.18/−3.28 |
3.2. FTIR and thermal gravimetric analysis (TGA) and PXRD pattern of 1–3
The colored crystals of the compounds are given in Fig. 2a. Bands due to the coordinated H3L1 and H6L2 ligands are investigated in many regions. Metal complexes exhibit bands at approximately 3412 cm−1 (1) and 3468 cm−1 (2) due to ν(O–H) stretching vibrations. Broad bands at approximately at 3242 cm−1 (1) and 3216 cm−1 (2) correspond to ν(NH2) stretching vibrations. The broad nature of these bands can be attributed to the presence of hydrogen bonding interactions. The ν(C–H) stretching vibrations occur as several medium to weak intensity bands at 2900 cm−1. The presence of the CH2 group is further verified from the observed CH2 bending frequency at 1450 cm−1. The bands appearing in the 1639 and 1617 region are characteristic of ν(C–O) for 1 and 2. Further, 1 and 2 exhibit a sharp peak approximately at 2070 and 2071, attributed to ν(SCN−) stretching vibrations. The bands appearing around 945, 825 and 807, 928 cm−1 are characteristic of a bridging M–O–M group in 1 and 2. The bands observed in the low frequency region (430–520 cm−1) are due to M–N and M–O stretching vibrations (Fig. 2b).42 Thermal gravimetric analysis (TGA) is carried out under an N2 atmosphere at a rate of 10 °C min−1 to investigate the thermal fragmentation patterns of 1 and 2 (Fig. 2c). The thermogram for 1 shows that the complex eliminates water molecules at temperatures up to 200 °C. The % weight loss of 4% in the first step corresponds to the exact number of two lattices along with one coordinated water molecule present as proposed from the analytical data and crystal structures. Above this temperature, the complex species undergo fragmentation in two more steps. In the second step, the removal of the four amino alcohol ligands takes place in the temperature range 250–460 °C, with a weight loss of 34%. A further increase in the temperature up to 550 °C gives rise to the elimination of coordinated thiocyanate ligands from the rest of the compound with a weight loss of 39%. Beyond the temperature of 550 °C, the rest of the metal oxide compound starts to decompose.43 The thermogram for 2 shows that the complex eliminates thiocyanate ligands at temperatures up to 250 °C. The weight loss of 8% in this first step corresponds to the exact number of four coordinated thiocyanate ligands from the coordination sphere as proposed from the analytical data and crystal structures. Above this temperature, the complex species undergo fragmentation in two more steps. In the second step, the removal of the three amino alcohol ligands along with two thiocyanate ligands takes place in the temperature range 250–500 °C, with a weight loss of 36%. A further increase in the temperature up to 600 °C gives rise to the elimination of rest of the metal oxide compound from the rest of the compound with a weight loss of 29%. Moreover, the simulated and as-synthesized powder X-ray diffraction (PXRD) patterns are identical for the clusters, indicating bulk purity (Fig. 2d).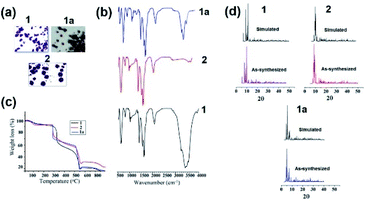 | ||
| Fig. 2 (a) Crystals, (b) FTIR, and (c) TGA plots of 1, 1a and 2 respectively. (d) As-synthesized and simulated PXRD patterns of 1, 2 and 1a. | ||
3.3. Sensing application of 1
 | (1) |
 | (2) |
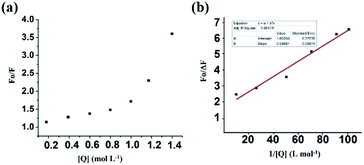 | ||
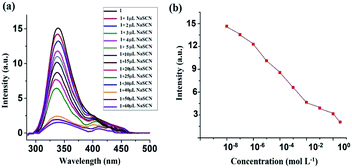
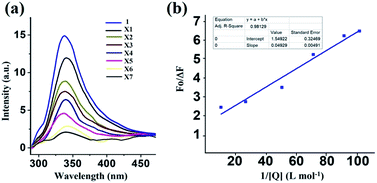
| Fig. 5 (a) SV plot of the 1 in the presence of different thiocyanate ion concentrations. (b) Modified SV plot of 1 in the presence of NaSCN. | ||
Here, F0 and F are the fluorescence intensities before and after the addition of the quencher, [Q] denotes the quencher concentration and fa is the fraction of the fluorophore accessible to the quencher. Ka is the binding constant, which is obtained with the help of the intercept and slope (Fig. 5). The plot of F0/ΔF versus 1/[Q] for the present fluorophore-quencher system gives rise to a straight line (Fig. 5), which gives rise to the binding constant (Ka). The value of Ka is found to be 32.78 L mol−1, which shows appreciable binding between the fluorophore and quencher.
From the plot, x = 33.6, y = 3.24; 3.24 = 1.6 + 1.6 × 33.6 × 1/Ka; 1/Ka = 1.64/53.76; Ka = 32.78.
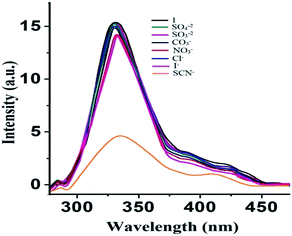
Furthermore, to study any effects of the cationic part of the thiocyanate, potassium thiocyanate was taken with different concentrations. Interestingly, spectral behaviour as well as the binding constant has been found to be approximately the same as that of sodium thiocyanate (Fig. 7), which shows that there is no role of the cationic counterpart in the thiocyanate sensing process. Consequently, it may be concluded that 1 can sense thiocyanate ions selectively.
From the plot, x = 51.82, y = 4.10, 4.02 = 1.54 + 1.54 × 51.82 × 1/Ka, 1/Ka = 2.48/79.80, Ka = 32.18.
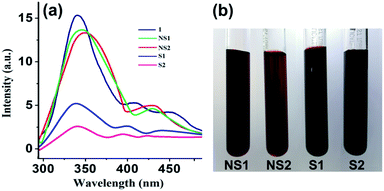
The comparative quenching effect reveals that the smoker blood contains more thiocyanate than its non-smoker counterpart. To evaluate the quantitative degree of smoking, a standard curve (PI vs. various synthetic solutions containing blood serum and a known amount of thiocyanate within 2–12 mg L−1) has been plotted. Comparing the results of real samples with the standard curve, it has been concluded that the sample S2 has a high degree of thiocyanate (∼12 mg L−1) while sample S1 has a slightly low degree of thiocyanate (∼9.5 mg L−1). In contrast, the concentration of thiocyanate has been found in the range 2–3 mg L−1 in the blood serum of non-smokers.
3.4 Mechanism of SCN− detection
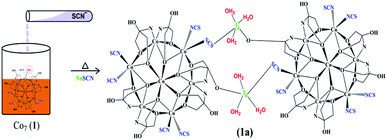
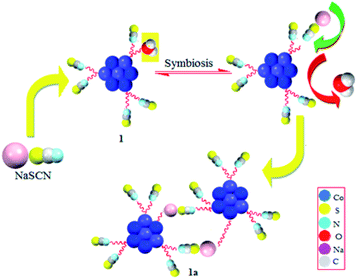
To understand the mechanism behind the detection of SCN− in the aqueous medium, we have adopted three different methods to justify it. The first method involves the transformation of 1 into 1a by simple reaction of 1 with NaSCN to form a suitable crystal for X-ray (Scheme 3). Secondly, we have performed the theoretical calculations to understand this transformation. Finally, the transformation can be easily defined by HSAB principle (symbiosis effect) as suggested in Scheme 4.![[1 with combining macron]](https://www.rsc.org/images/entities/char_0031_0304.gif) (Table 1). The NaSCN molecule replaces H2O via simple transformation without changes of the core (Fig. 1).
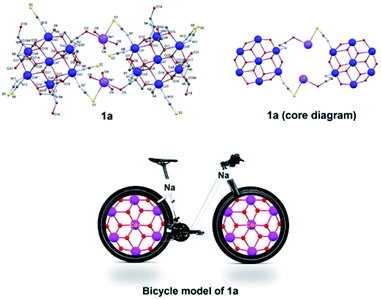
(Table 1). The NaSCN molecule replaces H2O via simple transformation without changes of the core (Fig. 1).Coordination mode around one cobalt ion in one monomeric unit that is coordinated to a water molecule gets replaced by the μ-Na(SCN)(H2O)3 entity, which is further bound to the oxygen atom of H3L1 of another monomeric Co7 unit to give a dimer like structure bridged by sodium cations. The asymmetric unit of 1a consists of a [{Co4IICo3III(H3L1)6(NCS)5(μ2-O)6(μ3-O)6Na(μ-Na(SCN){H2O}3)] unit which is one half of the complete molecule of 1a, and three free water molecules. Interestingly, Na–S is a weak bond which is a bit longer (3.013(5) Å), but taking it as a bong cannot be ruled out. Bond Valence Sum (BVS) analysis also suggests it to be weaker than the Na–O bonds, but definitely significant. This molecule (1a) is a rare example of existence of a longer Na–S bond and sodium bridging consolidating the two Co7 units together just as the bonding rods of the two rims of a bicycle (Fig. 9). The packing diagram of 1a exhibits existence of a 2D chain as a result of C–H⋯O interactions (Fig. S4, ESI†). O–H⋯S and S⋯S interactions (Fig. S5, ESI†) in 1a also plays a key role in consolidating the supramolecular framework.46
The FTIR spectrum of 1a reveals ample information regarding the structure of transformed cluster (Fig. 2b). It shows a peak at 3448 cm−1 due to ν(O–H) stretching vibrations and a peak near 3241 cm−1 corresponding to ν(NH2) stretching vibrations. The 1a also shows a peak in the 1646 cm−1 region, characteristic of ν(C–O) and a sharp peak at 2075 cm−1 corresponding to ν(SCN−) binding with the central metal ion. The M–O–M group stretching vibrations were observed at 811 and 938 cm−1 in the present cluster. The thermogram for 1a indicates that the dimer eliminates water molecules at temperatures up to 180 °C. The weight loss of 3.5% in the first step corresponds to the exact number of six water molecules coordinated to two sodium metal ions present as proposed from the analytical data and crystal structures. In the second step, the complex eliminates thiocyanate ligands at temperatures up to 250 °C. The weight loss of 21% in this step corresponds to the exact number of eight coordinated thiocyanate ligands from the coordination sphere. In the next step, the removal of the six amino alcohol ligands along with two remaining thiocyanate ligands takes place in the temperature range 250–550 °C, with a weight loss of 28%. A further increase in the temperature up to 600 °C gives rise to the elimination of rest of the metal oxide compound from the rest of the compound with a weight loss of 24% (Fig. 2c). Further the PXRD experiment was also performed to understand the bulk purity of the crystals. The PXRD patterns are almost the same in simulated and experimental forms, corroborating the bulk purity of 1a (Fig. 2d).
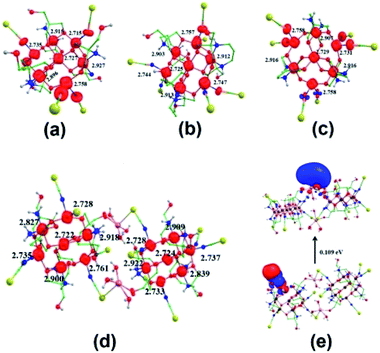 | ||
| Fig. 10 Computed spin density plots of 1 (a), 2 (b) and 3 (c); computed spin density plot for 1a (d) and HOMO–LUMO gap between the frontier molecular orbitals of 1a (e). | ||
We have studied the formation energy of complexes taking into account the monocentric cobalt system along with coordinated ligands and also substituted SCN/H2O with H2O/SCN along with neighbouring cobalt centers (see Fig. 11). The computed results show that the formation energies of 2 and 3 are relatively more stable than that of 1 by 2161.0 and 3458.0 kJ mol−1, respectively. We have again computed the formation energies, by considering a monocenter along with coordinated ligands, for 2 and 3 which are relatively more stable by 507.0 and 827.0 kJ mol−1, respectively, than that of 1. We have also modelled the structure by replacing the SCN by H2O at the Co5 center, one of the SCN molecules by H2O at the Co1, and one SCN by H2O at each Co1 and Co3 center of 1 and observed that the stability of the molecule decreases in each case by 436.3, 375.7 and 977.4 kJ mol−1, respectively. The computed bond strengths of Co–OH2 and Co–SCN further show that the Co–OH2 is weaker (65.8 kJ mol−1) than Co–SCN (553.7 kJ mol−1), which concludes that coordination of water molecules can decrease the stability of 1 and dimerization can take place at the Co–OH2 center easily.
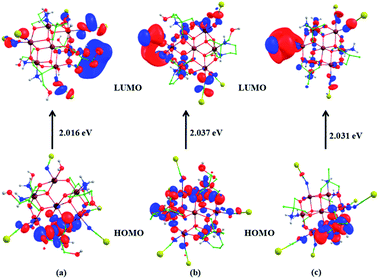
This corroborates this rare transformation dimerization of 1 into 1a. This elucidated the reason behind the detection of SCN by 1 in the aqueous medium. For investigating why 2 and 3 do not get dimerize, we have again modelled 2 and 3 by replacing one of the SCN at a cobalt center by a water molecule and the results show that the stability of the complexes decreases by 185.6 and the 163.2 kJ mol−1, respectively. The computed dissociation energies of Co–SCN in 2 and 3 are significantly very high, 578.3 and 588.8 kJ mol−1, for cleaving the bonds and this prevents any dimerization in the cases of 2 and 3, thus assuring the sensing ability of 1. Further, the HOMO–LUMO energy gap of 1, 2 and 3 is 2.016, 2.037 and 2.031 eV, respectively (Fig. 12). The Mulliken frontier molecular-orbital composition for 1 shows a significant charge contribution on cobalt centers (Table S4, ESI†). These significant differences in charge contributions along with the lowest HOMO–LUMO gap also support that 1 may show higher activity to a chemical transformation (recognition of thiocyanate). The spin density plot for 1a and the HOMO–LUMO energy gap (ΔE) between frontier molecular orbitals are also calculated and depicted in Fig. 10 and 12, respectively. It is interesting to note that the magnitude of ΔE for the Co14 species, 1a (2.109 eV), obtained after transformation is much lesser than that calculated for the monomeric Co7 species, 1 (2.016 eV). This assures that the transformed product could be less stable and is generated in solution for a while in the form of crystals,23,25,48 which have instantly been diffracted.
4. Conclusion
In summary, we report here three Co-based clusters with their complete crystallographic and theoretical analysis. 1 has been utilized as a chemosensor for the detection of thiocyanate selectively in the aqueous medium. 1 was used to detect SCN in different anions and even in very little concentration. Further, 1 can be employed to detect SCN even in real blood samples which makes this material a better cluster to detect the concentration of SCN in smokers and non-smokers. The mechanism of detection of SCN by 1 was further verified by HSAB principle, single crystal analysis, and DFT calculations. The transformation at the discrete molecular level highly depends upon the structure of the complex, its formation energy and bond energies of the sites to get transformed and other structural factors as evidenced by theoretical analysis of the present Co7 cluster 1. This is the first report of a molecular complex to sense thiocyanate forming a dimeric crystal as the ultimate product as evidenced by single crystallography. The symbiosis effect (HSAB principle) also plays a key role in controlling exchange of the coordinated ligand with the host thiocyanate. Hence, the present cluster material 1 in future could be useful as a biomarker for the detection of hazardous thiocyanate concentrations in the aqueous medium as well as in human blood samples.Conflicts of interest
There are no conflicts to declare.Acknowledgements
The authors acknowledge the financial assistance from DST FIST and UGC-DRS (SAP-II) Programs. M. S. thanks Prof. Cristopher E. Anson, Department of Chemistry, KIT, Germany, for his valuable suggestions regarding establishing the exact crystal structure of 1a.References
- M. G. Valdes and M. E. Dıaz-Garcıa, Determination of Thiocyanate within PhysiologicalFluids and Environmental Samples: Current Practice and Future Trends, Crit. Rev. Anal. Chem., 2004, 34, 9–23 CrossRef CAS.
- Y. Zhang, H. Wang and R. H. Yang, Colorimetric and Fluorescent Sensing of SCN− Based on meso-Tetraphenylporphyrin/meso-Tetraphenylporphyrin Cobalt(II) System, Sensors, 2007, 7, 410 CrossRef CAS.
- R. M. Naik, B. Kumar and A. Asthana, Kinetic spectrophotometric method for trace determination of thiocyanate based on its inhibitory effect, Spectrochim. Acta, Part A, 2010, 75, 1152–1158 CrossRef PubMed.
- Z. Glatz, S. Novakova and H. Sterbova, Analysis of thiocyanate in biological fluids by capillary zone electrophoresis, J. Chromatogr. A, 2001, 916, 273–277 CrossRef CAS PubMed.
- M. T. Ashby, A. C. Carlson and M. J. Scott, Redox Buffering of Hypochlorous Acid by Thiocyanate in Physiologic Fluids, J. Am. Chem. Soc., 2004, 126, 15976–15977 CrossRef CAS PubMed.
- S. E. Chemaly, M. Salathe, S. Baier, G. E. Conner and R. Forteza, Hydrogen Peroxide–Scavenging Properties of Normal Human Airway Secretions, Am. J. Respir. Crit. Care Med., 2003, 167, 425–430 CrossRef PubMed.
- A. Afkhami, F. Soltani-Felehgari and T. Madrakian, Highly sensitive and selective determination of thiocyanate using gold nanoparticles surface decorated multi-walled carbon nanotubes modified carbon paste electrode, Sens. Actuators, B, 2014, 196, 467–474 CrossRef CAS.
- M. Yu, H. Yu and R.-S. Li, Fast analysis of thiocyanate by ion-pair chromatography with direct conductivity detection on a monolithic column, Chin. Chem. Lett., 2013, 24, 1067–1069 CrossRef.
- I. Demkowska, Z. Polkowska and J. Namiesnik, Application of ion chromatography for the determination of inorganic ions, especially thiocyanates in human saliva samples as biomarkers of environmental tobacco smoke exposure, J. Chromatogr. B: Anal. Technol. Biomed. Life Sci., 2008, 875, 419–426 CrossRef CAS PubMed.
- Y. Tanaka, N. Naruishi, H. Fukuya, J. Sakata, K. Saito and S.-I. Wakida, Simultaneous determination of nitrite, nitrate, thiocyanate and uric acid in human saliva by capillary zone electrophoresis and its application to the study of daily variations, J. Chromatogr. A, 2004, 1051, 193–197 CrossRef CAS PubMed.
- H. Akiyama, T. Toida, S. Sakai, Y. Amakura, K. Kondo, Y. Sugita-Konishi and T. Maitani, Determination of cyanide and thiocyanate in sugihiratake mushroom using HPLC method with fluorometric detection, J. Health Sci., 2006, 52, 73–77 Search PubMed.
- T. Ohshima, S. Kagaya, M. Gemmei-Ide, R. W. Cattrall and S. D. Kolev, The use of a polymer inclusion membrane as a sorbent for online preconcentration in the flow injection determination of thiocyanate impurity in ammonium sulfate fertilizer, Talanta, 2014, 129, 560–564 CrossRef CAS PubMed.
- Y. Zhang, H. Wang and R. H. Yang, Colorimetric and fluorescent sensing of SCN− based on meso-tetraphenylporphyrin/meso-tetraphenylporphyrin cobalt(II) system, Sensors, 2007, 7, 410–419 CrossRef CAS.
- A. Banerjee, A. Sahana, S. Lohar, I. Hauli, S. K. Mukhopadhyay, D. A. Safin, M. G. Babashkinaet, M. Bolte, Y. Garcia and D. Das, A rhodamine derivative as a “lock” and SCN- as a “key”: visible light excitable SCN− sensing in living cells, Chem. Commun., 2013, 49, 2527–2529 RSC.
- J. Song, F.-Y. Wu, Y.-Q. Wan and L.-H. Ma, Ultrasensitive turn-on fluorescent detection of trace thiocyanate based on fluorescence resonance energy transfer, Talanta, 2015, 132, 619–624 CrossRef CAS PubMed.
- H.-H. Deng, C.-L. Wu, A.-L. Liu, G.-W. Li, W. Chen and X.-H. Lin, Colorimetric sensor for thiocyanate based on anti-aggregation of citrate-capped gold nanoparticles, Sens. Actuators, B, 2014, 191, 479–484 CrossRef CAS.
- J. Zhang, C. Yang, X. Wang and X. Yang, Colorimetric recognition and sensing of thiocyanate with a gold nanoparticle probe and its application to the determination of thiocyanate in human urine samples, Anal. Bioanal. Chem., 2012, 403, 1971–1981 CrossRef CAS PubMed.
- Z. Zhang, J. Zhang, C. Qu, D. Pan, Z. Chen and L. Chen, Label free colorimetric sensing of thiocyanate based on inducing aggregation of Tween 20-stabilized gold nanoparticles, Analyst, 2012, 137, 2682–2686 RSC.
- L. Wu, Z. Wang, S. Zong and Y. Cui, Rapid and reproducible analysis of thiocyanate in real human serum and saliva using a droplet SERS-microfluidic chip, Biosens. Bioelectron., 2014, 62, 13–18 CrossRef CAS PubMed.
- P. Pienpinijtham, X. X. Han, S. Ekgasit and Y. Ozaki, Highly sensitive and selective determination of iodide and thiocyanate concentrations using surface-enhanced Raman scattering of starch-reduced gold nanoparticles, Anal. Chem., 2011, 83, 3655–3662 CrossRef CAS PubMed.
- S. Narkowicz, E. Jaszczak, Z. Polkowska, B. Kiełbratowska, A. Kotłowska and J. Namiesnik, Determination of thiocyanate as a biomarker of tobacco smoke constituents in selected biological materials of human origin, Biomed. Chromatogr., 2018, 32, e4111 CrossRef PubMed.
- M. J. Frisch, et al., Gaussian 09, revision 02, Gaussian, Inc., Wallingford, CT, 2009 Search PubMed.
- A. Ansari, A. Kaushik and G. Rajaraman, Mechanistic Insights on the ortho-Hydroxylation of Aromatic Compounds by Non-heme Iron Complex: A Computational Case Study on the Comparative Oxidative Ability of Ferric-Hydroperoxo and High-Valent FeIV═O and FeV═O Intermediates, J. Am. Chem. Soc., 2013, 135, 4235–4249 CrossRef CAS PubMed.
- A. Ansari, P. Jayapal and G. Rajaraman, Angew. Chem., Int. Ed., 2014, 53, 1–6 CrossRef.
- A. Ansari, M. Ansari, A. Singha and G. Rajaraman, Interplay of Electronic Cooperativity and Exchange Coupling in Regulating the Reactivity of Diiron(IV)-oxo Complexes towards C−H and O−H Bond Activation, Chem.–Eur. J., 2017, 23, 10110–10125 CrossRef CAS PubMed.
- S. J. Grimme, Semiempirical GGA-Type Density Functional Constructed with a Long-Range Dispersion Correction, Comput. Chem., 2006, 27, 1787–1799 CrossRef CAS PubMed.
- A. D. Becke, J. Chem. Phys., 1993, 98, 5648–5652 CrossRef CAS.
- C. Lee, W. Yang and R. G. Parr, Phys. Rev. B: Condens. Matter Mater. Phys., 1988, 37, 785–789 CrossRef CAS PubMed.
- T. H. Dunning Jr and P. J. Hay, in Modern Theoretical Chemistry, ed. H. F. Schaefer, Plenum, New York, 1976, vol. 3 Search PubMed.
- P. J. Hay and W. R. Wadt, Ab initio effective core potentials for molecular calculations. Potentials for the transition metal atoms Sc to Hg, J. Chem. Phys., 1985, 82(1), 270–283 CrossRef CAS.
- W. R. Wadt and P. J. Hay, Ab initio effective core potentials for molecular calculations. Potentials for main group elements Na to Bi, J. Chem. Phys., 1985, 82(1), 284–298 CrossRef CAS.
- W. R. Wadt and P. J. Hay, Ab initio effective core potentials for molecular calculations. Potentials for main group elements Na to Bi, J. Chem. Phys., 1985, 82(1), 284–298 CrossRef CAS.
- M. N. Ahamad, F. Sama, M. N. Akhtar, Y.-C. Chen, M.-L. Tong, M. Ahmad, M. Shahid, S. Hussain and K. Khan, A disc-like Co7 cluster with a solvent dependent catecholase activity, New J. Chem., 2017, 41, 14057–14061 RSC.
- J. A. Ibers and W. C. Hamilton, International Tables for Xray Crystallography, Kynoch Press, Birmingham, England, 1974, vol. 4 Search PubMed.
- SMART & SAINT Software Reference manuals, Version 6. 45, Bruker Analytical X-ray Systems, Inc, Madison, WI, 2003 Search PubMed.
- G. M. Sheldrick, SADABS, software for empirical absorption correction, Ver. 2.05, University of Göttingen, Göttingen, Germany, 2002 Search PubMed.
- XPREP, version 5.1, Siemens Industrial Automation Inc, Madison, WI, 1995 Search PubMed.
- (a) L. J. Bourhis, O. V. Dolomanov, R. J. Gildea, J. A. K. Howard and H. Puschmann, The anatomy of a comprehensive constrained, restrained refinement program for the modern computing environment - Olex2 dissected, Acta Crystallogr., Sect. A: Found. Adv., 2015, 71, 59–75 CrossRef CAS PubMed; (b) O. V. Dolomanov, L. J. Bourhis, R. J. Gildea, J. A. K. Howard and H. Puschmann, J. Appl. Crystallogr., 2009, 42, 339 CrossRef CAS.
- M. C. Burla, R. Caliandro, M. Camalli, B. Carrozzini, G. L. Cascarano, L. De Caro, C. Giacovazzo, G. Polidori, D. Siliqi and R. Spagna, IL MILIONE: a suite of computer programs for crystal structure solution of proteins, J. Appl. Crystallogr., 2007, 40, 609–613 CrossRef CAS.
- M. Ashafaq, M. Khalid, M. Raizada, A. Ali, M. Faizan, M. Shahid and R. J. Butcher, Crystal Engineering and Magnetostructural Properties of Newly Designed Azide/Acetate-Bridged Mn12 Coordination Polymers, Cryst. Growth Des., 2019, 19(4), 2366–2379 CrossRef CAS.
- M. Ashafaq, M. Raizada, M. Khalid, M. Shahid, M. Ahmad and Z. A. Siddiqi, Structural characterization, magnetic studies, and catecholase-like activities of Mn12 clusters, J. Coord. Chem., 2018, 71(14), 2118–2145 CrossRef CAS.
- M. S. Khan, M. Khalid and M. Shahid, Engineered Fe3 triangle for the rapid and selective removal of aromatic cationic pollutants: complexity is not a necessity, RSC Adv., 2021, 11(5), 2630–2642 RSC.
- M. S. Khan, M. Khalid and M. Shahid, A Co(II) coordination polymer derived from pentaerythritol as an efficient photocatalyst for the degradation of organic dyes, Polyhedron, 2021, 196, 114984 CrossRef.
- I. Mantasha, M. Shahid, H. A. Saleh, K. M. Qasem and M. Ahmad, A novel sustainable metal organic framework as the ultimate aqueous phase sensor for natural hazards: detection of nitrobenzene and F− at the ppb level and rapid and selective adsorption of methylene blue, CrystEngComm, 2020, 22(22), 3891–3909 RSC.
- D. Roy, K. Majhi, M. K. Mondal, S. K. Saha, S. Sinha and P. Chowdhury, Silicon quantum dot-based fluorescent probe: synthesis characterization and recognition of thiocyanate in human blood, ACS Omega, 2018, 3(7), 7613–7620 CrossRef CAS PubMed.
- (a) K. Iman, M. Shahid and M. Ahmad, A novel self-assembled Na {Cu12Zn4} multifunctional material: first report of a discrete coordination compound for detection of Ca2+ ions and selective adsorption of cationic dyes in water, Dalton Trans., 2020, 49(11), 3423–3433 RSC; (b) M. J. Frisch, et al., Gaussian 09, revision 02, Gaussian, Inc., Wallingford, CT, 2009 Search PubMed.
- A. Ansari, A. Kaushik and G. C.-H. Rajaraman, Bond Activation by Metal-Superoxo Species: What Drives High Reactivity, Angew. Chem., Int. Ed., 2015, 54, 564–568 CAS.
- S. Grimme, Semiempirical GGA-Type Density Functional Constructed with a Long-Range Dispersion Correction, J. Comput. Chem., 2006, 27, 1787–1799 CrossRef CAS PubMed.
- A. D. Becke, Density-Functional Thermochemistry. III. The Role of Exact Exchange, J. Chem. Phys., 1993, 98, 5648–5652 CrossRef CAS.
- C. Lee, W. Yang and R. G. Parr, Development of the Colle-Salvetti Correlation-Energy Formula into a Functional of the Electron Density, Phys. Rev. B: Condens. Matter Mater. Phys., 1988, 37, 785–789 CrossRef CAS PubMed.
- T. H. Dunning Jr and P. J. Hay, in Modern Theoretical Chemistry, ed. H. F. Schaefer, Plenum, New York, 1976, vol. 3 Search PubMed.
- P. J. Hay and W. R. Wadt, Ab Initio Effective Core Potentials for Molecular Calculations. Potentials for the Transition Metal Atoms Sc to Hg, J. Chem. Phys., 1985, 82, 270–283 CrossRef CAS.
- W. R. Wadt and P. J. Hay, Ab Initio Effective Core Potentials for Molecular Calculations. Potentials for Main Group Elements Na To Bi, J. Chem. Phys., 1985, 82, 284–298 CrossRef CAS.
Footnotes |
| † Electronic supplementary information (ESI) available. CCDC 2005498–2005500. For ESI and crystallographic data in CIF or other electronic format see DOI: 10.1039/d1ra01749g |
| ‡ These authors contributed equally. |
| This journal is © The Royal Society of Chemistry 2021 |

