 Open Access Article
High efficiency solar desalination and dye retention of plasmonic/reduced graphene oxide based copper oxide nanocomposites
Doaa A. Kospa,
Awad I. Ahmed ,
Salem E. Samra and
Amr Awad Ibrahim
 *
*
Department of Chemistry, Faculty of Science, Mansoura University, Al-Mansoura 35516, Egypt. E-mail: amr_awad@mans.edu.eg
First published on 22nd April 2021
Abstract
Water desalination via solar-driven interfacial evaporation is one of the most essential technologies to limit the problem of global freshwater scarcity. Searching for a highly efficient, stable, eco-friendly, and cost-effective solar-absorber material that can collect the full solar spectrum is critically important for solar steam generation. This study reports the development of a new solar thermal evaporation system based on plasmonic copper oxide/reduced graphene oxide (rGO). The silver nanoparticles in the composite exhibit a very strong solar absorption. Also, rGO and CuO nanoparticles offer excellent thermal absorptivity. Polyurethane was used as the support and as a thermal insulator. Moreover, filter paper was used for fast water delivery to the surface of the solar absorber. Ag/CuO-rGO nanocomposite is manifested to be one of the most efficient solar-absorbers reported to date for solar desalination which exhibits an average 2.6 kg m−2 h−1 evaporation rate with solar thermal efficiency up to 92.5% under 1 sun irradiation. Furthermore, the composite has excellent stability and durability as it displays stable evaporation rates for more than 10 repeated cycles in use, with no significant decrease in the activity. Besides, the successful removal of various organic dyes from contaminated water is also revealed, resulting in the production of clean condensed freshwater. Finally, this work commences a new avenue of synthesizing cost-effective thermal absorbers based on metal oxides.
Introduction
Freshwater scarcity and energy shortage have become two of the most fundamental global challenges. Although water covers three-quarters of the Earth's surface, 97.5% is undrinkable saline water including seawater, wastewater, and brackish water.1–3 Freshwater lack all over the world is due to population growth, environmental pollution, agricultural activities, industrial expansion, and abuse of water usage.4,5 Currently, several seawater desalination technologies exist, including multiple-effect distillation, electro-dialysis, multi-stage flash distillation, capacitive deionization, reverse osmosis, and desalination batteries.6–9 These dominant strategies require electrical energy more than 0.4% of the worldwide electricity generation capacity.10 Innovative desalination strategies that would minimize energy use and costs are in persistent need, such as the solar evaporation technique that uses free and abundant solar energy to produce fresh water from brackish water, seawater, and contaminated water.2,11Solar energy is the most abundant renewable natural resource available and can be used in several processes as photocatalysis,12,13 photovoltaics,14 and solar steam generation.15,16 The solar steam generation (SSG) technique will have various applications in industry and power plants to reduce the production cost.17 Typically, the interfacial evaporation system consists of a bilayer configuration, in which the bottom supporting layer is used to pump water to the top layer to incessantly replenish the water missing as well as reduce heat loss, and the top layer is a photothermal material used to promote the sunlight absorbability and improve the efficiency of solar thermal conversion.18
Photothermal materials used in the SSG system can efficiently collect solar light and convert it to thermal energy to heat the water at the interface in place of directly heating bulk water to lower heat loss and enhance the efficiency of light-to-vapor conversion.19,20 The absorption of broadband light and the high wettability of the photothermal layer are the key issues required for high-efficiency solar desalination. Additionally, the feasibility of scaling up and cost-effectiveness are unavoidable for real-world applications. The currently employed photothermal materials for solar desalination are metals with surface plasmon resonance (SPR) absorption which show over 95% absorption of sunlight. Plasmonic metals have been demonstrated for efficiently heating water to temperatures above the boiling point of water.21–23 Most recently, metal nanoparticles, especially gold,24 silver,25 alumina,16 and other nanoparticles26 have been proposed for steam water generation under solar irradiation. However, the complicated fabrication process, high cost, and potential safety issues have been hindering high-volume production, which limits their possible practical applications.26 Eying to solve the high-cost problem that plasmonic metals-based evaporators have, other solar absorbers are sought with SPR as well as with some transition metal semiconducting materials.27
In addition to plasmonic metal nanoparticles, nanostructured carbon-based materials as graphene oxide (GO), reduced graphene oxide (rGO), and single-wall carbon nanotubes, have recently been used in photothermal energy conversion due to their ability to absorb light over the visible part of the electromagnetic spectrum and convert this light into heat with excellent photothermal transduction properties.28–30 Graphene-based photo absorber materials have attracted remarkable interest in solar desalination because of facile fabrication, well-controlled microstructures, and efficient light absorption.31 For example, Shi et al. synthesized rGO-based porous as a photoabsorber material and reported a water evaporation rate corresponding to 1.31 kg m−2 h−1 under 1 sun illumination.31 The photothermal effects by plasmonic metal-graphene nanocomposites as graphene oxide nanosheets-based copper, gold, or silver nanoparticles have also been reported.32,33 Moreover, it has been revealed that the GO interface improves photothermal effect of the plasmonic nanoparticles which increases the water temperature to above 105 °C with direct sunlight without any focusing mirrors or lenses.34 These results suggest that the plasmonic-graphene oxide nanocomposites are the best photothermal absorbers used in photothermal water distillation systems.
Distinct from metal materials, metal oxide type of semiconductors with a narrow bandgap between the valence and conduction bands have opened up new ways for the absorbance of solar energy.35 By tuning the composition, size, and structure of the semiconductors, the position of the VB and CB can be adjusted, thus modulating the energy band-gap and light absorption capability.36 These materials absorb the light to generate electron–hole pairs and the solar light with higher energy than its band-gap would create above-bandgap electron–hole pairs, which would then relax to the band edges and convert the extra energy into heat.37 Recently, some semiconductor metal oxides with narrow bandgap as MoO3 quantum dots, hydrogenated black TiO2, and Ti2O3 nanoparticles have also been reported as photothermal materials for solar desalination.18,38 Although these materials, have a high solar energy conversion efficiency, however, its large-scale application is limited by inflexibility, poor stability, low yield, and high cost.18 Among metal oxide semiconductors, copper oxide (CuO) is a p-type semiconductor with a narrow bandgap of 1.2 eV and high optical absorption coefficient so it is considered as one of the promising selective solar absorbers.39
Herein, we report the preparation of a low-cost semiconductor, nanostructured copper oxide (CuO), as one of the viable solar absorbers due to its high solar absorptance, low thermal emittance, and facile and cost-effective synthesis at low temperature.40 To achieve a high evaporation rate, we demonstrate solar thermal collector nanocomposite, plasmonic reduced graphene oxide-based copper oxide (Ag/CuO-rGO). RGO exhibits a broad light absorption and a large superficial area, which provide a favorable distribution profile for CuO and Ag NPs.41 Moreover, the abundant pores of CuO can confine the light in the composite and Ag NPs enhanced the solar absorbitivy.42 In this study, we fabricated a floating solar steam generation device involving a bottom thermal insulation stand (polyurethane foam, PU), and a top photothermal composite sprayed onto the filter paper substrate by a simple method. The brine was transferred to the surface through the stand wicks and the filter paper channels. Therefore, salt can precipitate on the filter paper then rapidly dissolved by continual water supply, which is the reason for the stable rate of evaporation. The experimental results display that the flexible Ag/CuO-rGO photothermal paper has potential applications in seawater desalination. These materials also have several advantages as excellent stability, high solar evaporation efficiency, long-time durability, and successful elimination of organic dyes from contaminated wastewater through the solar desalination of wastewater.
Experimental
Materials and chemicals
Graphite powder (99.99%), copper acetate (Cu(OAc)2·H2O), sodium hydroxide (NaOH), hydrogen peroxide (H2O2, 30% aqueous solution), and hydrochloric acid (HCl) were purchased from Alfa-Aeser Co. sulphuric acid (H2SO4, 98%), sodium nitrate (NaNO3), silver nitrate (AgNO3), ethanol (C2H5OH), L-ascorbic acid (L-AA) and ammonium hydroxide (NH4OH, 25%) are supplied from Sigma-Aldrich chemicals. All chemicals were used without any further purification.Synthesis of graphene oxide (GO)
Graphene oxide was synthesized from graphite flakes via modified Hummer's method;42 sodium nitrate (2.5 g) was added to 115 mL of concentrated H2SO4 and stirred for 30 min in ice-cold water. Graphite powder (5 g) was added to the reaction mixture and stirred for 2 h at (0–5 °C), and then 15 g of KMnO4 was slowly added to the reaction mixture. The mixture was continuously stirred for 2 h and then removed from the ice bath and stirred at 30 °C till the formation of a brownish paste. A 300 mL of hot water was added and completed to 1 L with cold deionized water. Finally, the reaction was terminated by the addition of 20 mL of H2O2. Then the obtained precipitate was centrifuged and washed with HCl (8%) followed by DI water for multiple times then filtered, dried at 60 °C, and grind in fine powder form.Synthesis of 20 wt% CuO-rGO nanocomposite
Typically, 500 mg of GO in 20 mL of ethanol was ultrasonically dispersed for 1 h. Then the dispersion was mixed with 0.125 g of Cu(OAc)2·H2O and magnetically stirred for 30 min at room temperature. An equivalent amount of NaOH solution was prepared in 20 mL ethanol and then added to drop wisely into the reaction mixture. After sonication at room temperature for 10 min, the solution was heated at 80 °C for 2 h till the formation of brownish-black suspension. The as-synthesized product was isolated by centrifugation, washed three times with ethanol and DI water, and finally dried in a vacuum oven at 70 °C for 12 h. CuO nanoparticles were also prepared by the same method without adding GO.Synthesis of plasmonic CuO-rGO nanocomposite
2% Ag/CuO-rGO nanocomposite was prepared through simultaneous reduction of AgNO3 using L-ascorbic acid as a green reducing agent. 100 mg CuO-rGO was ultrasonically dispersed in 20 mL deionized water for 30 min, then the pH of the suspension was adjusted to 10 by NH4OH. The desired amount of AgNO3 solution was slowly added to the dispersion and stirred at 80 °C in a water bath for 10 min. Next, L-AA solution was added at a concentration that maintained the weight ratio between AgNO3 and L-AA fixed at 2.07. Finally, the mixture was held at 80 °C for 30 min and was then centrifuged, washed, and dried under vacuum at 70 °C for 10 h.Material characterization
The as-synthesized samples were characterized by several analysis techniques. FT-IR analysis was performed using a MATTSON FT-IR-5000S spectrophotometer (4 cm−1 resolution and 32 scans) with diamond attenuated total reflectance (DATR). Light absorbance of the prepared materials was measured using a double beam UV-vis spectrophotometer (AE-S90-2D) over the spectral range 190–700 nm. X-ray diffraction patterns (XRD) of samples were tested at high angle 2θ from 4 to 70 using a Bruker device with Cu-Kα radiation (λ = 1.5418 Å) under the following conditions; step size of 0.02, 40 kV, 30 mA, and scan step time of 0.80 seconds. The morphology of nanoparticles was examined by transition electron microscopy (TEM, Joel JEM-2100). An infrared radiation (IR) camera (htti-xintai) and thermocouple were used respectively to measure the temperature of the thermal absorbers during the desalination process. The inductively coupled plasma-optical emission spectrometry (ICP-OES), and UV-vis spectrophotometer were used to determine the concentration of metal ions and the dyes in solution before and after desalination tests, respectively.Synthesis of the photoabsorber materials on the air-laid paper
The schematic of the photo absorber preparation is shown in Scheme 1. Firstly, 50 mg of the prepared samples GO, CuO, CuO-rGO, Ag-rGO, and Ag/CuO-rGO respectively were separately added in 10 mL deionized water, and the mixture was ultrasonically dispersed for 30 min. Subsequently, the aqueous suspension of each photo absorber was poured into the filter paper (6 cm diameter) and the paper was dried at 90 °C for 15 min. Then, the paper was thermally treated under vacuum at 150 °C for 2 h to obtain the photothermal paper.The bottom part of the solar steam generation system was made of piece commercial polyurethane foam (low thermal conductivity) with drilled holes. The holes were filled with the hydrophilic substrate as cotton for water supply. Then the top photothermal absorber membrane was directly placed on the bottom stand.
Evaporation performance under one sun
A xenon lamp (300 watt) with AM 1.5 G filter was used as a simulated sunlight source and the illumination power of Xe lamp was adjusted to 1 sun = 1 kW m−2. The steam generation experiment was performed under an ambient temperature of 22 °C ± 3 °C and a humidity of 50% for 60 min. The solar steam generation device was floated in a 250 mL beaker with 200 mL DI water or saline water. The water weight loss in real-time through evaporation was monitored using an electronic analytical balance (1 mg inaccuracy) every 5 minutes. The temperature distribution of all vapor generators before and after illumination was recorded by an IR-camera and thermocouple, respectively.The evaporation rate (ν) can be calculated using eqn (1):18
 | (1) |
The energy efficiency (η) can be calculated using eqn (2):18,43
 | (2) |
Artificial seawater and wastewater preparation
The artificial seawater sample was prepared to determine the utility of the prepared materials in the solar desalination of seawater. The artificial sample was prepared by the dissolving of NaCl (1 g), MgSO4·7H2O (1.5 g), and CaCl2 (1 g) in 1 L of deionized water. Also, contaminated wastewater was prepared from 10 ppm of rhodamine B (RhB), methylene blue (MB) and a mix of RhB and MB dyes, respectively. The steam generation test was performed in a closed chamber under 1 sun illumination, and the condensed water was collected to measure the concentration of ions after desalination.Solar steam generation recycling test
The stability and sustainability of the Ag/CuO-rGO nanocomposite were tested using six solar absorbers. The samples were irradiated with a light density of 1 kW m−2 under the solar simulator system for each cycle (1 sun). The weight loss of water and the temperature of the steam were measured after 60 minutes. The wetted photothermal membrane was cleaned, cooled, and reused for the next cycle after each cycle.Result and discussion
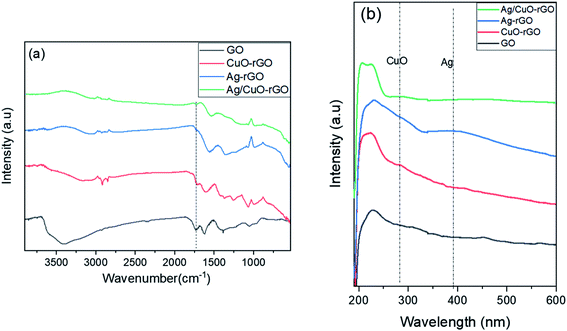
The FTIR spectra of GO, CuO-rGO, Ag-rGO, and Ag/CuO-rGO nanohybrids ranging from 4000 to 500 cm−1 are displayed in Fig. 1a. The FT-IR spectrum of GO shows several bands indicating the vibrational modes of different oxygen-containing functional groups. As can be seen from GO spectrum, the adsorption broadband at 3600 to 3000 cm−1 is associated with the intermolecular H-bonding of structural OH groups, which disappeared in the nanocomposites spectra. Also, the absorption peaks at 1728 cm−1 and 1627 cm−1 are assigned to the C![[double bond, length as m-dash]](https://www.rsc.org/images/entities/char_e001.gif) O group stretching vibrations found in COOH groups situated at the GO edges.44,45 For nanocomposites, a decrease in intensity and small shift of the carbonyl and hydroxyl peaks at 1627 cm−1 and 3400 cm−1, respectively are observed which reflected the intercalation of CuO and AgNPs on the GO surface as well as the reduction of GO sheet.45 For the spectrum of CuO-GO composite, the adsorption peak at 626 cm−1 is attributed to the stretching vibrations of CuO bond.46 From spectra of the composite materials, characteristic peaks of all components can be observed. Thus, the FT-IR measurement confirms the anchoring of Ag and CuO nanoparticles on the GO surface.
O group stretching vibrations found in COOH groups situated at the GO edges.44,45 For nanocomposites, a decrease in intensity and small shift of the carbonyl and hydroxyl peaks at 1627 cm−1 and 3400 cm−1, respectively are observed which reflected the intercalation of CuO and AgNPs on the GO surface as well as the reduction of GO sheet.45 For the spectrum of CuO-GO composite, the adsorption peak at 626 cm−1 is attributed to the stretching vibrations of CuO bond.46 From spectra of the composite materials, characteristic peaks of all components can be observed. Thus, the FT-IR measurement confirms the anchoring of Ag and CuO nanoparticles on the GO surface.
The optical properties of the as-synthesized composites have been studied by the UV-vis absorption spectra as shown in Fig. 1b. The peak at 230 nm in GO spectrum is the characteristic peaks of π–π excitation of C–C bonds in the aromatic ring, and n–π transition of carboxylic moieties (–C![[double bond, length as m-dash]](https://www.rsc.org/images/entities/char_e001.gif) O) in GO sheet.46 For UV-vis spectrum of CuO-rGO nanocomposites, it is observed that the peak in GO spectrum at 230 nm is shifted to 256 nm due to the reduction GO sheet and the characteristic peak of CuO nanoparticles appeared at 375 nm.46,47 Also, the characteristics peak of AgNPs appeared at 400 nm in the spectrum of Ag-rGO and Ag/CuO-rGO nanocomposites which confirms the presence of AgNPs on GO surface.48
O) in GO sheet.46 For UV-vis spectrum of CuO-rGO nanocomposites, it is observed that the peak in GO spectrum at 230 nm is shifted to 256 nm due to the reduction GO sheet and the characteristic peak of CuO nanoparticles appeared at 375 nm.46,47 Also, the characteristics peak of AgNPs appeared at 400 nm in the spectrum of Ag-rGO and Ag/CuO-rGO nanocomposites which confirms the presence of AgNPs on GO surface.48
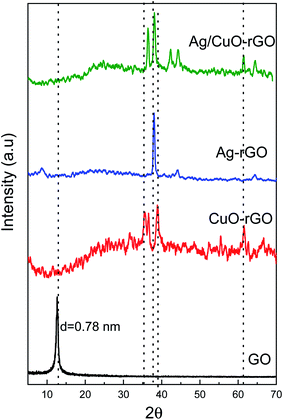
The structures and phase composition of all prepared samples were examined by using XRD measurements and the corresponding pattern is shown in Fig. 2. For GO nanoparticles, the XRD patterns exhibit a strong diffraction peak at 2θ = 11° and a small peak at 2θ = 20.93° that corresponds to (001) and (002) planes, respectively and the d-spacing of GO is 0.78 nm.48 For CuO-rGO and Ag/CuO-rGO nanocomposites, the diffraction peaks observed at 2θ values of 33, 35, 38, 48.7, 53.5, 58.3, 61.7, and 67.9 correspond to (110), (111), (200), (202), (020), (021), (113), and (220) planes, respectively which are characteristic peaks of the monoclinic structure of CuO.47 Additionally for Ag-rGO and Ag/CuO-rGO nanocomposites, the XRD shows two peaks at 2θ = 38.3°, 44.2° correspond to the (111), (200) planes, respectively which are characteristic of the face-centered cubic structure of AgNPs.48 Also Fig. 2 shows that the intensity of (001) reflection peak of layered GO almost decreased and slightly shifted toward lower 2θ value confirming the intercalation of AgNPs and CuO within GO sheets.48
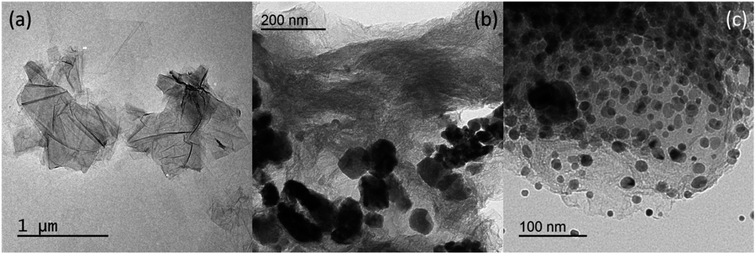
The morphological structure of the GO, CuO-rGO, and Ag/CuO-rGO nanocomposites were approved using TEM analysis as shown in Fig. 3. Fig. 3a shows a typical TEM image of GO which exhibited a wrinkled sheet-like structure with a clean surface a size of 20–100 nm confirming the GO formation.49 TEM image of CuO-rGO (Fig. 3b) confirms the uniform dispersion of spherical CuO NPs on the graphene oxide surface with the size ranging from 20–50 nm.50 For Ag/GO-rGO nanocomposite, the micrographs (Fig. 3c) confirm the successful decoration of GO with a uniform CuO and spherical AgNPs dispersion with small particle size distribution ranging from 10–15 nm.49 These results well agreed with XRD results which proposed that AgNPs and CuO are successfully intercalated on the surface of GO with small particle size distribution.
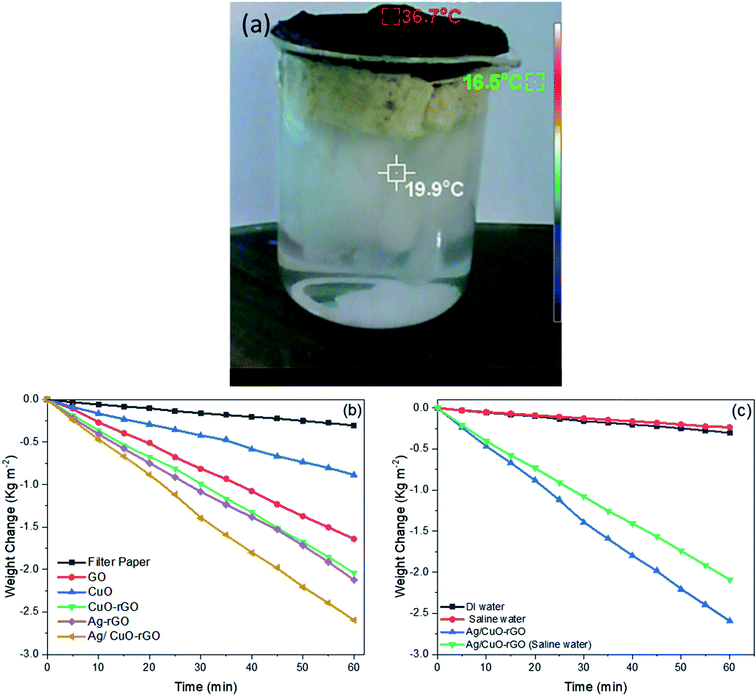
To estimate the steam generation performance for different prepared photothermal absorbers, five thermal absorber membranes with a diameter of 6 cm were prepared as follows: GO, CuO, CuO-rGO, Ag-rGO and Ag/CuO-rGO. Fig. 4a displays the optical image of the solar evaporator which was made of GO composites-filter paper membrane, polyurethane foam, cotton strips and a glass container. The solar steam generation performance of all samples was applied and compared with pure filter paper under solar elimination of 1 sun over 60 minutes using xenon lamp and AM 1.5 G filter. Each sample was fixed on the top of a circular piece of polyurethane foam with 6 cm inner diameter to make the membrane float on the water surface and prevent the lack of solar heat in the bulk water due to its low thermal conductivity.34 The foam contained drilled holes that were filled with the hydrophilic substrate as cotton for water supply. Then the foam was kept at the top surface of 250 mL DI water in the beaker and the loss of weight was measured by an electronic balance. Water was transferred from the bulk water to the surface by the capillary action of cellulose substrate. Then the rate of evaporation was calculated from the mass changes recorded at the corresponding time intervals (5 min) up to 60 min.
The mass changes and the evaporation rates from the steam generation test of the pure water (filter paper) and the five photothermal absorbers are displayed in Fig. 4b. The results showed that the pure filter paper exhibits the lowest mass change and evaporation rate of 0.30 kg m−2 h−1 under 1 sun illumination among all membranes. This is due to the low thermal absorptivity of filter paper and PU foam. The evaporation rates of (GO, CuO, CuO-rGO, Ag-rGO and Ag/CuO-rGO) absorbers are 1.64, 0.80, 2.04, 2.13 and 2.59 kg m−2 h−1, respectively which indicate that the incorporation of the GO with semiconductor metal oxide and plasmonic nanoparticles enhance the evaporation performance due to the broad light absorption band of these materials. The solar absorbers containing GO increase the evaporation rates for several reasons as the low thermal conductivity which repressing the thermal dissipation, the porous structure which provides an efficient path for water supply and vapor flow and the ability to attach to cellulose, so that the water transferred within the cellulose by capillary force can be efficiently transferred to GO.28 Owing to the high solar absorbance of CuO semiconductor,40 the evaporation rates increase in the solar steam generation of CuO-rGO and Ag/CuO-rGO membranes. Also, anchoring AgNPs on the absorber surface significantly enhances the evaporation rates compared to the other absorbers due to their efficient plasmonic behavior in the visible light region. After screening the synthesized composites, the results showed that the Ag/CuO-rGO sample is the most effective composite with high evaporation rate of 2.59 kg m −2 h−1 which is about 8 and 1.5 times of filter paper and GO samples, respectively due to the combination of GO, CuO and AgNPs photothermal properties.
Besides, the solar steam generation was investigated in the artificial saline water for Ag/CuO-rGO evaporator. Fig. 4c displays that the evaporation rate in saline water (10% NaCl) is lower than the DI water due to the presence of salt ions.
After solar illumination for 60 min, the temperature change at the surface of pure water and different absorbers was recorded using IR-camera and thermocouple, respectively. Fig. 5 displays a comparison of the surface temperature of different absorbers relative to pure water. The figure shows that the temperature on the top surface of (GO, CuO, CuO-rGO, Ag-rGO and Ag/CuO-rGO) solar-absorbers rapidly increased from room temperature to around 32, 29.2, 34.8, 40.2 and 48.9 °C, respectively. The temperature at the surface of Ag/CuO-rGO composite is the highest temperature which can increase from 25.0 °C to 48.5 °C in 60 min indicating that it provided the highest rate of water evaporation. We ascribed this to the synergistic effects of a hydrophilic surface property, excellent solar absorption, and the mesoporous structure of Ag/CuO-rGO composite. Meanwhile, the filter paper can only reach 19.8 °C as it stands on thermal insulation (polyurethane).
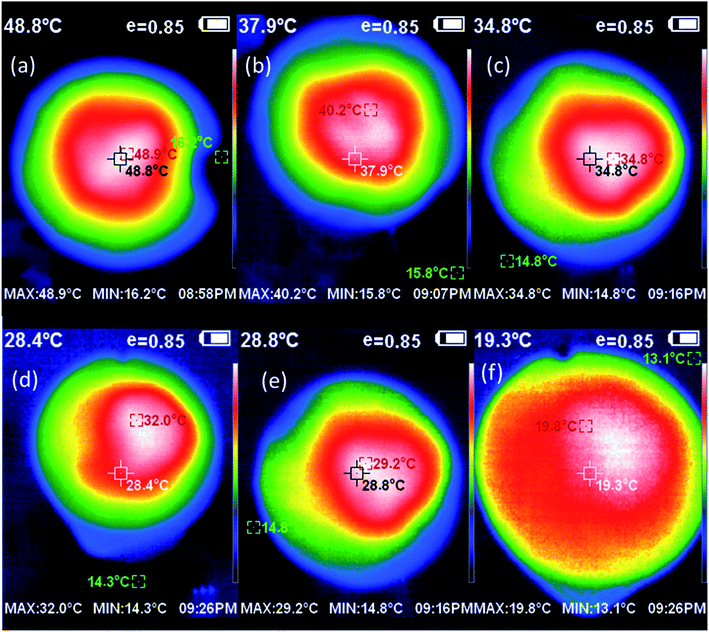 | ||
| Fig. 5 IR thermal images of (a) Ag/CuO-rGO, (b) Ag/rGO, (c) CuO-rGO, (d) GO, (e) CuO, and (f) filter paper after 60 min under 1 sun illumination. | ||
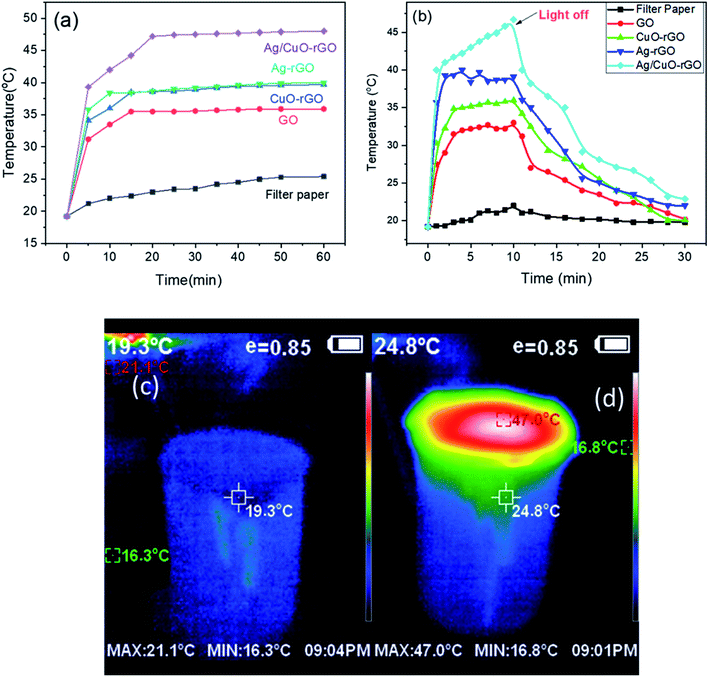
According to the temperature–time curve, Fig. 6a, the temperatures of the surface of the absorber under 1 sun illumination reach a steady-state at about 15 min. Additionally, Fig. 6b displays the temperature at the surface of the absorbers after solar illumination for 10 min and the curve shows that the composites are slowly losing heat due to the low thermal conductivity of GO. These results indicate that the absorbed energy is stored in the composites and consumed in the evaporation process and the heat is not lost in the air.28 The digital IR-camera images of Ag/CuO-rGO before and after 1 sun illumination displayed in Fig. 6(c and d).
Fig. 6c shows the sample before the illumination which exhibits an average 19 °C for both the bulk water and the surface of the sample. While Fig. 6d shows a large difference in the temperature between the top and bottom of the system demonstrates that the insulating polyurethane effectively localizes the heat at the solar-absorber surface and thus reduces the heat loss into the bulk water.
Fig. 7a displays a comparison between the evaporation efficiencies of the different solar-absorbers at solar intensity 1 sun which is calculated from eqn (2). These results reveal that the Ag/CuO-rGO composite has 92% thermal efficiency for the solar desalination performance under 1 sun which is considered as one of the highest values reported for materials used for a solar steam generation as proved by the data displayed in Table 1. Moreover, the evaporation rate in the saline water with different concentrations of NaCl slightly changes, which indicates that the Ag/CuO-rGO composite still preserves the freshwater production capacity even in saline water as shown in Fig. 7b.
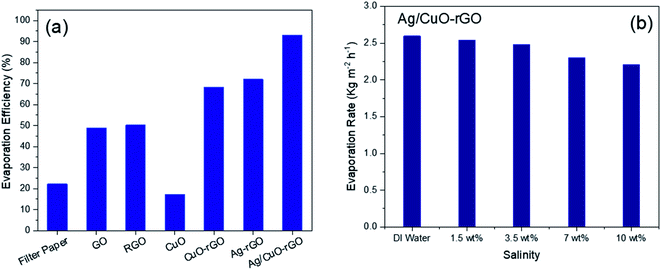 | ||
| Fig. 7 (a) The evaporation efficiency of different absorbers (b) evaporation rate of Ag/CuO-rGO for different water salinity under 1 sun illumination for 60 min. | ||
| Evaporator | Support | Solar intensity (kW cm−2) | Evaporation rate (kg m−2 h−1) | Efficiency (%) | Reference |
|---|---|---|---|---|---|
| GO leaf | — | 0.825 | 1.92 | 78.0 | 51 |
| Au-rGO | Wood | 1 | 1.39 | 90.1 | 41 |
| rGO | PU | 1 | 1.31 | 83 | 52 |
| Graphene | Ni foam | 1 | 1.40 | 91.4 | 53 |
| 3D graphene material | — | 1 | 2.60 | 87.0 | 26 |
| Fe2O3-rGO | 1 | 1.12 | 70.0 | 29 | |
| Ag/Au-GO | PU | 1 | 1.00 | 63.0 | 34 |
| Plasmonic TiO2 | — | 1 | 1.5 | 70 | 1 |
| Co3O4–CuO | Quartz glass fibrous (QGF) filter membrane | 1 | 1.19 | 75 | 54 |
| Plasmonic metals | Wood | 1 | — | 90.4 | 55 |
| Ag/CuO-GO | PU | 1 | 2.49 | 92.2 | This work |
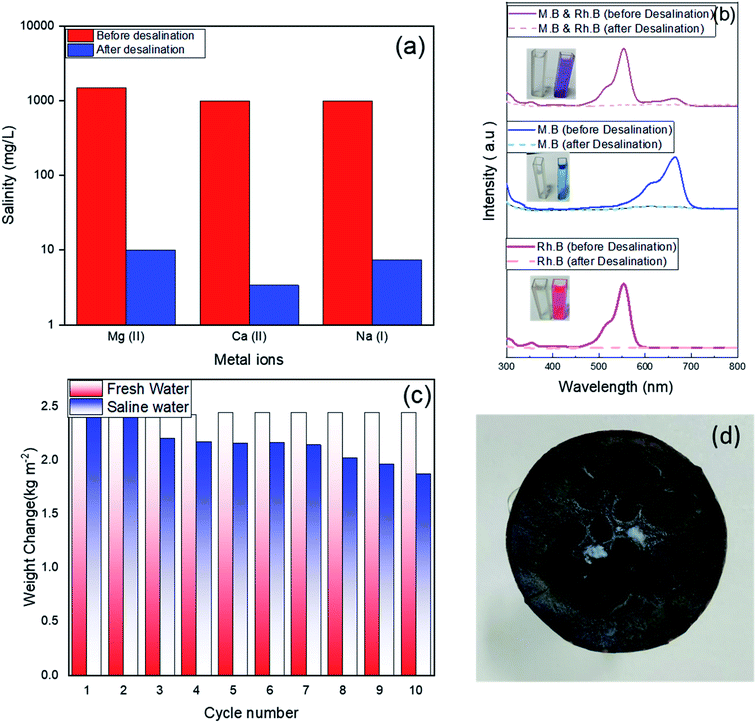
To further evaluate the quality of the evaporated water from desalination of the artificial seawater, the evaporated water was collected using a condensing unit and the concentrations of Mg2+, Ca2+, Na+, and ions are determined using ICP-OES. Fig. 8a displays that there is a significant decrease in the concentration of the three ions after the solar desalination of the artificial seawater using the Ag/CuO-rGO absorber. The concentrations considerably decreased from the original values of 1500, 1000, and 1000 mg L−1 to 10, 3.4, and 7.2 mg L−1, respectively which are well below the values attained by common desalination techniques as well as below the standard values set by World Health Organization (WHO) and Environmental Protection Agency (EPA) for drinking water.35 These results demonstrate the potential of Ag/CuO-rGO composite has prominent desalination performance. Fig. 8b shows the high efficiency of Ag/CuO-rGO sample in the solar treatment of contaminated wastewater containing 10 ppm of different dyes as RhB, MB and a mixture of both. The absorption spectra of the contaminated wastewater before and after the solar evaporation confirm the complete removal of the dyes from the produced water.
Moreover, to test the reusability of Ag/CuO-rGO composite in solar desalination of seawater, ten cycles of evaporation tests were applied in the artificial seawater under 1 sun illumination (60 min illumination for each cycle). Fig. 8c shows that the efficiencies did not tend to decrease by cycles for freshwater, but there is a small decrease in the efficiencies for saline water. The decrease in the efficiencies for saline water is due to the precipitated salt on the surface of the absorber, which could block the incident light and affect the evaporation of the water. As shown in Fig. 8d, an amount of precipitated salt emerged on the surface of the evaporator (Ag/CuO-GO) after continuous functioning for 1 h under 1 sun illumination in 20 wt% saline. This layer of precipitated salts would cause a small decrease in the evaporation performance of the solar generator.
Conclusions
In summary, we improved a new photothermal absorber based on plasmonic graphene oxide-metal oxide nanocomposite for efficient solar steam generation. The Ag/CuO-rGO membrane can be a desirable and viable material for efficient solar seawater desalination and wastewater treatment due to the characteristics properties of low thermal conductivity, high optical absorption, effective water transmission, and stability. Moreover, the material exhibits a high evaporation rate and energy efficiency of 2.59 kg m−2 h−1 and 92.5%, respectively under one solar illumination. In this study, we used inexpensive and facile methods of material synthesis leads to produce an economically material at a large scale compared to other desalination devices as membrane-based filters and reverse osmosis. Besides, we also found that the composite has excellent durability as it can be applied over more than 10 repeated cycles with no significant decrease in the performance efficiency. And the successful elimination of organic pollutants from contaminated water can effectively result in the production of clean condensed freshwater.Conflicts of interest
There are no conflicts to declare.References
- D. Wu, C. Zhao, Y. Xu, X. Zhang, L. Yang, Y. Zhang, Z. Gao and Y.-Y. Song, ACS Appl. Nano Mater., 2020, 3, 10895–10904 CrossRef CAS.
- K. Kim, S. Yu, C. An, S.-W. Kim and J.-H. Jang, ACS Appl. Mater. Interfaces, 2018, 10, 15602–15608 CrossRef CAS PubMed.
- L. Chen, H. Wang, S. Kuravi, K. Kota, Y. H. Park and P. Xu, Desalination, 2020, 483, 114412 CrossRef CAS.
- Q. Gan, T. Zhang, R. Chen, X. Wang and M. Ye, ACS Sustainable Chem. Eng., 2019, 7, 3925–3932 CrossRef CAS.
- L. Song, P. Mu, L. Geng, Q. Wang and J. Li, ACS Sustainable Chem. Eng., 2020, 8, 11845–11852 CrossRef CAS.
- K. Ramalingam, M. Liang, N. L. W. Pyae, S. H. Aung, T. Z. Oo, P. Srimuk, J. Ma, V. Presser, F. Chen and T. D. Waite, ACS Appl. Mater. Interfaces, 2020, 12, 32788–32796 CrossRef CAS PubMed.
- M. E. Suss and V. Presser, Joule, 2018, 2, 10–15 CrossRef.
- J. R. Werber, C. O. Osuji and M. Elimelech, Nat. Rev. Mater., 2016, 1, 16018 CrossRef CAS.
- P. Srimuk, X. Su, J. Yoon, D. Aurbach and V. Presser, Nat. Rev. Mater., 2020, 5, 517–538 CrossRef CAS.
- Q. Zhu, K. Ye, W. Zhu, W. Xu, C. Zou, L. Song, E. Sharman, L. Wang, S. Jin, G. Zhang, Y. Luo and J. Jiang, J. Phys. Chem. Lett., 2020, 11, 2502–2509 CrossRef CAS PubMed.
- M. Gao, P. K. N. Connor and G. W. Ho, Energy Environ. Sci., 2016, 9, 3151–3160 RSC.
- Y. Lu, Y. Yang, T. Zhang, Z. Ge, H. Chang, P. Xiao, Y. Xie, L. Hua, Q. Li, H. Li, B. Ma, N. Guan, Y. Ma and Y. Chen, ACS Nano, 2016, 10, 10507–10515 CrossRef CAS PubMed.
- Z. Zou, J. Ye, K. Sayama and H. Arakawa, Nature, 2001, 414, 625–627 CrossRef CAS PubMed.
- G. Yu, J. Gao, J. C. Hummelen, F. Wudl and A. J. Heeger, Science, 1995, 270, 1789–1791 CrossRef CAS.
- G. Ni, G. Li, S. V. Boriskina, H. Li, W. Yang, T. Zhang and G. Chen, Nat. Energy, 2016, 1, 16126 CrossRef CAS.
- L. Zhou, Y. Tan, J. Wang, W. Xu, Y. Yuan, W. Cai, S. Zhu and J. Zhu, Nat. Photonics, 2016, 10, 393–398 CrossRef CAS.
- S. Behera, C. Kim and K. Kim, Langmuir, 2020, 36, 12494–12503 CrossRef CAS PubMed.
- C. Shen, Y. Zhu, X. Xiao, X. Xu, X. Chen and G. Xu, ACS Appl. Mater. Interfaces, 2020, 12, 35142–35151 CrossRef CAS PubMed.
- R. Chen, Z. Wu, T. Zhang, T. Yu and M. Ye, RSC Adv., 2017, 7, 19849–19855 RSC.
- X. Huang, Y.-H. Yu, O. L. de Llergo, S. M. Marquez and Z. Cheng, RSC Adv., 2017, 7, 9495–9499 RSC.
- A. O. Govorov and H. H. Richardson, Nano Today, 2007, 2, 30–38 CrossRef.
- A. Polman, ACS Nano, 2013, 7, 15–18 CrossRef CAS PubMed.
- Z. Fang, Y.-R. Zhen, O. Neumann, A. Polman, F. J. García de Abajo, P. Nordlander and N. J. Halas, Nano Lett., 2013, 13, 1736–1742 CrossRef CAS PubMed.
- K. Bae, G. Kang, S. K. Cho, W. Park, K. Kim and W. J. Padilla, Nat. Commun., 2015, 6, 10103 CrossRef CAS PubMed.
- J. Chen, J. Feng, Z. Li, P. Xu, X. Wang, W. Yin, M. Wang, X. Ge and Y. Yin, Nano Lett., 2019, 19, 400–407 CrossRef CAS PubMed.
- Y. Yang, R. Zhao, T. Zhang, K. Zhao, P. Xiao, Y. Ma, P. M. Ajayan, G. Shi and Y. Chen, ACS Nano, 2018, 12, 829–835 CrossRef CAS PubMed.
- S. Cao, Q. Jiang, X. Wu, D. Ghim, H. Gholami Derami, P.-I. Chou, Y.-S. Jun and S. Singamaneni, J. Mater. Chem. A, 2019, 7, 24092–24123 RSC.
- X. Li, W. Xu, M. Tang, L. Zhou, B. Zhu, S. Zhu and J. Zhu, Proc. Natl. Acad. Sci. U.S.A., 2016, 113, 13953–13958 CrossRef CAS PubMed.
- X. Wang, G. Ou, N. Wang and H. Wu, ACS Appl. Mater. Interfaces, 2016, 8, 9194–9199 CrossRef CAS PubMed.
- X. Hu, W. Xu, L. Zhou, Y. Tan, Y. Wang, S. Zhu and J. Zhu, Adv. Mater., 2017, 29, 1604031–1604035 CrossRef PubMed.
- A. Mnoyan, M. Choi, D. H. Kim, B.-J. Ku, H. Kim, K. J. Lee, A. S. Yasin, S. Nam and K. Lee, RSC Adv., 2020, 10, 42432–42440 RSC.
- D.-K. Lim, A. Barhoumi, R. G. Wylie, G. Reznor, R. S. Langer and D. S. Kohane, Nano Lett., 2013, 13, 4075–4079 CrossRef CAS PubMed.
- H. S. Rady, A. N. Emam, M. B. Mohamed and M. S. El-Shall, Chem. Phys. Lett., 2017, 690, 153–158 CrossRef CAS.
- F. S. Awad, H. D. Kiriarachchi, K. M. AbouZeid, Ü. Özgür and M. S. El-Shall, ACS Appl. Energy Mater., 2018, 1, 976–985 CrossRef CAS.
- X. Wu, G. Y. Chen, G. Owens, D. Chu and H. Xu, Mater. Today Energy, 2019, 12, 277–296 CrossRef.
- H. Tong, S. Ouyang, Y. Bi, N. Umezawa, M. Oshikiri and J. Ye, Adv. Mater., 2012, 24, 229–251 CrossRef CAS PubMed.
- P. Wang, Environ. Sci.: Nano, 2018, 5, 1078–1089 RSC.
- D. Ding, W. Huang, C. Song, M. Yan, C. Guo and S. Liu, Chem. Commun., 2017, 53, 6744–6747 RSC.
- G. G. Welegergs, R. Akoba, J. Sacky and Z. Y. Nuru, Mater. Today: Proc., 2021, 36, 509–513 CAS.
- S. Karthick Kumar, S. Suresh, S. Murugesan and S. P. Raj, Sol. Energy, 2013, 94, 299–304 CrossRef CAS.
- Q. Zhang, L. Li, B. Jiang, H. Zhang, N. He, S. Yang, D. Tang and Y. Song, ACS Appl. Mater. Interfaces, 2020, 12, 28179–28187 CrossRef CAS PubMed.
- X. Han, L. Zang, S. Zhang, T. Dou, L. Li, J. Yang, L. Sun, Y. Zhang and C. Wang, RSC Adv., 2020, 10, 2507–2512 RSC.
- L. Zhao, C. Du, C. Zhou, S. Sun, Y. Jia, J. Yuan, G. Song, X. Zhou, Q. Zhao and S. Yang, ACS Sustainable Chem. Eng., 2020, 8, 4362–4370 CrossRef CAS.
- J. Guerrero-Contreras and F. Caballero-Briones, Mater. Chem. Phys., 2015, 153, 209–220 CrossRef CAS.
- T. Lv, L. Pan, X. Liu, T. Lu, G. Zhu and Z. Sun, J. Alloys Compd., 2011, 509, 10086–10091 CrossRef CAS.
- Y. N. Singhbabu, K. K. Sahu, D. Dadhich, A. K. Pramanick, T. Mishra and R. K. Sahu, J. Mater. Chem. C, 2013, 1, 958–966 RSC.
- A. Kaur, S. Mann, B. Goyal, B. Pal and D. Goyal, RSC Adv., 2016, 6, 102733–102743 RSC.
- M. Cobos, I. De-La-Pinta, G. Quindós, M. J. Fernández and M. D. Fernández, Nanomaterials, 2020, 10, 376–398 CrossRef CAS PubMed.
- A. C. M. de Moraes, B. A. Lima, A. F. de Faria, M. Brocchi and O. L. Alves, Int. J. Nanomed., 2015, 10, 6847–6861 CrossRef PubMed.
- S. P. Lonkar, V. V. Pillai, S. Stephen, A. Abdala and V. Mittal, Nano-Micro Lett., 2016, 8, 312–319 CrossRef PubMed.
- C. Finnerty, L. Zhang, D. L. Sedlak, K. L. Nelson and B. Mi, Environ. Sci. Technol., 2017, 51, 11701–11709 CrossRef CAS PubMed.
- L. Shi, Y. Wang, L. Zhang and P. Wang, J. Mater. Chem. A, 2017, 5, 16212–16219 RSC.
- H. Ren, M. Tang, B. Guan, K. Wang, J. Yang, F. Wang, M. Wang, J. Shan, Z. Chen, D. Wei, H. Peng and Z. Liu, Adv. Mater., 2017, 29, 1702590–1702596 CrossRef PubMed.
- Y. Shi, R. Li, Y. Jin, S. Zhuo, L. Shi, J. Chang, S. Hong, K.-C. Ng and P. Wang, Joule, 2018, 2, 1171–1186 CrossRef CAS.
- M. Wang, P. Wang, J. Zhang, C. Li and Y. Jin, ChemSusChem, 2019, 12, 467–472 CrossRef CAS PubMed.
| This journal is © The Royal Society of Chemistry 2021 |


