 Open Access Article
Creative Commons Attribution 3.0 Unported Licence
Enhanced PEMFC durability with graphitized carbon black cathode catalyst supports under accelerated stress testing
Qiong Xue,
Jian-biao Huang,
Dai-jun Yang *,
Bing Li
 and
Cun-man Zhang
Clean Energy Automotive Engineering Center, School of Automotive Studies, Tongji University, Shanghai, 201804, China. E-mail: yangdaijun@tongji.edu.cn
First published on 28th May 2021
Abstract
The anti-corrosion properties of the carbon substrates of cathode catalysts play a vital role in the commercialization of fuel cell vehicles. Our report reveals the enhanced durability of graphitized carbon black catalyst substrates in polymer electrolyte membrane fuel cells (PEMFCs), tested under simulated start-stop cycling and high potential holding conditions. Graphitized carbon treated at various temperatures is used as the support for Pt catalysts. The catalyst utilizing graphitized carbon treated at 1800 °C demonstrates superior antioxidation properties and the inhibition of Pt particle coarsening. The decay ratio of the potential at 1000 mA cm−2 has been reduced from 34.9% (commercial Pt/C) to 0.5% during high potential holding accelerated stress testing. Correspondingly, the growth of Pt particles is reduced from 0.95 nm (commercial Pt/C) to 0.08 nm; that is, the coalescence of Pt particles is effectively alleviated upon using graphitized carbon black.
1. Introduction
Polymer electrolyte membrane fuel cells (PEMFCs) are regarded as a promising, clean power source for automobiles due to their high efficiency, high output power density, low operation temperature, and near-zero emissions.1–5 Recently, Pt and Pt-based ultrasmall particles supported on carbon matrices have shown state-of-the-art performance toward the oxygen reduction reaction (ORR).6–8 However, durability is still one of the major obstacles preventing the commercialization of PEMFCs.9–12 There are numerous studies on the degradation of cathode catalysts; in these, Pt particle dissolution and agglomeration, and carbon support corrosion are considered the main reasons for this degradation.13–17 Thus, the stability and anti-corrosion properties of carbon supports for cathode catalysts play a vital role in the commercialization of PEMFCs.For automobile applications, the local cathode potential can reach as high as 1.5 V during starting and stopping due to the H2/air frontier, which accelerates the oxidization of the carbon support and speeds up the degradation of the PEMFC.18,19 When carbon oxidation occurs, oxygen-containing functional groups are generated on the surface of the carbon support, weakening the interactions between the platinum particles and the carbon support. The platinum particles will migrate and agglomerate, finally detaching from the carbon support.20,21 The interfacial structure formed between the Pt nanoparticles and carbon support changes because of the functional groups generated on the carbon surface.22,23 The electrons in Pt nanoparticles near the oxygen functional groups can be transferred to the electronegative oxygen atoms, increasing the oxidation state of Pt; this can trigger the easy dissolution of Pt nanoparticles and accelerate the Ostwald ripening process.24,25 Meanwhile, the conductivity of the carbon support decreases; as a result, the impedance of the fuel cell increases.20 In addition, the carbon support will become hydrophilic, which can have an impact on gas permeability as well as water management. Therefore, high constant potential or potential cycling tests are usually conducted as protocols to investigate the effects of carbon support corrosion on PEMFC performance. Protocols proposed by the US Fuel Cell Council (USFCC),19 US Department of Energy (DOE),26 and the Fuel Cell Commercialization Conference of Japan (FCCJ)27–29 are widely used as standard protocols. Potential undulation during the start-stop protocol can be simulated via potential cycling to accelerate the degradation of the catalyst support within a short period of time.30,31
To address the above-mentioned stability issues affecting carbon carriers, a lot of effort has been made to improve the inherent properties of ORR catalysts; in these studies, substitution and surface modification and coating are mainly employed.32,33 Jung et al. employed graphitized carbon black and a N-doped graphitic carbon matrix as supports to increase corrosion resistance and to introduce N-modified active sites onto the carbon surface.34,35 Chen developed nitrogen/metal co-doped graphene tubes as substrates for stable ORR catalysts.36 Highly graphitized carbon materials, such as carbon nanofibers and carbon nanotubes, have been employed due to their unique corrosion resistance properties. However, the chemically inert planes of carbon nanotubes lead to low Pt nanoparticle dispersibility, large crystallite/particle sizes, and ease of agglomeration, resulting in the rapid and massive loss of the electrochemically active surface area (ECSA).37,38 It has been observed that the agglomeration of Pt nanoparticles mainly occurs at the junctions and edges of graphited carbon particles, based on electron tomography.39 Therefore, determining the degree of graphitization of the carbon support appears to require an optimum balance between uniform metal-particle dispersion and sufficient carbon corrosion resistance in order to meet the requirements of the various operating conditions of automotive PEMFCs, especially operation conditions that cause high potentials.
In this work, the degree of graphitization of the carbon support was adjusted, and the resulting materials were used to synthesize platinum-based catalysts. The durability of single cells with the prepared catalysts located at the cathode was examined using accelerated stress test (AST) protocols, including under potential-cycling simulated start-stop and high potential holding conditions. The structural changes in the carbon supports and Pt nanoparticles were monitored via transmission electron microscopy (TEM).
2. Experiments and methods
2.1. Carbon black graphitization
The degree of graphitization of carbon black (Ketjenblack EC-600JD, Akzo Nobel N.V) was increased via heat treatment under N2 protection (>99.99%, Air Chemical Co., Ltd). KetjenBlack EC-600JD was thoroughly premixed with Ni(NO3)2 (Sinopharm Chemical Reagent Co., Ltd) before heat treatment to promote the graphitization reaction of carbon black and reduce the temperature required for graphitization. The details are as follows. Appropriate amounts of EC-600JD and Ni(NO3)2, based on a C![[thin space (1/6-em)]](https://www.rsc.org/images/entities/char_2009.gif) :
:![[thin space (1/6-em)]](https://www.rsc.org/images/entities/char_2009.gif) Ni mass ratio of 20
Ni mass ratio of 20![[thin space (1/6-em)]](https://www.rsc.org/images/entities/char_2009.gif) :
:![[thin space (1/6-em)]](https://www.rsc.org/images/entities/char_2009.gif) 1, were evenly dispersed in ultrapure water (18.2 MΩ cm at 25 °C) via ultrasonic vibration. The well-mixed suspension was transferred to a rotary evaporator (Shanghai Dongxi Refrigeration Equipment Co., Ltd) and subjected to treatment at 100 °C to obtain dried powder. The powder was then heat-treated for 3 h at a predetermined temperature (1600 °C or 1800 °C) at a heating rate of 20 °C min−1 in a vacuum furnace (Shanghai Chen Hua Technology Co., Ltd) under a N2 atmosphere. Finally, the heat-treated powder was washed, filtered, dried, and labeled as EC-G1600 or EC-G1800, depending on the treatment temperature.
1, were evenly dispersed in ultrapure water (18.2 MΩ cm at 25 °C) via ultrasonic vibration. The well-mixed suspension was transferred to a rotary evaporator (Shanghai Dongxi Refrigeration Equipment Co., Ltd) and subjected to treatment at 100 °C to obtain dried powder. The powder was then heat-treated for 3 h at a predetermined temperature (1600 °C or 1800 °C) at a heating rate of 20 °C min−1 in a vacuum furnace (Shanghai Chen Hua Technology Co., Ltd) under a N2 atmosphere. Finally, the heat-treated powder was washed, filtered, dried, and labeled as EC-G1600 or EC-G1800, depending on the treatment temperature.
2.2. Catalyst synthesis
The catalysts supported on the as-prepared graphitized carbon black samples, i.e., Pt/EC-x (where x is G1600 or G1800), were synthesized via the one-pot ethylene glycol (Sinopharm Chemical Reagent Co., Ltd) reduction of the Pt precursor H2PtCl6·6H2O (Sinopharm Chemical Reagent Co., Ltd). The pH value of the ethylene glycol solution was adjusted to 12 with NaOH (Sinopharm Chemical Reagent Co., Ltd) before being heated to 130 °C under a N2 atmosphere and maintained for 3 h. After cooling to room temperature, the obtained solid was filtered with abundant ultrapure water and dried in a vacuum oven for 12 h. For comparison, Pt supported on raw carbon black (EC-600JD) was prepared using the same method and labelled as Pt/EC. Commercial Pt/C (60 wt% Pt, Johnson Matthey) was used as received and labelled as Pt/C-JM.2.3. Physical characterization
TEM analysis (JEM-2100F, Nippon Electronics Co., Ltd) was conducted at 200 kV to observe the fresh Pt/C catalysts and aged Pt/C catalysts that underwent durability testing. Raman spectroscopy (LabRAM HR Evolution, HORIBA Scientific) analysis was carried out with radiation from an argon laser (514 nm) to examine the structures of the raw and graphitized carbon black samples. Specific surface area and porosity measurements using all carbon black samples were performed with a volumetric device (ASAP 2000, Micromeritics). X-ray diffraction (XRD, D8 ADVANCE, Bruker AXS) was used with Cu Kα radiation to examine the as-prepared Pt-based catalysts.2.4. Electrochemical tests
Electrochemical tests were carried out with a CHI660D potentiostat (CH Instruments). A glassy carbon rotating disk (diameter: 5.6 mm; area: 0.246 cm2) coated with the corresponding catalyst was used as the working electrode. A reversible hydrogen electrode (RHE) and Pt wire were used as the reference and counter electrodes, respectively.Homogeneous catalyst ink was prepared as follows. 2 mg of the studied catalyst was dispersed in 1 mL of a mixed solvent containing isopropanol (Sinopharm Chemical Reagent Co., Ltd) and an ionomer (Nafion, 5 wt%, DuPont) (the mass ratio was 30![[thin space (1/6-em)]](https://www.rsc.org/images/entities/char_2009.gif) :
:![[thin space (1/6-em)]](https://www.rsc.org/images/entities/char_2009.gif) 1), and this was sonicated for 30 min. 10 μL of ink was transferred onto the rotating disk. The cyclic voltammetry (CV) technique was used to determine the electrochemically active surface area (ECSA) via integrating the hydrogen desorption charge from CV at a rate of 100 mV s−1 in N2-saturated 0.1 M HClO4 solution. The formula is as follows: ECSA = Q/(m × k), where Q is the integral charge of the H desorption peak after removing the baseline of the double-layer area, m is the mass of Pt loaded on the working electrode, and k is equal to a constant of 0.21 mC cm−2, which represents the average amount of charge for removing a single layer of H atoms from a pure Pt surface. The current was normalized to the Pt amount to get the mass activity.
1), and this was sonicated for 30 min. 10 μL of ink was transferred onto the rotating disk. The cyclic voltammetry (CV) technique was used to determine the electrochemically active surface area (ECSA) via integrating the hydrogen desorption charge from CV at a rate of 100 mV s−1 in N2-saturated 0.1 M HClO4 solution. The formula is as follows: ECSA = Q/(m × k), where Q is the integral charge of the H desorption peak after removing the baseline of the double-layer area, m is the mass of Pt loaded on the working electrode, and k is equal to a constant of 0.21 mC cm−2, which represents the average amount of charge for removing a single layer of H atoms from a pure Pt surface. The current was normalized to the Pt amount to get the mass activity.
2.5. Single-cell tests
Single-cell tests were conducted using a fuel cell test bench (G20, Greenlight Innovation). Membrane electrode assemblies (MEAs) were prepared via spraying catalyst ink onto Nafion® 212 membranes (DuPont) with the heating platform set at 80 °C, and then one piece of gas diffusion layer (SGL, 24BC) was physically placed on each side of the catalyst-coated membrane. The Pt loading of the cathode catalyst layer is 0.4 mgPt cm−2. The cathode catalyst ink was obtained via dispersing the studied catalyst into a mixed solvent made up of ultrapure water, isopropanol, and an ionomer dispersion (Nafion, 5 wt%, DuPont), and this was sonicated for 30 min. The ratio of catalyst to Nafion® ionomer was 3![[thin space (1/6-em)]](https://www.rsc.org/images/entities/char_2009.gif) :
:![[thin space (1/6-em)]](https://www.rsc.org/images/entities/char_2009.gif) 1. All anode catalyst layers were prepared using commercial Pt/C-JM with the same method as the cathode and with Pt loading of 0.2 mgPt cm−2. The active electrode area of the obtained single cell is 25 cm2.
1. All anode catalyst layers were prepared using commercial Pt/C-JM with the same method as the cathode and with Pt loading of 0.2 mgPt cm−2. The active electrode area of the obtained single cell is 25 cm2.
During the polarization curve testing of single cells, pure hydrogen and compressed air were supplied to the anode and cathode sides with stoichiometric ratios of 1.5 (anode) and 3.8 (cathode); a backpressure of 100 kPa and relative humidity (RH) of 80% were employed at both sides. The temperature of the cell was maintained at 80 °C using a water thermostat.
2.6. AST protocols
The carbon-corrosion effects and degradation behaviors of the catalysts were scrutinized via employing AST protocols. For electrochemical environment testing, triangle wave potential cycling between 1 and 1.5 V vs. RHE with a sweep rate of 500 mV s−1 was employed to simulate the high potential conditions a fuel cell stack may encounter.40,41 For single-cell testing, a square wave between 0.9 V and 1.3 V (vs. anode) with a frequency of 1 min per cycle was used to simulate the conditions experienced by a MEA during start-stop operations.30,31 The AST protocols are shown in Fig. 1. In addition, potentiostatic AST testing was performed via holding the cathode potential at 1.4 V for 30 min.42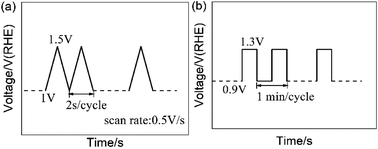 | ||
| Fig. 1 Accelerated stress test (AST) protocols: (a) the RDE test protocol and (b) the simulated start-stop protocol for single-cell testing. | ||
3. Results and discussion
3.1. Characterization of prepared carbon black and catalyst samples
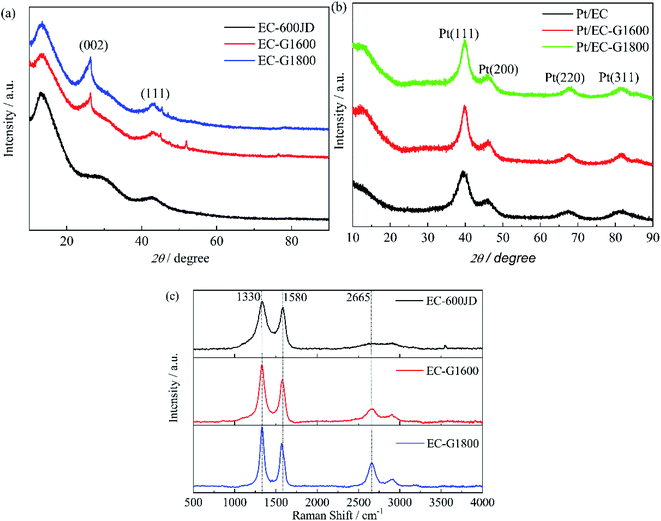
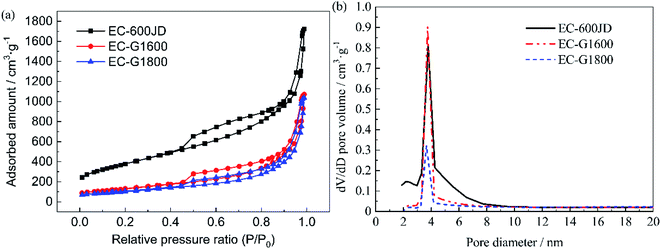
In stage (1), ID/IG increases according to the TK equation:46
3.2. RDE testing of the prepared catalysts
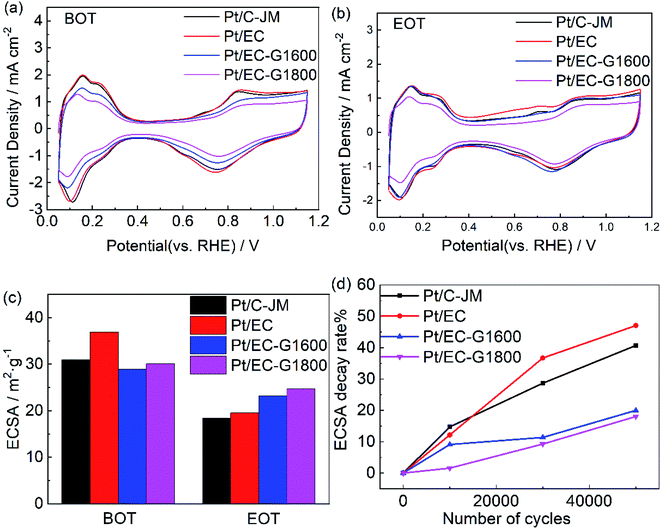
CV scans from the as-prepared catalysts obtained in N2-saturated 0.1 M HClO4 before and after 50![[thin space (1/6-em)]](https://www.rsc.org/images/entities/char_2009.gif) 000 cycles are shown in Fig. 4(a) and (b), respectively. The typical H adsorption/desorption peaks are exhibited between 0.05 and 0.35 V (vs. RHE) in the CV curves. The ECSAs of each sample before and after ASTs were calculated using the process outlined in the Experimental section, and the results are summarized in Fig. 4(c). The initial ECSAs of Pt/EG-G1600 and Pt/EG-G1800 are roughly similar to commercial Pt/C-JM, which indicates that they possess fairly close available active surface areas for catalysis. However, Pt/EG-G1800 retains the highest ECSA after 50
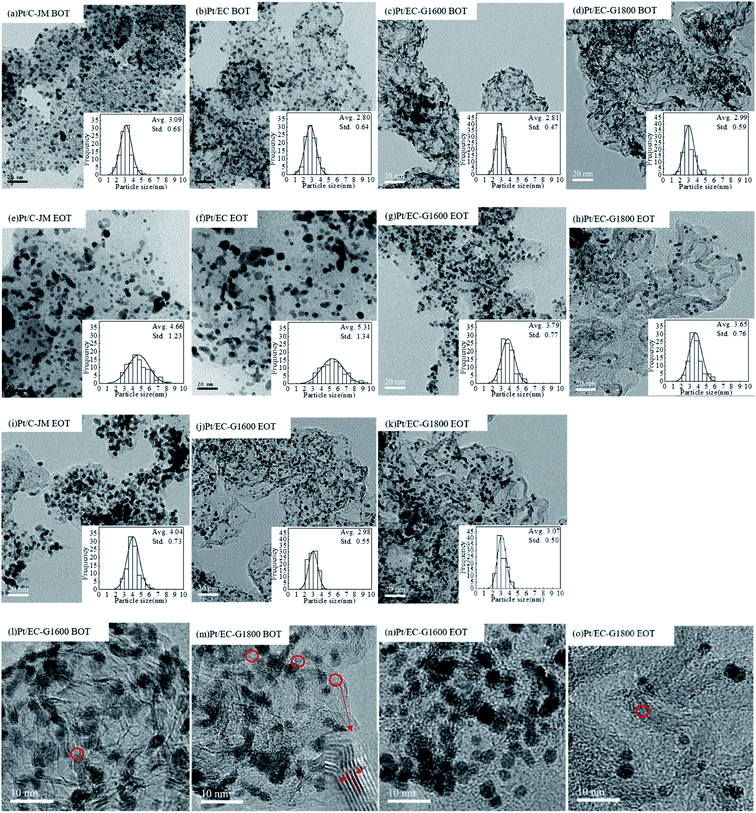
000 cycles are shown in Fig. 4(a) and (b), respectively. The typical H adsorption/desorption peaks are exhibited between 0.05 and 0.35 V (vs. RHE) in the CV curves. The ECSAs of each sample before and after ASTs were calculated using the process outlined in the Experimental section, and the results are summarized in Fig. 4(c). The initial ECSAs of Pt/EG-G1600 and Pt/EG-G1800 are roughly similar to commercial Pt/C-JM, which indicates that they possess fairly close available active surface areas for catalysis. However, Pt/EG-G1800 retains the highest ECSA after 50![[thin space (1/6-em)]](https://www.rsc.org/images/entities/char_2009.gif) 000 cycles of potential scanning. Pt/EC exhibits the highest initial ECSA due to the high surface area of EC and the superior dispersion of Pt nanoparticles on its surface, which could be confirmed from TEM images (Fig. 7). However, Pt/EC shows the fastest degradation among the samples, which results from the surface oxygen functionalization of the carbon support. The higher ECSA but worse stability is consistent with previous reports.25 The corresponding ECSA decay levels, normalized to the initial ECSAs, of the catalysts as a function of the number of cycles are given in Fig. 4(d). After 50
000 cycles of potential scanning. Pt/EC exhibits the highest initial ECSA due to the high surface area of EC and the superior dispersion of Pt nanoparticles on its surface, which could be confirmed from TEM images (Fig. 7). However, Pt/EC shows the fastest degradation among the samples, which results from the surface oxygen functionalization of the carbon support. The higher ECSA but worse stability is consistent with previous reports.25 The corresponding ECSA decay levels, normalized to the initial ECSAs, of the catalysts as a function of the number of cycles are given in Fig. 4(d). After 50![[thin space (1/6-em)]](https://www.rsc.org/images/entities/char_2009.gif) 000 cycles of stress, Pt/EC-G1800, Pt/EC-G1600, Pt/EG, and Pt/C-JM lost 18.0%, 20.0%, 47.0%, and 40.7% of their initial ECSAs, respectively. The decay rates of Pt/EC-G1600 and Pt/EC-G1800 are greatly reduced during the accelerated potential cycling. These degradation results show that graphitized carbon black supports can not only effectively inhibit the loss of the active area of catalyst nanoparticles but they can also improve the stability of Pt-based catalysts.
000 cycles of stress, Pt/EC-G1800, Pt/EC-G1600, Pt/EG, and Pt/C-JM lost 18.0%, 20.0%, 47.0%, and 40.7% of their initial ECSAs, respectively. The decay rates of Pt/EC-G1600 and Pt/EC-G1800 are greatly reduced during the accelerated potential cycling. These degradation results show that graphitized carbon black supports can not only effectively inhibit the loss of the active area of catalyst nanoparticles but they can also improve the stability of Pt-based catalysts.
3.3. Single-cell testing of the prepared MEAs
| RDE testing | After start/stop protocol stress | After holding at 1.4 V for 30 min | |||
|---|---|---|---|---|---|
| Decay ratio of the ECSA/% | Decay ratio of the current density at 0.6 V/% | Growth of Pt particles/nm | Decay ratio of the potential at 1000 mA cm−2/% | Growth of Pt particles/nm | |
| Pt/C-JM | 38.7 | 78.5 | 1.57 | 34.9 | 0.95 |
| Pt/EC | 36.3 | 87.1 | 2.51 | — | — |
| Pt/EC-G1600 | 19.0 | 74.6 | 0.98 | 5.63 | 0.17 |
| Pt/EC-G1800 | 18.2 | 53.1 | 0.66 | 0.50 | 0.08 |
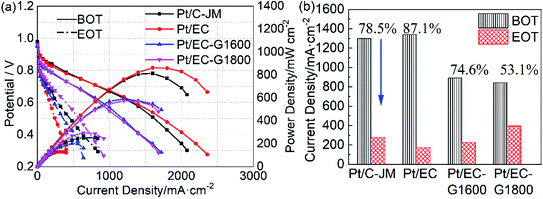
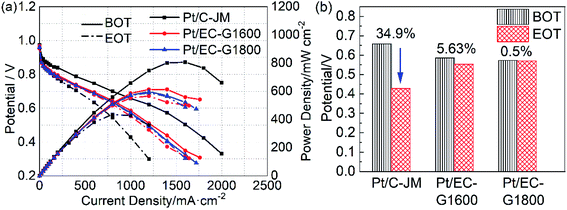
The high potential is at the root of the oxidation of carbon carriers. High potential operation tests were further conducted to evaluate the durability of the single cells. The polarization curves of the single cells before and after high-potential ASTs are provided in Fig. 6(a). Initially, the single-cell performances of the two catalysts with graphitized carbon supports were slightly lower than that of commercial Pt/C-JM. After high-potential ASTs, the performance of Pt/C-JM is much poorer than those of the as-prepared catalysts with graphitized carbon supports. The voltages corresponding to a current density of 1000 mA cm−2 and the decay rates are shown in Fig. 6(b). The decay rate of the Pt/C-JM single cell reached 34.9%, while the Pt/EC-G1800 fuel cell only declined by 0.50%, as listed in Table 1, indicating that the carbon carrier of the Pt/C-JM catalyst undergoes a large amount of oxidation at high potential, resulting in a sharp decline in performance. The carbon support of the Pt/EC-G1800 catalyst with a graphitized structure has improved oxidation resistance, so the catalyst can withstand corrosion at high potentials and the performance remains high.
Similar to the morphologies of the catalysts during start-stop ASTs, the platinum particles of Pt/C-JM were severely coarsened, but the platinum particles supported on graphitized carbon did not significantly grow or coarsen after the high-potential AST protocol, as shown in Fig. 7(i–k). The Pt particles of the Pt/C-JM, Pt/EC-G1600, and Pt/EC-G1800 catalysts grew by 0.95 nm, 0.17 nm, and 0.08 nm, respectively, as listed in Table 1. At a high potential of 1.4 V, no significant oxidation occurs on the graphitized carbon supports, which results in no degradation in performance, as shown in the polarization curves in Fig. 6. The carbon oxidation kinetics are sensitive to the structure and proceed more quickly in disordered domains.51 During the high potential stress test protocol, the degradation of commercial Pt/C-JM with an amorphous carbon support structure was observed to be more rapid. Compared to the Pt/EC-G1600 catalyst, the carbon support of the Pt/EC-G1800 catalyst has a finer graphite lattice, so the kinetic oxidation rate is the lowest.
4. Conclusions
The degradation of as-prepared catalysts with graphitized carbon supports was investigated using both simulated start-stop cycling and high-potential AST protocols. The Pt/EC-G1800 catalyst with the carbon support with the most complete graphite lattice was more resistant to electrochemical corrosion than catalysts with a defective graphite lattice support (Pt/EC-G1600) or structurally disordered carbon supports (Pt/EC and Pt/C-JM) during both stress testing protocols.During RDE testing, the Pt/EC-G1800 catalyst displayed the lowest amount of ECSA loss and the lowest attenuation rate, less than half of the decay rate of commercial Pt/C-JM (18.1% vs. 38.6%). According to the results following start-stop and high-potential AST protocols using single cells, the catalyst particles on the graphitized carbon supports underwent the smallest amounts of growth among all the samples. Meanwhile, the Pt/EC-G1800 catalyst maintained the maximum performance, with a decay rate of 0.50% compared to 34.9% for the Pt/C-JM catalyst, during high-potential ASTs. Moreover, the graphite lattice structure of its carbon support remained intact. During start-stop ASTs, the Pt particles of the Pt/EC-G1800 catalyst grew by 0.66 nm compared to 1.57 nm for commercial Pt/C-JM.
Therefore, using a graphitized carbon support can effectively improve the antioxidation capabilities, alleviating the coarsening and agglomeration of Pt nanoparticles. Graphitized carbon could act as a more stable catalyst support and offer an alternative solution under the demanding operating conditions faced by automotive PEMFCs.
Conflicts of interest
No potential competing interests are reported by the authors.Acknowledgements
This work is supported by the Program of the Ministry of Science & Technology of China [grant number 2018YFB0105303].References
- Y. B. Feng and Z. M. Dong, Appl. Energy, 2020, 270, 11 CrossRef.
- I. Staffell, D. Scamman, A. V. Abad, P. Balcombe, P. E. Dodds, P. Ekins, N. Shah and K. R. Ward, Energy Environ. Sci., 2019, 12, 463–491 RSC.
- T. Taner, Energy, 2018, 143, 284–294 CrossRef.
- M. V. Rocco, A. Casalegno and E. Colombo, Appl. Energy, 2018, 232, 583–597 CrossRef.
- M. H. Shao, Q. W. Chang, J. P. Dodelet and R. Chenitz, Chem. Rev., 2016, 116, 3594–3657 CrossRef CAS PubMed.
- F. J. Zhu, L. X. Luo, A. M. Wu, C. Wang, X. J. Cheng, S. Y. Shen, C. C. Ke, H. Yang and J. L. Zhang, ACS Appl. Mater. Interfaces, 2020, 12, 26076–26083 CrossRef CAS PubMed.
- D. J. S. Sandbeck, N. M. Secher, F. D. Speck, J. E. Sorensen, J. Kibsgaard, I. Chorkendorff and S. Cherevko, ACS Catal., 2020, 10, 6281–6290 CrossRef CAS.
- J. Wang, Q. Xue, B. Li, D. J. Yang, H. Lv, Q. F. Xiao, P. W. Ming, X. Z. Wei and C. M. Zhang, ACS Appl. Mater. Interfaces, 2020, 12, 7047–7056 CrossRef CAS PubMed.
- Z. P. Zhao, C. L. Chen, Z. Y. Liu, J. Huang, M. H. Wu, H. T. Liu, Y. J. Li and Y. Huang, Adv. Mater., 2019, 31, 1808115 CrossRef PubMed.
- Y. Nie, L. Li and Z. D. Wei, Chem. Soc. Rev., 2015, 44, 2168–2201 RSC.
- V. Colic and A. S. Bandarenka, ACS Catal., 2016, 6, 5378–5385 CrossRef CAS.
- Y. Luo and N. Alonso-Vante, Electrochim. Acta, 2015, 179, 108–118 CrossRef CAS.
- M. K. Debe, Nature, 2012, 486, 43–51 CrossRef CAS PubMed.
- Y. J. Wang, N. N. Zhao, B. Z. Fang, H. Li, X. T. T. Bi and H. J. Wang, Chem. Rev., 2015, 115, 3433–3467 CrossRef CAS PubMed.
- E. Fabbri, S. Taylor, A. Rabis, P. Levecque, O. Conrad, R. Kotz and T. J. Schmidt, ChemCatChem, 2014, 6, 1410–1418 CrossRef CAS.
- M. Nesselberger, S. Ashton, J. C. Meier, I. Katsounaros, K. J. J. Mayrhofer and M. Arenz, J. Am. Chem. Soc., 2011, 133, 17428–17433 CrossRef CAS PubMed.
- Y. Nonobe, IEEJ Trans. Electr. Electron. Eng., 2017, 12, 5–9 CrossRef CAS.
- J. Jang, M. Sharma, D. Choi, Y. S. Kang, Y. Kim, J. Min, H. Sung, N. Jung and S. J. Yoo, ACS Appl. Mater. Interfaces, 2019, 11, 27735–27742 CrossRef CAS PubMed.
- Y. Hashimasa, Y. Matsuda and T. Shimizu, Electrochim. Acta, 2015, 179, 119–125 CrossRef CAS.
- A. Kannan, A. Kabza and J. Scholta, J. Power Sources, 2015, 277, 312–316 CrossRef CAS.
- D. B. Wang, Z. Geng, C. M. Zhang, X. Y. Zhou and X. P. Liu, J. Energy Chem., 2014, 23, 601–608 CrossRef.
- S. Jayabal, G. Saranya, D. S. Geng, L. Y. Lin and X. B. Meng, J. Mater. Chem. A, 2020, 8, 9420–9446 RSC.
- Q. Xue, J. K. Li and Z. Y. Yang, Langmuir, 2017, 33, 872–880 CrossRef CAS PubMed.
- K. Singh, E. B. Tetteh, H. Y. Lee, T. H. Kang and J. S. Yu, ACS Catal., 2019, 9, 8622–8645 CrossRef CAS.
- J. H. Kim, J. Y. Cheon, T. J. Shin, J. Y. Park and S. H. Joo, Carbon, 2016, 101, 449–457 CrossRef CAS.
- https://www.energy.gov/sites/default/files/2017/11/f46/FCTT_Roadmap_Nov_2017_FINAL.pdf, 2017, accessed, November 2017.
- X. J. Zhao, A. Hayashi, Z. Noda, K. Kimijima, I. Yagi and K. Sasaki, Electrochim. Acta, 2013, 97, 33–41 CrossRef CAS.
- Y. C. Park, K. Kakinuma, M. Uchida, D. A. Tryk, T. Kamino, H. Uchida and M. Watanabe, Electrochim. Acta, 2013, 91, 195–207 CrossRef CAS.
- A. Zana, J. Speder, N. E. A. Reeler, T. Vosch and M. Arenz, Electrochim. Acta, 2013, 114, 455–461 CrossRef CAS.
- J. C. Meier, C. Galeano, I. Katsounaros, A. A. Topalov, A. Kostka, F. Schuth and K. J. J. Mayrhofer, ACS Catal., 2012, 2, 832–843 CrossRef CAS.
- E. N. Gribov, A. N. Kuznetsov, I. N. Voropaev, V. A. Golovin, P. A. Simonov, A. V. Romanenko and A. G. Okunev, Electrocatalysis, 2016, 7, 159–173 CrossRef CAS.
- T. Fujigaya, S. Hirata, M. R. Berber and N. Nakashima, ACS Appl. Mater. Interfaces, 2016, 8, 14494–14502 CrossRef CAS PubMed.
- M. D. Gimenez-Lopez, A. Kurtoglu, D. A. Walsh and A. N. Khlobystov, Adv. Mater., 2016, 28, 9103–9108 CrossRef PubMed.
- S. J. Won, J. Energy Chem., 2018, 27, 326–334 CrossRef.
- W. S. Jung and B. N. Popov, ACS Appl. Mater. Interfaces, 2017, 9, 23679–23686 CrossRef CAS PubMed.
- M. Chen, S. Hwang, J. Li, S. Karakalos, K. Chen, Y. He, S. Mukherjee, D. Su and G. Wu, Nanoscale, 2018, 10, 17318–17326 RSC.
- D. Kaewsai and M. Hunsom, Nanomaterials, 2018, 8, 299 CrossRef PubMed.
- X. J. Zhou, J. L. Qiao, L. Yang and J. J. Zhang, Adv. Energy Mater., 2014, 4, 1–25 Search PubMed.
- B. T. Sneed, D. A. Cullen, K. S. Reeves, O. E. Dyck, D. A. Langlois, R. Mukundan, R. L. Borup and K. L. More, ACS Appl. Mater. Interfaces, 2017, 9, 29839–29848 CrossRef CAS PubMed.
- S. W. Lee, S. R. Choi, J. Jang, G. G. Park, S. H. Yu and J. Y. Park, J. Mater. Chem. A, 2019, 7, 25056–25065 RSC.
- Y. Y. Shao, G. P. Yin, Y. Z. Gao and P. F. Shi, J. Electrochem. Soc., 2006, 153, A1093–A1097 CrossRef CAS.
- Y. J. Ko, H. S. Oh and H. Kim, J. Power Sources, 2010, 195, 2623–2627 CrossRef CAS.
- N. P. Wickramaratne, V. S. Perera, B. W. Park, M. Gao, G. W. McGimpsey, S. P. D. Huang and M. Jaroniec, Chem. Mater., 2013, 25, 2803–2811 CrossRef CAS.
- W. Kicinski, M. Norek and M. Bystrzejewski, J. Phys. Chem. Solids, 2013, 74, 101–109 CrossRef CAS.
- A. C. Ferrari and J. Robertson, Phys. Rev. B: Condens. Matter Mater. Phys., 2000, 61, 14095–14107 CrossRef CAS.
- F. Tuinstra and J. L. Koenig, J. Chem. Phys., 1970, 53, 1126–1130 CrossRef CAS.
- J. Rouquerol, D. Avnir, C. W. Fairbridge, D. H. Everett, J. H. Haynes, N. Pernicone, J. D. F. Ramsay, K. S. W. Sing and K. K. Unger, Pure Appl. Chem., 1994, 66, 1739–1758 CAS.
- N. Krishnankutty and M. A. Vannice, Chem. Mater., 1995, 7, 754–763 CrossRef CAS.
- B. Wang, Q. Y. Chang and K. Gao, Appl. Surf. Sci., 2019, 479, 20–24 CrossRef CAS.
- L. Castanheira, W. O. Silva, F. H. B. Lima, A. Crisci, L. Dubau and F. Maillard, ACS Catal., 2015, 5, 2184–2194 CrossRef CAS.
- L. Castanheira, L. Dubau, M. Mermoux, G. Berthome, N. Caque, E. Rossinot, M. Chatenet and F. Maillard, ACS Catal., 2014, 4, 2258–2267 CrossRef CAS.
| This journal is © The Royal Society of Chemistry 2021 |

