 Open Access Article
Directional growth of octacalcium phosphate using micro-flow reactor mixing and subsequent aging†
Ploypailin (Milin) Saengdet and
Makoto Ogawa
 *
*
School of Energy Science and Engineering, Vidyasirimedhi Institute of Science and Technology (VISTEC), 555 Moo 1 Payupnai, Wangchan, Rayong 21210, Thailand. E-mail: makoto.ogawa@vistec.ac.th
First published on 29th April 2021
Abstract
Well-defined belt-shaped particles of octacalcium phosphate were prepared by mixing aqueous solutions of calcium acetate and that of sodium phosphate monobasic with the aid of a micro-flow reactor. Higher crystallinity and narrower particle size distribution were achieved by the micro-flow reactor if compared with the results of the batch reaction using the same solutions. The width of the belt was controlled by the mixing temperature (0.8 and 2.3 μm for the preparation at 50 and 70 °C, respectively). Post mixing aging at 50 °C, resulted in the directional growth of belt-shaped particles to obtain particles with the length of 17 μm (aspect ratio of 53). XRD and TEM analysis indicated that the micro-flow reactor could separate nucleation and growth allowing preferential growth along the a-direction.
Introduction
As human bone is an organic/inorganic composite of collagen and apatite crystals,1 calcium phosphate/polymer composites are regarded as candidates of bone tissue scaffolds. Calcium phosphates have been synthesized and hybridized with polymers for biomedical application, especially for bone graft substitutes.2 Hybridization with calcium phosphate particles was reported to alter the biocompatibility of polymers due to its similarity to the inorganic component (apatite) of the natural bone,3 high osteoconductivity and high affinity to protein.4,5 Although calcium phosphate/polymer composites have been investigated for biomedical applications, it remains a challenge to obtain hybrids with suitable mechanical strength for bone tissue scaffolds.6Mechanical properties of bones are anisotropic; weak in the tension and shear and tough along the longitudinal direction of human body.7 The elastic collagen fibers are aligned along the stress direction of bone leading to mechanical flexibility. The incorporation of calcium phosphate particles in polymers has been attempted to mimic the structure of human bone, however, only few calcium phosphate/polymer composites were reported to have a mechanical strength suitable for bone tissue scaffolds.8,9 Calcium phosphates with controlled size and morphology are expected to be useful to be dispersed and aligned in polymers, in order to obtain anisotropic mechanical properties of the resulting composites. Particle sizes and shapes were also known to affect biological responses such as cell adhesion and bone regeneration.3,10–12 The small difference in the particle size and morphology of hydroxyapatite in the hydroxyapatite/polyethylene composites was reported to affect the mechanical properties of composites, large size hydroxyapatite particles reduced the strength and modulus but increased the ductility of the composites.13 Calcium phosphate particles with two-dimensional morphology (belt or plate) are expected to lead uni-directional reinforcement of the particles. The stronger cell adsorption property due to the higher surface area comparing with other shape has also reported.14
Octacalcium phosphate (Ca8(HPO4)2(PO4)4·5H2O, hereafter abbreviated as OCP) is structurally similar to hydroxyapatite (Ca3(OH)2(PO4)6, hereafter abbreviated as HA) and it has been reported to participate in mineralized tissue formation as an initial precursor phase of HA.15,16 Under physiological conditions, OCP is thermodynamically metastable with respect to HA, and in vivo transformation of OCP to HA by the hydrolysis was reported.17–20 The in vivo transformation of OCP to HA encouraged the study on OCP-based composites as bone scaffolds.21 OCP particles with two-dimensional morphology, with the size in the rage of 3–5 μm, were used for the application as adsorbents22,23 and capacitor.24 The size and shape of OCP play important roles for some applications. 3D flower-like OCP with the size of 2–5 μm was shown to be an efficient Pb2+ adsorbent.23 The size of OCP in polymer hybrid was reported to affect the capability of bone regeneration and degree of resorption of hybrid materials.25 The resorption of OCP/collagen by osteoblast-like cells was enhanced in the composite composed of belt-shaped of OCP particles with the size from 0.5–3 μm in length comparing that with the size of 53–300 μm and pristine collagen.25,26
Homogeneous precipitation from solution27–32 and phase transformation of dicalcium phosphate dihydrate (CaHPO4·2H2O, hereafter abbreviated as DCPD)33 or α-tricalcium phosphate (α-Ca3(PO4)2, α-TCP)28,34 have been used to prepare OCP. Well-defined OCP plates were prepared by the homogeneous precipitation from acidic aqueous calcium phosphate solution using urea hydrolysis,31 where the incorporation of carbonate ions in the apatite lattice occurred.31,34 The carbonate ions suppressed the crystal growth of OCP in the a-direction to lead irregularly shaped OCP particles with the size of 200–500 nm.35
The effects of the aging time and the aging temperature on the shape and size of OCP particles were reported for homogeneous precipitation in batch reactions. Because the precipitation of OCP is a fast reaction,36 the conventional batch method provided heterogeneous supersaturation in the reaction medium causing a difficulty to obtain well-defined particles. The mixing strongly affects the concentration distribution of reactants, so that it should be optimized for the homogeneous supersaturation. In this study, micro-flow reactor is applied to prepare OCP taking such advantageous aspects of micro-flow reactor as rapid and homogeneous mixing under controlled reaction conditions and homogeneous heating.37–40 Micro-flow reactor is expected to lead monodispersed OCP if compared with those obtained by batch methods. Though micro-flow reactor has been applied to synthesize HA,41–46 to the best of our knowledges, there is no report on the preparation of OCP using micro-flow reactor.
Experimental
Materials
Calcium acetate monohydrate, Ca(CH3COO)2·H2O (≥99.0%, Dae-Jung), and sodium phosphate monobasic, NaH2PO4 (98.0%, Sigma Aldrich), were used without further purification. MQ water (pH 6.5, >15 MΩ cm, Millipore) was used for all the experiments.Sample preparation
Aqueous stock solutions of calcium acetate monohydrate (0.04 M, pH = 7.37) and sodium phosphate monobasic (0.03 M, pH = 4.76) were prepared. Before the mixing, the solution was pre-heated in a water bath (50, 60 and 70 °C), and then, the two solutions (at the molar Ca![[thin space (1/6-em)]](https://www.rsc.org/images/entities/char_2009.gif) :
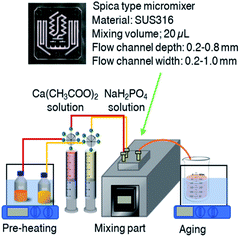
:![[thin space (1/6-em)]](https://www.rsc.org/images/entities/char_2009.gif) P ratio of 1.33, which corresponds to the composition of OCP) were sent to the mixer by syringe pumps (HSW NORM-JECT® Luer-lock syringe 20 mL with the maximum set volume of 18 mL) at the flow rate of 10 mL min−1 through polytetrafluoroethylene (PTFE) tube with the inner diameter of 1 mm. Spica (static type) microreactor was used (SUS316, mixing volume: 20 μL, flow channel depth: 0.2–0.8 mm, flow channel width: 0.2–1.0 mm). A 15 cm long collecting PTFE tube was attached at the mixing chamber for collecting the products. Mixing was done at the pre-heated temperature, then, the solution was aged at the same temperature for 3 h in a sealed container with gentle stirring (70 rpm) (Fig. 1). After the aging, the solid was collected by filtration using membrane filler (nitrocellulose membrane, pore size of 0.1 μm, MT™ Membrane Merck Millipore Ltd), rinsed in water to remove unreacted ions, and freeze-dried. OCP was prepared by the reported batch method30 as follows; 18 mL of 0.02 M calcium acetate monohydrate solution was added dropwise to 0.02 M (18 mL) of sodium phosphate monobasic. Then, the mixture was magnetically stirred (200 rpm) at 60 °C in a 50 mL beaker. The solid was collected by filtration, rinsed in water (to remove remaining soluble salts) and freeze-dried. The conditions are summarized in Table 1.
P ratio of 1.33, which corresponds to the composition of OCP) were sent to the mixer by syringe pumps (HSW NORM-JECT® Luer-lock syringe 20 mL with the maximum set volume of 18 mL) at the flow rate of 10 mL min−1 through polytetrafluoroethylene (PTFE) tube with the inner diameter of 1 mm. Spica (static type) microreactor was used (SUS316, mixing volume: 20 μL, flow channel depth: 0.2–0.8 mm, flow channel width: 0.2–1.0 mm). A 15 cm long collecting PTFE tube was attached at the mixing chamber for collecting the products. Mixing was done at the pre-heated temperature, then, the solution was aged at the same temperature for 3 h in a sealed container with gentle stirring (70 rpm) (Fig. 1). After the aging, the solid was collected by filtration using membrane filler (nitrocellulose membrane, pore size of 0.1 μm, MT™ Membrane Merck Millipore Ltd), rinsed in water to remove unreacted ions, and freeze-dried. OCP was prepared by the reported batch method30 as follows; 18 mL of 0.02 M calcium acetate monohydrate solution was added dropwise to 0.02 M (18 mL) of sodium phosphate monobasic. Then, the mixture was magnetically stirred (200 rpm) at 60 °C in a 50 mL beaker. The solid was collected by filtration, rinsed in water (to remove remaining soluble salts) and freeze-dried. The conditions are summarized in Table 1.
| Sample name | Initial [Ca(CH3COO)2] (mol L−1) | Initial [NaH2PO4] (mol L−1) | Reaction temperature (°C) | Aging time (h) | Phases of the products |
|---|---|---|---|---|---|
| a Sample K was prepared by a batch method. OCP = octacalcium phosphate and DCPD = dcalcium phosphate dihydrate (brushite). | |||||
| A | 0.04 | 0.03 | 25 | — | DCPD |
| B | 0.04 | 0.03 | 40 | — | DCPD |
| C | 0.04 | 0.03 | 50 | — | OCP |
| D | 0.04 | 0.03 | 60 | — | OCP |
| E | 0.04 | 0.03 | 50 | 3 | OCP |
| F | 0.04 | 0.03 | 50 | 6 | OCP |
| G | 0.04 | 0.03 | 50 | 12 | OCP |
| H | 0.02 | 0.015 | 50 | 3 | DCPD, OCP |
| I | 0.02 | 0.015 | 60 | 3 | OCP |
| J | 0.02 | 0.015 | 70 | 3 | OCP |
| Ka | 0.02 | 0.015 | 60 | 3 | OCP |
Characterization
The particles morphology was evaluated using field emission scanning electron microscope (FE-SEM, JEOL JSM-7610F field emission electron microscope) without coating the sample. Transmission Electron Microscope (TEM) images were obtained with a JEOL JEM ARM200F operated at 200 kV. The size of the particles was determined from the SEM images with imaging software (ImageJ, NHI). 100 particles were used to derive the particle size distribution. The powder X-ray diffraction patterns were recorded using a Bruker New D8 Advance instrument using Ni filtered Cu Kα radiation (operated at 40 mA, 40 kV). The diffraction patterns were obtained from 3 to 70° of 2θ with the scanning speed of 0.2° min−1. The Fourier transform infrared spectra on a FTIR spectrometer (model Frontier FTIR, PerkinElmer). The spectra were collected in the wavenumber range of 4000–400 cm−1 with a resolution of 4 cm−1 for 32 scans.Results and discussion
Effects of the reaction temperature on the crystalline phases of the products (samples A–D)
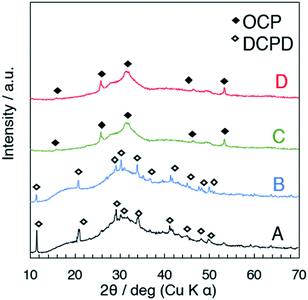
Fig. 2 shows the X-ray powder diffraction patterns of the products prepared at different temperatures where the starting solutions of the same concentration were employed (samples A to D). The major crystalline phase of A (25 °C) and B (40 °C) was DCPD (JCPDS card: no. 09-0077), and that of C (50 °C) and D (60 °C) was OCP. Possible reasons to describe the different phases depending on the synthesis temperature were discussed as follows. Under the examined pH range (the pH of the suspension after the mixing was around 5.6–5.8, Fig. S1†), H2PO4− and HPO42− co-exist in the aqueous solution. The fraction of H2PO4− and HPO42− varies according to the ionization enthalpies of both H2PO4− and buffer HPO42− depending on the temperature as described by the Van't Hoff equation.47 The changes of the concentration of the ions involved and pH affect the degree of supersaturation, the solution will be oversaturated with respect to OCP, resulting in the precipitation of OCP at 50–60 °C (samples C and D). For the formation of preferred crystal phases in supersaturated solutions with respect to different phases, kinetic factors are also important as described previously.20,60 Other phases may form during the initial precipitation. The lower solubility of OCP at the temperature above 50 °C compared with that of DCPD20,32,48 can also be a reason of the difference.Effects of aging time on the size and shape of OCP (samples E–G)
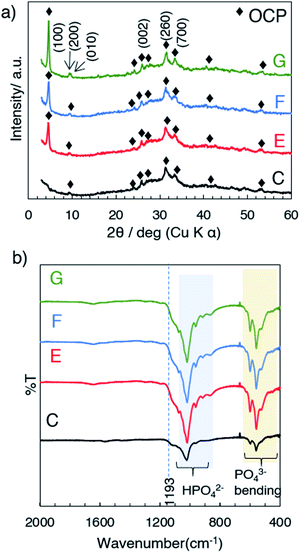
The formation of OCP during the aging was followed by the X-ray diffraction patterns and FTIR spectra. Fig. 3a shows the XRD patterns of samples E, F and G (obtained at 50 °C after aging for 3, 6 and 12 h, respectively) and appearances of the suspension during aging. The XRD patterns exhibited the (100), (200) and (010) reflections corresponding to characteristic to OCP at 4.7, 9.4 and 9.7 degree (2θ), respectively. The structural developments were supported by the FTIR, which indicated no transformation during the aging stages (Fig. 3b). FTIR spectra of all the samples show characteristic absorption of OCP49 such as PO43− and HPO42− derived bands at 1050–990 cm−1. The absorption at 1193 cm−1 was associated with H2O in the structure. The SEM images of the products (C, E, F and G) are shown in Fig. 4a. Aggregate spherical-liked particles with the size of 0.3–0.7 μm were seen for the sample without post-mixing aging (sample C, Fig. 4a). For E, belt-shaped particles with the average size of ca. 0.25 μm in the width and aggregated spherical-liked articles with the diameter of 1.5 μm co-existed. Longer aging time led longer belt-shaped particles as seen in the SEM images of samples F and G. After the aging for 12 h (sample G), the average length of the OCP particles was 17 μm, while the width changed only slightly (from 0.25 to 0.32 μm) as shown by the SEM image. The orientation and crystal structure of belt-shaped particles were further examined by TEM and selected area electron diffraction (SAED). SAED of the belt-like particle showed the (010) and (002) diffraction spots (sample G, Fig. 4b), suggesting bc plane is the plane of the belt-shaped OCP. HRTEM images showed orientation along bc plane. The SAED patterns of the belt-shaped particles obtained after the aging for 12 h showed more diffraction spots, indicating higher crystallinity. The TEM and SAED observations are consistently suggesting the developments of bc plane during the aging, which was also seen in the XRD result.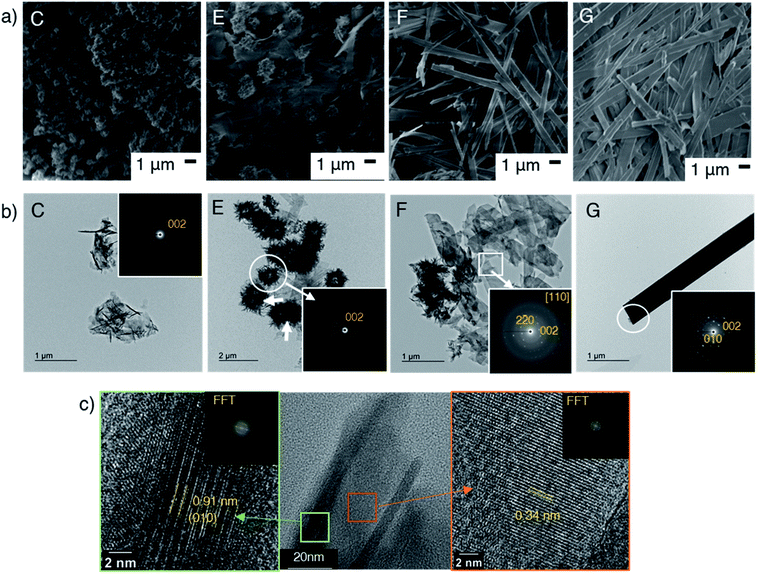 | ||
| Fig. 4 (a) SEM images and (b) TEM images of samples C, E, F and G, the inserts show SAED patterns. (c) HRTEM images and corresponding FFT patterns of belt-liked particle. | ||
OCP unit cell consists of apatitic layers, in which Ca2+ and PO43− occupy the same relative positions as HA, and hydrated layers, which consists of PO4(HPO4) and OH(H2O), parallel to the a-direction as shown in Scheme 1.18 The growth of OCP occurs by involving apposition of ions on the (100) face, which is exposed to the solution.18,20 The (100) face of the apatitic layer was reported to be the most energetic face in contact with water greater than the other faces.63 Due to the higher surface energy, the ions preferentially add to the (100) face in order to reduce the total surface energy. The intense (h00) reflections observed after the aging indicated the development of OCP crystal along the a-direction, which corresponded to the TEM results. The longer aging time may cause further elongation of OCP and improve crystallinity along a-direction. The topotactic transformation of OCP to HA under aging time was reported to occur,50 OCP was obtained without HA formation after the aging for 12 h in the present study.
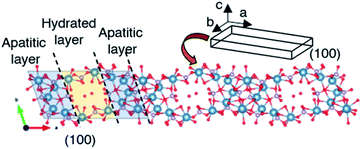 | ||
| Scheme 1 Schematic illustration of the growth direction of octacalcium phosphate. Crystal structure was created by using VESTA ver.3.4.8. | ||
Effects of the mixing temperature on the size and shape of OCP (samples H, I and J)
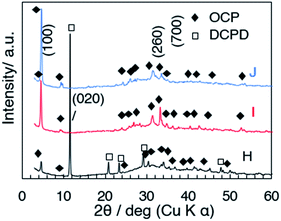
The XRD patterns of samples H, I and J (prepared at 50, 60 and 70 °C) with the aging for 3 h are shown in Fig. 5. In the diffraction pattern of sample H (50 °C, Fig. 5a), the (100) reflection of OCP and the (020) reflection of DCPD were seen at 4.70° and 11.61°, respectively, while the reflections due to DCPD were not seen for samples I (60 °C) and J (70 °C). The (100) reflection of OCP was sharper for the samples prepared at higher temperature. Same as C, aggregated spherical particles were observed for D (after mixing at 60 °C without aging) as shown in the SEM images (Fig. 6a and b). In the SEM image of sample H (Fig. 6c), platy particles with the lateral size of ca. 15–20 μm and particles with flower-like morphology composed of belt-shaped particles with the size of ca. 85 nm in the thickness and 30 μm in the length (Fig. 6d). Isolated belt-shaped particles were main product for samples I and J. The width of the belt was ca. 1.0 and 2.3 μm for samples I and J, respectively, and the average length was ca. 18 μm (Fig. 6e and f), which is consistent with the crystallite size in the a-direction determined by XRD using Scherrer equation shown in Table 2.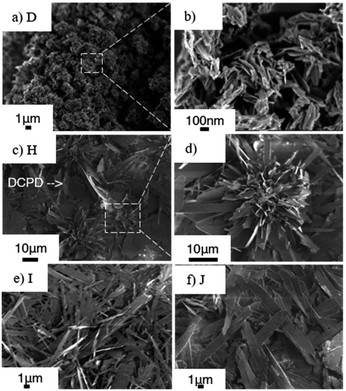 | ||
| Fig. 6 SEM images of samples D (a) with magnified image under SEM observation (b), sample H (c) with magnified image (d), sample I (e) and sample J (f). | ||
| Reaction temperature/°C | Crystallize sizea/nm | Average particle sizeb/μm |
|---|---|---|
a Crystallize size was calculated from Scherrer's equation as Xs = 0.9λ/(FWHM × cos![[thin space (1/6-em)]](https://www.rsc.org/images/entities/char_2009.gif) θ) where Xs is the crystalline size [nm]; λ is the wavelength of X-ray beam [nm] (λ = 0.15406 nm for CuKα); FWHM the full width at half maximum of the (100) diffraction peak.b Average particle size was derived from SEM image with 100 particles. θ) where Xs is the crystalline size [nm]; λ is the wavelength of X-ray beam [nm] (λ = 0.15406 nm for CuKα); FWHM the full width at half maximum of the (100) diffraction peak.b Average particle size was derived from SEM image with 100 particles. |
||
| 50 | 30.8 | 1.08 |
| 60 | 34.6 | 1.00 |
| 70 | 36.4 | 2.26 |
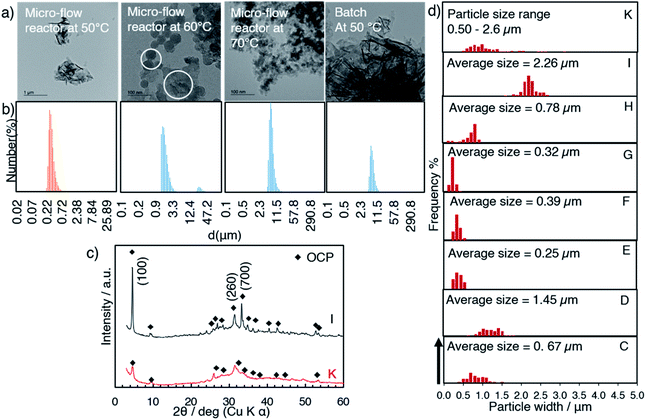
It was shown that the length of the particles increased from 1.5 (sample D) to 17 (sample I) μm after the post mixing aging at 60 °C for 3 h (Fig. 6a and e). The crystal growth rate is proportional to the reaction temperature according to the formula, dL/dt = C![[thin space (1/6-em)]](https://www.rsc.org/images/entities/char_2009.gif) exp(−1/RT), where L is corresponding to the crystal size, and T corresponds to the reaction temperature.51 The crystal growth rate may be considered for the difference in the obtained particle size (sample I and J).52 In addition, TEM images show the connection of the particles for the sample obtained at higher mixing temperature (Fig. 7a, white circle). The particle size distribution measured by dynamic light scattering (DLS) showed the bimodal size distribution, indicating the evidence of particle attachment (Fig. 7b). The larger OCP particles at higher temperature were thought to be caused by the crystal growth rate and particle attachment.
exp(−1/RT), where L is corresponding to the crystal size, and T corresponds to the reaction temperature.51 The crystal growth rate may be considered for the difference in the obtained particle size (sample I and J).52 In addition, TEM images show the connection of the particles for the sample obtained at higher mixing temperature (Fig. 7a, white circle). The particle size distribution measured by dynamic light scattering (DLS) showed the bimodal size distribution, indicating the evidence of particle attachment (Fig. 7b). The larger OCP particles at higher temperature were thought to be caused by the crystal growth rate and particle attachment.
General discussion
OCP was reported to precipitate as 3D flower-like particles consisting of belt,29,30,53 plate27,54 and fiber.34,55,56 It was reported that such organic molecules as cetyltrimethylammonium bromide (CTAB)57 and ameloginin58 played a role to control the particle size of OCP. Belt-shaped particle of OCP with the size of 1–3 μm was obtained by the precipitation in the presence of CTAB.57 As a negative aspect of the additives, they might be harmful to health/environment and affect the bioactivity and biocompatibility of the resulting OCP. In the present study, belt-shaped particles of OCP were obtained without using additives, avoiding the procedures to purify the product.It is thought that the nucleation is driven by the formation of metastable calcium phosphate, which rapidly transforms to OCP. In the metastable phases (DCPD and amorphous calcium phosphate, hereafter denoted as ACP), no orientational long-range order of atomic positions exist. In the precipitation from high supersaturation, nucleation consumes the ions in the solution for ACP formation to terminate further nucleation and the assembly of crystals occurs in a diffusion-controlled growth. This process lasts a few minutes and the supersaturation falls (indicating by the drop of pH after mixing, Fig. S2†) to a level at which the growth mode changes from the diffusion-controlled to the reaction-controlled. During the aging, the transformation of ACP to OCP occurs.59 On the other hand, at low supersaturation, DCPD formed and transformed to OCP.20,60
Instantaneous mixing and homogeneous heat transfer by micro-flow reactor are expected to provide a short nucleation period, preventing further nucleation before the crystal growth.61 In order to confirm this hypothesis, a batch mixing was done using the same solution and the temperature used for the preparation of sample I. The DLS results (Fig. 7b) confirmed that the micro-flow reactor mixing afforded a short nucleation, leading to obtain narrow particle size distribution against the preparation in batch (Fig. 7d and S2†). The higher crystallinity of OCP was obtained by the micro-flow reactor compared to the product prepared by a batch (Fig. 7c), suggesting the growth rate of OCP in the a-direction depend on mixing condition. The mixing condition was optimized to affect OCP formation and growth with maintaining the supersaturation of OCP.62 Homogeneous mixing provided by flow reactor made the reaction environment favorable for OCP growth. Apart from the reaction temperature, the size of particle was reported to be controlled by the flow rate.39,41 These parameters will be examined in the subsequent study.
Conclusions
Belt-shaped octacalcium phosphate particles were prepared by using micro-flow reactor for mixing calcium acetate solution and sodium phosphate monobasic solution at temperature above 50 °C. This is the first report on the synthesis of octacalcium phosphate using micro-flow reactor. The octacalcium phosphates obtained by using micro-flow reactor were characterized by the narrower particle size distribution and higher crystallinity if compared with the product prepared by a batch reactor by separation of nucleation and subsequence aging process. The size of belt-shaped octacalcium phosphate particles was 0.78 μm when the mixing was performed at 50 °C and was 2.3 μm at 70 °C. The directional growth of the belt-shaped octacalcium phosphate particles was observed during the aging by preferential growth along a-direction.Conflicts of interest
There are no conflicts to declare.Acknowledgements
This work was supported by the Research Chair Grant 2017 (Grant FDA-CO-2560-5655) from the National Science and Technology Agency (NSTDA) and the Research Chair Grant 2020 (grant number B05F630117) from Program Management Unit (PMU) and Office of National Higher Education Science Research and Innovation Policy Council (NXPO), Thailand. One of the authors (P. M. S.) acknowledges the Vidyasirimedhi Institute of Science and Technology for a scholarship for her PhD study and Srimedhi scholarship from HRH princess Maha Chakri Sirindhorn.References
- S. Graham and P. W. Brown, J. Cryst. Growth, 1993, 132, 215–225 CrossRef CAS.
- Y. Zhang and M. Zhang, J. Biomed. Mater. Res., 2002, 61, 1–8 CrossRef CAS PubMed.
- S. Von Euw, Y. Wang, G. Laurent, C. Drouet, F. Babonneau, N. Nassif and T. Azais, Sci. Rep., 2019, 9, 8456 CrossRef PubMed.
- A. J. Ambard and L. Mueninghoff, J. Prosthodontics, 2006, 15, 321–328 CrossRef PubMed.
- Y. Hong, H. Fan, B. Li, B. Guo, M. Liu and X. Zhang, Mater. Sci. Eng., R, 2010, 70, 225–242 CrossRef.
- A. J. Wagoner Johnson and B. A. Herschler, Acta Biomater., 2011, 7, 16–30 CrossRef CAS PubMed.
- J.-Y. Rho, L. Kuhn-Spearing and P. Zioupos, Med. Eng. Phys., 1998, 20, 92–102 CrossRef CAS PubMed.
- M. Younesi and M. E. Bahrololoom, Mater. Des., 2009, 30, 3482–3488 CrossRef CAS.
- X. Zheng, S. Zhou, Y. Xiao, X. Yu and B. Feng, J. Biomed. Mater. Res., Part B, 2009, 91, 181–190 CrossRef PubMed.
- I. da Silva Brum, J. J. de Carvalho, J. L. da Silva Pires, M. A. A. de Carvalho, L. B. F. Dos Santos and C. N. Elias, Sci. Rep., 2019, 9, 19602 CrossRef CAS PubMed.
- Y. Honda, T. Anada, S. Kamakura, S. Morimoto, T. Kuriyagawa and O. Suzuki, Tissue Eng., Part A, 2009, 15, 1965–1973 CrossRef CAS PubMed.
- K. Lin, C. Wu and J. Chang, Acta Biomater., 2014, 10, 4071–4102 CrossRef CAS PubMed.
- M. Wang, R. Joseph and W. Bonfield, Biomaterials, 1998, 19, 2357–2366 CrossRef CAS.
- J. Rexer and E. Anderson, Polym. Eng. Sci., 1979, 19, 1–11 CrossRef CAS.
- S. Dorozhkin, Bioceram. Dev. Appl., 2014, 4, 081 Search PubMed.
- S. V. Dorozhkin, Ceram. Int., 2015, 41, 13913–13966 CrossRef CAS.
- S. Ban, T. Jinde and J. Hasegawa, Dent. Mater. J., 1992, 11, 130–140 CrossRef CAS PubMed.
- W. E. Brown, J. P. Smith, J. R. Lehr and A. W. Frazier, Nature, 1962, 196, 1050–1055 CrossRef CAS.
- N. Miyatake, K. N. Kishimoto, T. Anada, H. Imaizumi, E. Itoi and O. Suzuki, Biomaterials, 2009, 30, 1005–1014 CrossRef CAS PubMed.
- L. Wang and G. Nancollas, Chem. Rev., 2008, 108, 4628–4669 CrossRef CAS PubMed.
- O. Suzuki, Jpn. Dent. Sci. Rev., 2013, 49, 58–71 CrossRef.
- A. Elyahyaoui, K. Ellouzi, H. Al Zabadi, B. Razzouki, S. Bouhlassa, K. Azzaoui, E. M. Mejdoubi, O. Hamed, S. Jodeh and A. Lamhamdi, Appl. Sci., 2017, 7, 222 CrossRef.
- J. Zhu, J. Shu, X. Yue and Y. Su, J. Mater. Sci., 2020, 55, 7502–7517 CrossRef CAS.
- M. Tuncer, F. Bakan, H. Gocmez and E. Erdem, Nanoscale, 2019, 11, 18375–18381 RSC.
- Y. Tanuma, T. Anada, Y. Honda, T. Kawai, S. Kamakura, S. Echigo and O. Suzuki, Tissue Eng., Part A, 2012, 18, 546–557 CrossRef CAS PubMed.
- Y. Murakami, Y. Honda, T. Anada, H. Shimauchi and O. Suzuki, Acta Biomater., 2010, 6, 1542–1548 CrossRef CAS PubMed.
- M. J. Arellano-Jiménez, R. García-García and J. Reyes-Gasga, J. Phys. Chem. Solids, 2009, 70, 390–395 CrossRef.
- A. Bigi, E. Boanini, R. Botter, S. Panzavolta and K. Rubini, Biomaterials, 2002, 23, 1849–1854 CrossRef CAS PubMed.
- Z. Gou, X. Yang, X. Gao, X. Zhang, K. Ting, B. M. Wu and C. Gao, CrystEngComm, 2009, 11, 1585–1590 RSC.
- R. LeGeros, Calcif. Tissue Int., 1985, 37, 194–197 CrossRef CAS PubMed.
- K. Lin, J. Chang, Y. Zhu, W. Wu, G. Cheng, Y. Zeng and M. Ruan, Cryst. Growth Des., 2009, 9, 177–181 CrossRef CAS.
- Y. Liu, R. M. Shelton and J. Barralet, Key Eng. Mater., 2003, 254–256, 79–82 Search PubMed.
- L. Perez, L. J. Shyu and G. H. Nancollas, Colloids Surf., 1989, 38, 295–304 CrossRef CAS.
- C. Li, X. Ge, G. Li, Q. Gao and R. Ding, Adv. Powder Technol., 2014, 25, 1661–1666 CrossRef CAS.
- M. Iijima, H. Kamemizu, N. Wakamatsu, T. Goto, Y. Doi and Y. Moriwaki, J. Cryst. Growth, 1994, 135, 229–234 CrossRef CAS.
- J. Sui, J. Yan, D. Liu, K. Wang and G. Luo, Small, 2019, 16, 1902828 CrossRef PubMed.
- G. Luo, L. Du, Y. Wang, Y. Lu and J. Xu, Particuology, 2011, 9, 545–558 CrossRef CAS.
- J. Ma, S. M.-Y. Lee, C. Yi and C.-W. Li, Lab Chip, 2017, 17, 209–226 RSC.
- K. Shiba and M. Ogawa, Chem. Rec., 2018, 18, 950–968 CrossRef CAS PubMed.
- C.-X. Zhao, L. He, S. Z. Qiao and A. P. J. Middelberg, Chem. Eng. Sci., 2011, 66, 1463–1479 CrossRef CAS.
- F. Castro, A. Ferreira, F. Rocha, A. Vicente and J. A. Teixeira, Ind. Eng. Chem. Res., 2013, 52, 9816–9821 CrossRef CAS.
- E. Fujii, K. Kawabata, Y. Nakazaki, Y. Tanizawa, Y. Shirosaki, S. Hayakawa and A. Osaka, J. Ceram. Soc. Jpn., 2011, 119, 116–119 CrossRef CAS.
- E. Fujii, K. Kawabata, Y. Shirosaki, S. Hayakawa and A. Osaka, J. Ceram. Soc. Jpn., 2015, 123, 101–105 CrossRef CAS.
- K. Kandori, T. Kuroda, S. Togashi and E. Katayama, J. Phys. Chem. B, 2011, 115, 653–659 CrossRef CAS PubMed.
- M. Matsuzawa, S. Togashi and K. Kandori, Bull. Chem. Soc. Jpn., 2013, 86, 707–713 CrossRef CAS.
- Q. Yang, J.-X. Wang, L. Shao, Q.-A. Wang, F. Guo, J.-F. Chen, L. Gu and Y.-T. An, Ind. Eng. Chem. Res., 2010, 49, 140–147 CrossRef CAS.
- L. G. Gagliardi, M. Tascon and C. B. Castells, Anal. Chim. Acta, 2015, 889, 35–57 CrossRef CAS PubMed.
- M. Frèche and J. Heughebaert, J. Cryst. Growth, 1989, 94, 947–954 CrossRef.
- B. O. Fowler, M. Markovic and W. E. Brown, Chem. Mater., 1993, 5, 1417–1423 CrossRef CAS.
- M. Iijima, H. Kamemizu, N. Wakamatsu, T. Goto, Y. Doi and Y. Moriwaki, J. Cryst. Growth, 1997, 181, 70–78 CrossRef CAS.
- A. Myerson, Handbook of industrial crystallization, Butterworth-Heinemann, 2002 Search PubMed.
- E. J. H. Lee, C. Ribeiro, E. Longo and E. R. Leite, J. Phys. Chem. B, 2005, 109, 20842–20846 CrossRef CAS PubMed.
- A. Bigi, E. Boanini, D. Walsh and S. Mann, Angew. Chem., Int. Ed., 2002, 41, 2163–2166 CrossRef CAS.
- E. Boanini, M. Gazzano, K. Rubini and A. Bigi, Cryst. Growth Des., 2010, 10, 3612–3617 CrossRef CAS.
- R. Kuniya and K. Itatani, Phosphorus Res. Bull., 2017, 33, 14–20 CrossRef CAS.
- X. Lu, Y.-b. Wang, J.-x. Wang, S.-x. Qu, J. Weng, R.-l. Xin and Y. Leng, J. Cryst. Growth, 2006, 297, 396–402 CrossRef CAS.
- X. Yang, X. Gao, Y. Gan, C. Gao, X. Zhang, K. Ting, B. M. Wu and Z. Gou, J. Phys. Chem. C, 2010, 114, 6265–6271 CrossRef CAS.
- M. Iijima and J. Moradian-Oldak, J. Mater. Chem., 2004, 14, 2189–2199 RSC.
- M. Van Kemenade and P. De Bruyn, J. Colloid Interface Sci., 1987, 118, 564–585 CrossRef CAS.
- L. Wang and G. H. Nancollas, Dalton Trans., 2009, 2665–2672 RSC.
- S. G. Kwon and T. Hyeon, Small, 2011, 7, 2685–2702 CrossRef CAS PubMed.
- M. Iijima, H. Kamemizu, N. Wakamatsu, T. Goto, Y. Doi and Y. Moriwaki, J. Cryst. Growth, 1998, 193, 182–188 CrossRef CAS.
- W. Zhao, Z. Xu, Y. Yang and N. Sahai, Langmuir, 2014, 30, 13283–13292 CrossRef CAS PubMed.
Footnote |
| † Electronic supplementary information (ESI) available: The crystallite size determined by XRD using Scherrer equation. Change of pH during the aging at 50 °C starting from the solutions with the initial concentration of Ca(CH3COO)2·H2O and NaH2PO4 0.04 M. See DOI: 10.1039/d1ra00827g |
| This journal is © The Royal Society of Chemistry 2021 |

