 Open Access Article
Graphene/silver-based composites and coating on dead coral for degradation of organic pollution using the Z-scheme mechanism†
Maedeh Nooriha Najafabadi,
Hajar Ghanbari * and
Rahim Naghizadeh
School of Metallurgy & Materials Engineering, Iran University of Science and Technology (IUST), Narmak, Tehran, Iran. E-mail: hajar_ghanbari@iust.ac.ir; Tel: +98 21 73228823
First published on 2nd June 2021
Abstract
A high-performance photocatalytic nanocomposite consisting of silver phosphate-based particles with GO and RGO was synthesized by co-precipitation and hydrothermal methods. Ag3PO4 was prepared by a co-precipitation method. The as-prepared Ag3PO4 nanocomposites were characterized by different analyses. The results demonstrated that the Ag3PO4 particles were well dispersed on the graphene-based surfaces. The photocatalytic performance of the GO/RGO/Ag3PO4 nanocomposite was evaluated for the photodegradation of methylene blue (MB) under exposure to visible light (xenon lamp λ > 400 nm). The degradation rate was about 98% in 5 min. The enhancement in photocatalytic performance is attributed to the simultaneous presence of RGO and GO, which show significantly high absorption of organic molecules on the surface of GO/RGO, allowing the effective transfer and separation of photogenerated electrons. In addition, this modified structure can be in situ synthesized on dead coral structures that can be used in future real case-studies of the degradation of other organic pollutants. The ingredient of these composites, however, is about 93% Ag3PO4.
1. Introduction
Nowadays, water treatment is a fundamental global challenge due to the lack of safe drinking water, extensive population growth,1 and the development of water-polluting industries (e.g., oil refineries, textile and dyestuff factories, hospitals).2 Biological (viruses, bacteria, and fungi),3 mineral (nitrate, sulfate, and heavy metal), and organic contaminants (medicinal, dung, dyestuffs, oil, larvicides) are three major pollutants of water. Natural organic matter (NOM) causes an unpleasant odor, taste, and a change in the color of the water; in addition, this wide-ranging family prevents cation removal by forming complex compounds.4,5There are many different methods for removing organic pollutions from water: physical (filtration), chemical (chlorine and ozone disinfection, coagulation, sedimentation, and advanced oxidation processes (AOPs)), and microorganisms-based (bacterial).5–7 As a subset of AOPs, photocatalysis is an eco-friendly approach for the degradation of organic pollutants in water that is based on the application of clean solar energy.2,7–11 In this approach, with regard to the exposure of the semiconductor to light with hν ≥ Eg, electrons are excited from the valence band (VB) to the conduction band (CB), while an electron (e−)–hole (h+) pair is photogenerated (i.e., a charge carrier). When the charge carriers have arrived at the surface of the photocatalyst, organic materials can be oxidized or reduced, and active superoxide (O2−) or hydroxyl radical (˙OH) and hydrogen peroxide (H2O2) are produced.5,9,12 Among the challenges to this approach is the low efficiency in visible light as well as the recombination of charge carriers. Besides, most semiconductors often have a wide-band gap, which results in activity in the ultraviolet range of light.5,12,13 Therefore, designing, manipulating, or decorating the semiconductor structure can be targeted to decrease the band gap for activity in the visible light region. Various mechanisms of charge carrier transfer and band structure manipulation routes are as follows: Schottky junctions, Type-II heterojunctions, Z-scheme heterojunctions, and van der Waals heterostructures.5,12,14 These mechanisms are obtained by coupling two semiconductors or metal complexes, metal doping or noble metal-based plasmonic nanoparticles (Ag, Au, Pt). Although it could be interesting to design a structure based on the collaborative advantages of two or all of these solutions. Among these strategies, Type-II heterojunction and Z-scheme are more effective. Although the Z-scheme heterojunction has the same band structure as a Type-II heterojunction, their charge carrier transfer is different.14
Recently, graphene (G), which is semimetallic with zero band gaps, has attracted much attention in improving photocatalysis performance. The properties of graphene include high electrical conductivity, low density, high flexibility, high electron mobility (200![[thin space (1/6-em)]](https://www.rsc.org/images/entities/char_2009.gif) 000 cm2 V−1 s−1), high specific surface (2600 m2 g−1), hydrophobicity, and acceptable surface plasmon resonance. Composites containing graphene can benefit from increased pollution absorption, reduced band gap, higher surface area, limited recombination, and an improved charge carrier migration rate.15–18 Graphene composites can also increase the capacity of pollutant degradation by enhancing the ultra-wide spectral response.18–20
000 cm2 V−1 s−1), high specific surface (2600 m2 g−1), hydrophobicity, and acceptable surface plasmon resonance. Composites containing graphene can benefit from increased pollution absorption, reduced band gap, higher surface area, limited recombination, and an improved charge carrier migration rate.15–18 Graphene composites can also increase the capacity of pollutant degradation by enhancing the ultra-wide spectral response.18–20
Graphene oxide, a graphene derivative with different properties due to oxygen functional groups,21 has attracted much attention. Hydrophilicity, resistance to agglomeration in an aqueous medium, and increased surface area compared to RGO are the characteristics we can benefit from in preparing a photocatalytic RGO composite.22,23 Significantly, the oxygen-containing functionalities and edge defects on the semiconducting graphene oxide (GO) also enable it to be a more intriguing nanomaterial for visible-light-driven photocatalysis.12
There have been many studies on the two most commonly used photocatalysts of titanium dioxide and zinc oxide so far;1 however, the band gap is not applicable in visible light. On the other hand, Ag-based semiconductors are appropriate considering toxicity and possibility of band gap manipulation. Metallic nanoparticles, in particular, silver nanoparticles, have received considerable attention due to their potential in the degradation of organic pollutants (dyes), such as MB, MO, Rhodamine B (RhB), and Rhodamine 6G, and also because of their low toxicity, and strong antimicrobial properties.24,25 By adjusting the morphology, size, and composition of the plasmonic metals on semiconductors to form a strong surface plasmon resonance, the photocatalytic activity can be improved in the visible light range. Ag-based compounds, such as Ag3PO4, Ag2CO3, AgGaO2, Ag2CrO4, Ag2S, and Ag2Se, have been mentioned for this usage.12,24,26,27 Ag3PO4 has a body-centered cubic structure type, and it has an indirect band gap (2.36 eV); it is widely used under visible light.28 Research using Ag3PO4 photocatalysts is reviewed in Table 1. It is worth noting that AgNPs have been used to connect activated GO and Ag3PO4.24 In 2018, Reheman et al.29 for the first time synthesized RGO/Ag3PO4 QDs in a one-step reduction process using ultrasonic waves and light with an activity of more than 99% in 10 min. Cui et al.8 conducted a study on Ag3PO4/RGO/Ag, which degraded 98% of RhB in 30 min of radiation under visible light. The reduced graphene oxide of this composite plays the role of an electron acceptor to prevent electron–hole recombination.
| Photocatalyst | Synthesis method | Target pollutant/volume solution/concentration | Mass photocatalyst (g) | Degradation time (min)/efficiency | Year | References |
|---|---|---|---|---|---|---|
| Ag3PO4 | Ion-exchange | MB/100 ml/15.3 mg l−1 | 0.3 g | 120/30% | 2010 | 28 |
| GO/Ag3PO4/Ag | Precipitation | MO/13.5 ml/20 mg l−1 | 10 mg | 24/95% | 2013 | 30 |
| Ag3PO4/Ag | 24/78% | |||||
| GNs/Ag3PO4/Ag | Hydrothermal | MO/100 ml/10 ppm | 50 mg | 120/71% | 2015 | 31 |
| Congo red | 60/100% | |||||
| RhB | 120/85% | |||||
| RGO/Ag3PO4 | Hydrothermal | RhB/50 ml/1 × 10−5 mol l−1 | 20 mg | 180/98% | 2016 | 32 |
| Ag3PO4 | Hydrothermal | RhB/150 ml/1 × 10−5 mol l−1 | 0.15 g | UV light-120/99.55% | 2017 | 33 |
| GO and Ag vacancy in Ag3PO4 | Precipitation and ultrasonic | RhB/50 ml/6 mg l−1 | 50 mg | 40/98% | 2018 | 34 |
| Ag3PO4 | Sonochemical and hydrothermal | MB/50 ml/5 mg l−1 | 50 mg | 10/99% | 2018 | 35 |
| RhB | 20/99% | |||||
| Ag3PO4/g-C3N4 | Precipitation | Diclofenac/100 ml/10 mg l−1 | 15/100% | 2018 | 36 | |
| Ag3PO4 | Hydrothermal | Phenol/25 ml/0.21 mmol l−1 | 125 mg | 60/100% | 2018 | 37 |
| GO/Ag3PO4 QD | Precipitation and ultrasonic | MB/100 ml/10 ppm | 10 mg | 5/97.5% | 2018 | 29 |
| Aerogel GO/Ag3PO4/Ag | Hydrothermal | MB/200 ml/2 g l−1 | 0.2 g | 60/95.53% | 2019 | 38 |
| P/Ag/Ag2O/Ag3PO4/TiO2 | Sol–gel | RhB/50 ml/2 mg l−1 | 0/05 g | 60/97.1% | 2015 | 39 |
| Ag3PO4 | Hydrothermal and precipitation | MB/50 ml/10 mg l−1 | 0.01 g | 120/79.4% | 2019 | 40 |
| RGO/Ag3PO4 | Hydrothermal | MB/100 ml/— | 50 mg | 15/96.8% | 2019 | 41 |
| RhB | 15/92% |
On the other hand, the hydrothermal method is a versatile one in controlling the degree of GO reduction with regard to the reaction temperature. By increasing the hydrothermal temperature to 180 °C, the graphene oxide would be mostly reduced. However, by applying lower temperatures, the manipulation of a graphene oxide suspension with a combination of RGO and GO is possible.
However, to the best of the writers' knowledge, the simultaneous presence of GO and RGO as a substrate for Ag3PO4 nanoparticles has not yet been reported. This combination can present a high surface area for the better dispersion and anchoring of Ag-based nanoparticles on RGO/GO nanosheets, inhibition of RGO agglomeration, and higher electrical conductance of Ag-based/G-based nanocomposites.
In this study, GO and Ag3PO4 are proposed for use as semiconductors, while RGO and Ag nanoparticles are the conductors in the Z-scheme and heterojunction mechanism (i.e., a multi-heterojunction) to enhance efficient photocatalytic activity under visible light. The best performance, considering the reduction in the recombination of electrons and holes as well as improving the photocatalytic activity, occurred in two samples of RGO/GO/Ag3PO4 and GO/Ag3PO4 synthesized by a hydrothermal (60 °C for 24 h) method, where the graphene and graphene oxide were present simultaneously.
2. Experimental
2.1. Materials
In order to synthesize graphene oxide, graphite (325 mesh), sulfuric acid (H2SO4, 98%), ortho-phosphoric acid (H3PO4, 85%), hydrochloric acid (HCL, 20%), hydrogen isopropoxide (H2O2, 33%), and deionized water (distilled water) were purchased from Iran Persian Chemical Co, Iran. In order to synthesize the composite and test the photocatalytic degradation, potassium permanganate (KMnO4), silver nitrate (AgNO3), disodium hydrogen phosphate dodecahydrate (Na2HPO4·12H2O), methylene blue (S36H18ClN3S), and ethanol were used in analytical grade from the Merk company (Germany). The reduced graphene oxide employed was research-grade (United Nanotech Innovations Pvt Ltd). In this work, Persian Gulf water corals were used as a substrate for composite coatings.2.2. GO/RGO/Ag3PO4/Ag composite powder synthesis
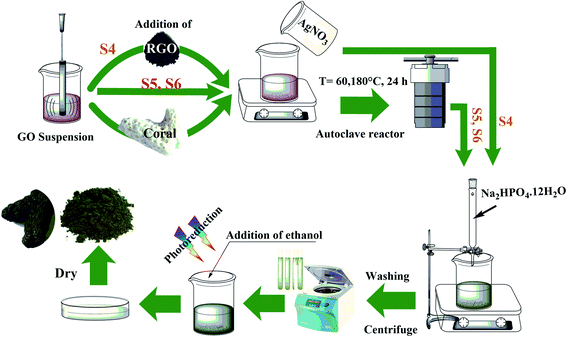
Graphene oxide was synthesized by Hummers' method42 (GO1), while GO2 was prepared after an extended period of HCl washing (72 h), compared to GO1 (24 h) in the 1st stage of washing. The composites were prepared by the co-precipitation method. According to Fig. 1 and Table 2, 50 ml (0.25 mg ml−1) of graphene oxide and 0.0125 g of commercial RGO with an RGO![[thin space (1/6-em)]](https://www.rsc.org/images/entities/char_2009.gif) :
:![[thin space (1/6-em)]](https://www.rsc.org/images/entities/char_2009.gif) GO ratio of 1
GO ratio of 1![[thin space (1/6-em)]](https://www.rsc.org/images/entities/char_2009.gif) :
:![[thin space (1/6-em)]](https://www.rsc.org/images/entities/char_2009.gif) 1 were dispersed by ultrasonic irradiation for 10 min. Then, 0.5 g of AgNO3 was dissolved in this suspension and stirred on a magnetic stirrer for 12 h. A solution of 0.2 g of Na2HPO4·12H2O in 50 ml of deionized water was gradually added to the as-prepared suspension with a burette under dark conditions at room temperature. The collected precipitate was washed with water and then ethanol by centrifuge at 6000 rpm for 2 min. This suspension was placed under a Xe lamp light to perform the reduction process in the presence of ethanol to convert Ag+ cations to Ag metallic nanoparticles. Finally, the sample was dried in an oven at 65 °C for 3 h. Before adding Na2HPO4·12H2O, the reduction step in two samples (S5 and S6) was carried out by the hydrothermal method at 60 °C and 180 °C for 24 h. The other two samples (S1 and S2), similar to the S5 and S6 samples, were reduced at 60 °C and 180 °C for 24 h in an autoclave as the case-controls.
1 were dispersed by ultrasonic irradiation for 10 min. Then, 0.5 g of AgNO3 was dissolved in this suspension and stirred on a magnetic stirrer for 12 h. A solution of 0.2 g of Na2HPO4·12H2O in 50 ml of deionized water was gradually added to the as-prepared suspension with a burette under dark conditions at room temperature. The collected precipitate was washed with water and then ethanol by centrifuge at 6000 rpm for 2 min. This suspension was placed under a Xe lamp light to perform the reduction process in the presence of ethanol to convert Ag+ cations to Ag metallic nanoparticles. Finally, the sample was dried in an oven at 65 °C for 3 h. Before adding Na2HPO4·12H2O, the reduction step in two samples (S5 and S6) was carried out by the hydrothermal method at 60 °C and 180 °C for 24 h. The other two samples (S1 and S2), similar to the S5 and S6 samples, were reduced at 60 °C and 180 °C for 24 h in an autoclave as the case-controls.
| Code of Samples | Samples | Method |
|---|---|---|
| RGO | Reduced graphene oxide | Commercial |
| GO1 | Graphene oxide 1 | Hummers |
| GO2 | Graphene oxide 2 | Hummers |
| S1 | Reduced graphene oxide | Hydrothermal (60 °C) |
| S2 | Reduced graphene oxide | Hydrothermal (180 °C) |
| S3 | Ag3PO4 | Co-precipitation |
| S4 | RGO/GO1/Ag3PO4 | Co-precipitation |
| S5 | GO2/Ag3PO4/Ag | Hydrothermal (60 °C)–Co-precipitation |
| S6 | GO2/Ag3PO4/Ag | Hydrothermal (180 °C)–Co-precipitation |
2.3. In situ coating of GO/Ag3PO4 on the coral
First, the coral was put into phosphoric acid for about a few minutes and then washed with deionized water several times (repeatedly). Three irregular coral pieces (∼2 × 1 × 1 cm) were dipped in graphene oxide suspension 25 ml (0.5 mg ml−1). Then, silver nitrate solution was added to the suspension and placed in a Teflon-lined autoclave at 60 °C for 12 h. Finally, the corals were dipped in Na2HPO4·12H2O solution, set on a shaker for 5 h, and dried in an oven at 200 °C for 2 h. The material ratios used are similar to the ratios used in S5.2.4. Characterization
The phase structure of the samples was characterized by X-ray Diffraction (XRD) with a general-purpose X-ray diffractometer DRON-8 using CuKα (λ = 0.154 nm) radiation in the 2θ range from 10° to 80°, at 40 kV and 20 mA. Fourier Transform Infrared (FT-IR) spectra were recorded by a Nicolet Avatar 380 spectrometer. Raman spectroscopy was applied with a Teksan (Takram P50C0R10) with a DPSS Nd:YAG laser, laser wavelength = 532 nm, laser power = 100 mW, and spectral resolution of 10 cm−1. UV-vis diffuse reflectance spectra (UV-vis DRS) were accomplished with a Shimadzu instrument. The UV-vis spectra were obtained with a T80 UV-vis spectrometer PG Instrument to calculate the amount of degradation of organic pollutants. Field Emission Scanning Electron Microscopy (FE-SEM) images were taken with a MIRA3TESCAN-AMU at 3–30 kV voltage. The photoluminescence (PL) spectra were also analyzed with a Varian Cary Eclipse fluorescence spectrophotometer at an excitation wavelength of 315 nm.2.5. Photocatalytic activity
The photocatalytic activity was evaluated by measuring the decomposition rate of MB in an aqueous solution under light from a xenon lamp. The inside of the lamp housing system is covered with aluminum foil and consists of two xenon lamps of 100 W (λ > 400 nm), located at a distance of about 20 cm from each other. Also, there is a cooling system consisting of two fans and water circulation in the lamp housing. A picture of the lamp housing system is shown in Fig. S1.† The as-prepared powder (50 mg) was added to 50 ml of MB solution (20 ppm). After stirring for 30 min to complete the adsorption–desorption equilibrium in a dark environment, periodic sampling was undertaken during exposure to visible light at specific time intervals.3. Results and discussion
3.1. Phase characterization
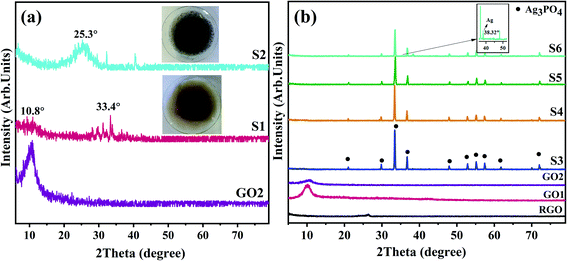
In Fig. 2a, the results of phase identification and the relative amount of GO2 reduction at two hydrothermal temperatures of 60 and 180 °C (RGO-60 and RGO-180) are compared. In Fig. 2b, the XRD patterns of the as-prepared samples by co-precipitation (S3 and S4) and hydrothermal–co-precipitation methods at 60 °C and 180 °C (S5 and S6) are shown. The Ag3PO4 phase is identified in all samples at 2θ of 21.1°, 30.0°, 30.5°, 36.8°, 38.4°, 48.0°, 52.9°, 55.3°, 57.5°, 61.9°, and 72.1°, which is consistent with previous research, according to JCPDS NO:06-0505.8,29,31,34,43 Regarding the accuracy of XRD analysis, the Ag peak was only detected in S6. However, no peaks belonging to G or GO phases were observed in S3, S4, S5, or S6. These observations can be justified by (i) the low weight percentage (% wt) of G(GO) and Ag, (ii) the increased interlayer distance between the graphene oxide sheets due to the intercalation of Ag3PO4 and Ag nanoparticles between the layers of G and GO, (iii) as well as the decrease in the amount of Ag nanoparticles.31 The crystallite size of Ag3PO4 was calculated with the Debye–Scherrer equation,44 using eqn (1).
L = 0.9λ/FWHM![[thin space (1/6-em)]](https://www.rsc.org/images/entities/char_2009.gif) cos cos![[thin space (1/6-em)]](https://www.rsc.org/images/entities/char_2009.gif) θ θ
| (1) |
3.2. Field emission scanning electron microscopy (FE-SEM)
FE-SEM was employed to investigate the particle distribution and morphology of the synthesized particles on the sheets in the as-prepared samples. In Fig. 3, FE-SEM images of (a) S3, (b) GO/RGO, (c and d) S4, (e and f) S5, and (g and h) S6 are highlighted. The particle size distributions of Ag3PO4 prepared without GO or RGO, shown in Fig. 3a, are in the range of 30–80 nm. Fig. 3b highlights the FE-SEM images of mixed and dispersed GO and RGO before the formation and decoration of Ag3PO4 (Ag), showing a layered structure of less than ∼10 nm thickness. A comparison between the composites prepared with co-precipitation (S4) and hydrothermal/co-precipitation/(60 and 180 °C) shows that a broader particle size distribution of Ag3PO4 (Ag) occurred in S4 and S5 compared to S6, which could originate from the presence of GO in the latter samples. However, Ag3PO4 nanoparticles with a particle size of less than 100 nm were detected in all as-prepared composites.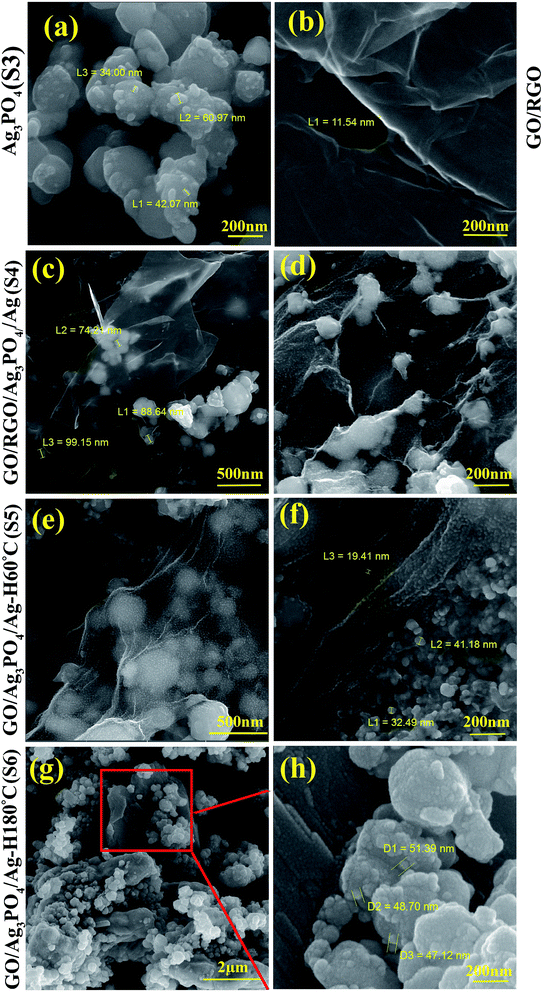 | ||
| Fig. 3 FE-SEM images of (a) S3, (b) GO/RGO at 150k× magnification, (c) and (d) S4 at 75 and 150k×, (e) and (f) S5 at 150k× and (g) and (h) S6 at 25 and 150k× magnification. | ||
The application of GO in the synthesis step (S4, S5, S6) promotes the controlled nucleation and growth of Ag3PO4. The complete reduction of GO in S6, caused by the higher temperature of the hydrothermal process, reduces the oxide and hydroxyl groups on the surface of GO (Fig. 2a), thus forcing the Ag ions to partially precipitate as Ag metallic particles on the surface of the graphene layers, as confirmed by the XRD results shown in Fig. 2b (S6). On the other hand, simultaneous restacking and agglomeration of the as-reduced RGO would take place in S6. In all four samples, the Ag ions in the solution would react with phosphate ions in the subsequent co-precipitation step to form Ag3PO4 nanoparticles. Although, in S4 and S5 samples, the formation of Ag3PO4 in the co-precipitation step would take place in a more homogenized manner due to the anchored Ag ions on the not-reduced GO surfaces.
3.3. Fourier-transform infrared spectroscopy (FT-IR)
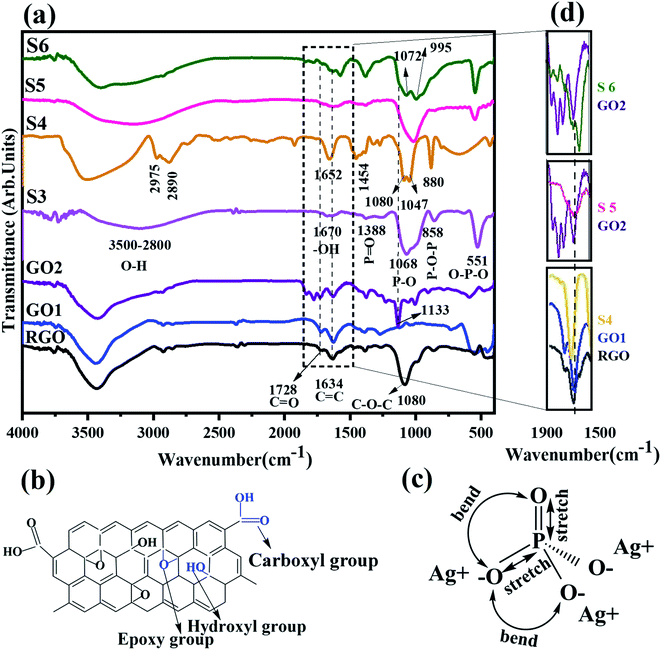
The characterization of functional groups and bands was carried out by FT-IR spectroscopy analysis. Fig. 4a shows the FTIR spectra of the as-prepared samples according to Table 2. FT-IR spectra of RGO, GO1, and GO2 show five main peaks at 3600–3400, 1080, 1133, 1634, and 1728 cm−1. A broad and strong peak at 3600–3300 cm−1 is ascribed to the O–H stretching vibration of the hydroxyl group,29,45 while 1080 and 1133 cm−1 display epoxy group stretching vibration in C–O–C (alkoxy or epoxy group) over the basal plane in RGO and GO2. The stretching vibration in C![[double bond, length as m-dash]](https://www.rsc.org/images/entities/char_e001.gif) C of the un-oxidized graphitic domain on the basal plane or of the graphene sheets and C
C of the un-oxidized graphitic domain on the basal plane or of the graphene sheets and C![[double bond, length as m-dash]](https://www.rsc.org/images/entities/char_e001.gif) O (COOH) in carbonyl groups on the edge of the graphene oxide sheets are displayed at 1634 cm−1 and 1728 cm−1,8,16,29,34,45,46 respectively. There are some sub-absorption peaks at the wavenumbers of 1278, 1388, 2377, and 2931 cm−1, which were ascribed to C–O–C, the bending vibration of O–H,8,16,46 CO2 (O–C
O (COOH) in carbonyl groups on the edge of the graphene oxide sheets are displayed at 1634 cm−1 and 1728 cm−1,8,16,29,34,45,46 respectively. There are some sub-absorption peaks at the wavenumbers of 1278, 1388, 2377, and 2931 cm−1, which were ascribed to C–O–C, the bending vibration of O–H,8,16,46 CO2 (O–C![[double bond, length as m-dash]](https://www.rsc.org/images/entities/char_e001.gif) O),16 and the stretching vibration of C–H, respectively. Fig. 4b shows the schematic structure of graphene (oxide) and related functional groups.
O),16 and the stretching vibration of C–H, respectively. Fig. 4b shows the schematic structure of graphene (oxide) and related functional groups.
The absorption bands at 540, 858, 1066, 1388, and 1670 cm−1 were assigned to bending of P![[double bond, length as m-dash]](https://www.rsc.org/images/entities/char_e001.gif) O–P, bending of P–O–P, stretching of P–O, stretching of P
O–P, bending of P–O–P, stretching of P–O, stretching of P![[double bond, length as m-dash]](https://www.rsc.org/images/entities/char_e001.gif) O (schematically shown in Fig. 4c)36 and –OH vibration on Ag3PO4, respectively.32,33 This –OH band is due to the physical absorption of water on pure Ag3PO4.7,33 In Fig. 4d, the selected parts of Fig. 4a at 1500–1900 cm−1 are redrawn according to the shift in the C
O (schematically shown in Fig. 4c)36 and –OH vibration on Ag3PO4, respectively.32,33 This –OH band is due to the physical absorption of water on pure Ag3PO4.7,33 In Fig. 4d, the selected parts of Fig. 4a at 1500–1900 cm−1 are redrawn according to the shift in the C![[double bond, length as m-dash]](https://www.rsc.org/images/entities/char_e001.gif) O bonding peak. The peak shift of C
O bonding peak. The peak shift of C![[double bond, length as m-dash]](https://www.rsc.org/images/entities/char_e001.gif) O in the S5 and S6 composites (hydrothermal method) relative to the initially applied graphene oxide towards a lower wavenumber confirms the charge interaction between rGO and Ag3PO4, which agrees well with previously reported work.8,29,30
O in the S5 and S6 composites (hydrothermal method) relative to the initially applied graphene oxide towards a lower wavenumber confirms the charge interaction between rGO and Ag3PO4, which agrees well with previously reported work.8,29,30
On the other hand, in S4, S5, and S6 composite samples, the C![[double bond, length as m-dash]](https://www.rsc.org/images/entities/char_e001.gif) O peak at 1728 cm−1 in graphene oxide samples disappears due to the progress of reduction in graphene oxide. The overlap of P–O (Ag3PO4) and C–O–C (GO) produces a branched peak in S4 and S6 at about 995–1072 cm−1 and 1047–1080 cm−1, respectively. The first and the second bands are attributed to P–O and C–O–C bands, respectively. This result confirms the formation of composites.25,32
O peak at 1728 cm−1 in graphene oxide samples disappears due to the progress of reduction in graphene oxide. The overlap of P–O (Ag3PO4) and C–O–C (GO) produces a branched peak in S4 and S6 at about 995–1072 cm−1 and 1047–1080 cm−1, respectively. The first and the second bands are attributed to P–O and C–O–C bands, respectively. This result confirms the formation of composites.25,32
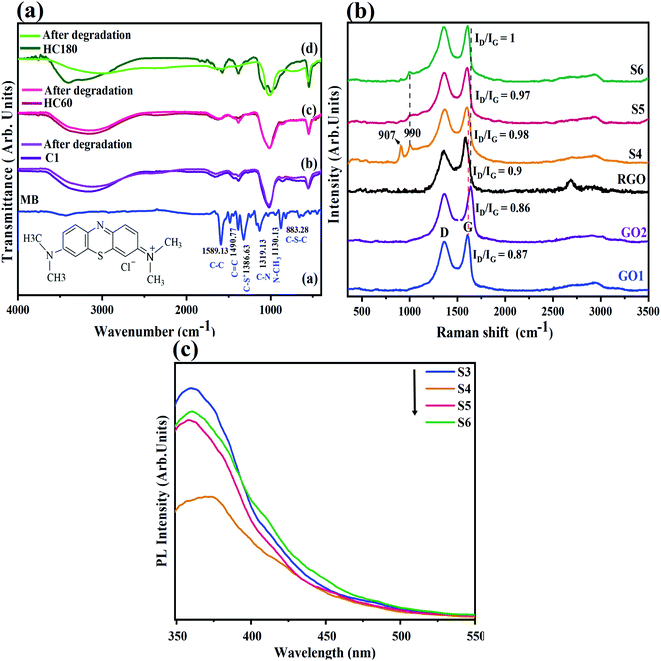
In order to verify the stability of the photocatalytic process in pure Ag3PO4 as well as the composites before and after degradation of MB, the related FT-IR spectra are compared in Fig. 5a. The results indicate that the samples remained unchanged after the photocatalytic activity in S5 and S3, while in S6, the structure changed after the photocatalytic process.
3.4. Raman spectroscopy
Raman spectroscopy is one of the most critical methods for studying carbon materials such as graphite, graphene, etc. Fig. 5b shows Raman spectra of GO1, GO2, RGO, S4, S5, and S6 powders. In graphene structures, two peaks nominated as the D-band (attributed to the disorder-induced phonon mode of the vibrations of sp3 atoms of carbon) and G-band (related to the first-order scattering of the E2g mode in the sp2 carbon lattice in the graphitic domains) are the most dominant. The G-bands in GO1 and GO2 are located at 1608 cm−1 and 1630 cm−1, respectively. The G-band in GO2 is shifted toward a higher wavenumber, which can be interpreted by the higher degree of oxidation in this sample,47 consistent with the FTIR results in Fig. 4a. There was no significant change in the D-band position. Generally, the D to G-band (ID/IG) intensity ratio can determine the defects and disorder in graphene sheets. In GO1 and GO2, ID/IG is 0.87 and 0.86, respectively, which reflects a minor improvement in the reduction step, which is observed in mainly sp2 amorphous carbon materials.47,48 This ratio increases in all composites (0.98, 0.97, and 1 in S4, S5, and S6, respectively). The increase in disorder arises from decorating of Ag3PO4 on the GO and RGO sheets.8,30 By comparing the ID/IG of the composites, the highest value was found in S6 while the lowest value was measured in the S5 sample, which is related to the lower degree of reduction in S5, as shown in the XRD patterns in Fig. 2a. This result also implies the partial reduction of GO at 60 °C. The G-bands in S4, S5, and S6 found at ca. 1597, 1603, and 1603 cm−1 reflect a red-shift compared to the primary graphene oxides that emerge from the interaction between GO and Ag/Ag3PO4, where the latter species donate electrons while the GO sheets accept electrons.30,49 It is worth noting that the bands centered at 990 and 903 cm−1 correspond to the asymmetric stretching vibration of P–O–P bonding.503.5. Photoluminescence (PL)
One of the considerable and effective challenges for photocatalytic activity is to conserve charge separation. The luminescence spectra of the as-prepared samples are given in Fig. 5c under an excitation wavelength of 315 nm. This wavelength has already been suggested to excite electrons.25 The lower luminescence intensity implies a lower recombination rate of electron–hole pairs and a prior photocatalytic activity. The luminescence intensity is due to the return of electrons from the conduction band to the valence band and recombination with holes after electron excitation by the light. The PL emission intensity is reduced, where S4 < S5 < S6 < S3. The lower intensity in the S4 and S5 samples is probably due to the simultaneous presence of RGO and GO in the as-prepared structures.The charge transfer followed by the reduced recombination would be improved with silver on partial RGO structures,8 because the Ag nanoparticles are well dispersed on the GO substrates and, at the same time, conductive dispersed RGO would increase the charge transfer and prevent the electron–hole recombination.
3.6. UV-vis DRS analysis
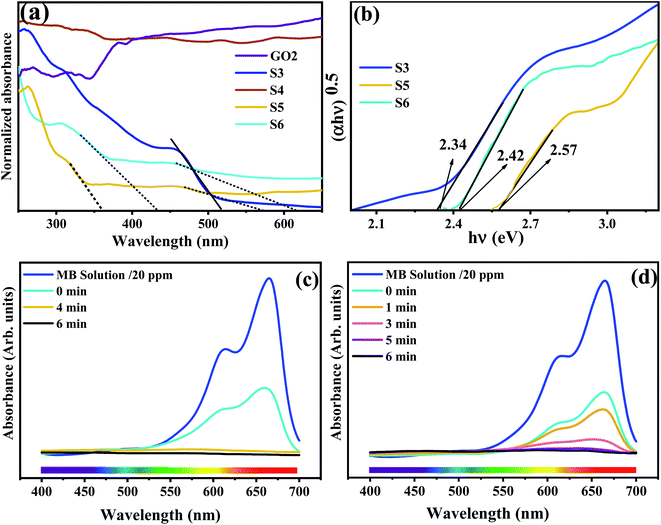
As reported, the optical property of the semiconductor is the crucial factor that determines the photocatalytic performance. The UV-Vis DRS diagrams of GO2, S3, S4, S5, and S6 dried powder are shown in Fig. 6a. The absorbance wavelength in S3 (Ag3PO4) is about 520 nm. With regard to the S5 and S6 samples, two absorbance wavelengths can be seen. In S5, there are two peaks at about 360 in the UV and visible light range, respectively. However, the distinguished absorbance wavelengths in S6, similar to S5, exist in 430 and continuous absorption in 520–700 nm. It seems that the absorbance in these two samples is more substantial (500–700 nm) than for S3 due to the presence of RGO or the simultaneous presence of GO and RGO, as previously reported.8,31,43 However, high absorption in a broad band is a typical feature of carbon-based composites. Estimations of band gap energy (Eg) reported for S3, S5, and S6 are shown in Fig. 6b. The semiconductor band gap can be obtained from the Kubelka–Munk function, using eqn (2).| (αhν) = A(hν − Eg)n | (2) |
3.7. Photocatalytic performance
The effect of RGO and GO on the photocatalytic activity of Ag3PO4 in S3, S4, S5, and S6 was evaluated. Fig. 6c and d represent the absorption spectra of MB in S3 and S6. However, the photocatalytic activity of S4 cannot be scanned because of the very rapid and high absorption of MB on the surface of this sample so that no real degradation took place due to the electron–hole generation by photocatalysts. Therefore, degradation under exposure to light is impossible, although the change in the color from green to black confirms the degradation of MB (Fig. S2†). Strong adsorption of cationic dye MB in S3 under dark conditions can be related to positive–negative charge attraction between the Ag3PO4 surface and MB molecules, respectively, due to the presence of oxygen vacancies.54,55In all cases, absorption and degradation took less than 5 min.
The percentage of decolorization of MB was calculated using eqn (3).
| η (%) = (C0 − Ct)/C0 × 100 | (3) |
3.8. Proposed mechanism
A possible degradation mechanism based upon the above experimental discussion is proposed in Fig. 7. When the RGO/GO/Ag3PO4/Ag photocatalyst was exposed to irradiation from xenon lamp light, charge carriers (e−/h+) were photogenerated. The electrons in the VB were photoexcited to the CB in the two semiconductors present: Ag3PO4 and GO, while the holes remained in the VB. The e−/h+ can transfer to the surface to be involved in the degradation process. However, not all the e−/h+ can move to the surface and some of them are recombined in the bulk of the semiconductors. When e−/h+ reach the surface, they may be recombined. The conductive Ag nanoparticles and RGO nanosheets, as a mediator, can play an intensely critical role in decreasing the recombination process. Then, transferred e−/h+ participate in the oxidation and reduction process with regard to the MB degradation. Under irradiation, the e−/h+ can react at the interface with water and oxygen to produce reactive oxygen species such as hydroxyl radicals (˙OH) and superoxide radical anions (O2−) through oxidation or reduction reactions, respectively.12,43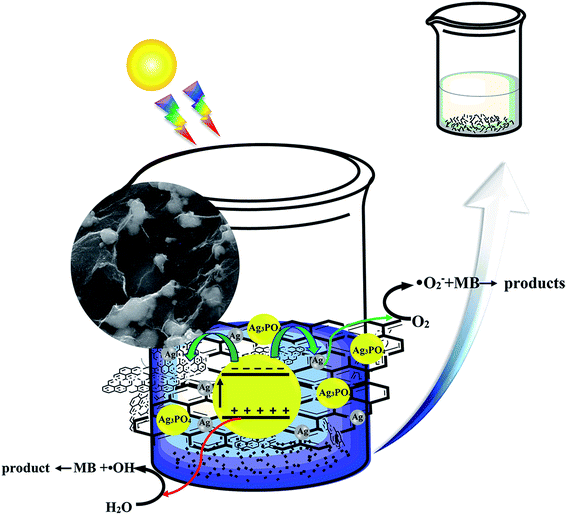 | ||
| Fig. 7 Schematic of the proposed photocatalysis and degradation mechanism of MB on the surface of the composites (RGO/GO/Ag3PO4/Ag). | ||
3.9. Coral coating with photocatalytic suspension
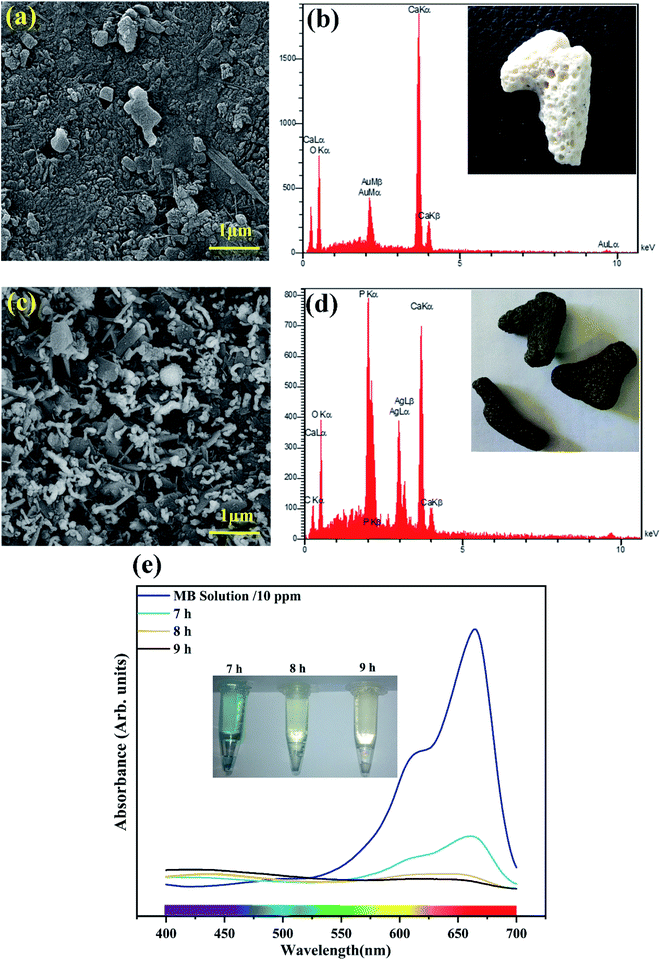
According to the FE-SEM results in Fig. 8a and c, related to uncoated and coated coral, respectively, worm-shaped particles of silver phosphates are uniformly formed in situ. The presence of Ag and P elements in Fig. 8d confirms that the formed particles contain A and P-based composition(s).In Fig. 8e, UV-vis absorption spectra of MB on the coated coral with photocatalytic suspension are shown. The trend of reduced intensities over time displays the degradation of MB, like that mentioned before on prepared powder, confirming the conserved photocatalytic effect in in situ synthesized Ag3PO4–RG coatings. Interestingly, the coral coated with photocatalytic composite degrades MB in natural light (indirect radiation by sunlight) in about 9 h (Fig. 8e), unlike the other samples analyzed in xenon light. It is worth noting that exposure to direct sunlight probably reduces the time for removal.
The yield of Ag3PO4 QD/RGO to degrade 100 ml MB solution (10 ppm) was reported to be 97.46% for 5 min,29 while in this work, the simultaneous presence of Ag3PO4 and GO would increase the efficiency of the photocatalyst by nearly 2% under similar conditions. Here, the volume and concentration of the solution used are 50 ml and 20 ppm, respectively. The partial presence of GO and RGO as the substrate for the Ag3PO4 and Ag particles with regard to the Z-scheme mechanism is proposed to be the reason for the improved performance. This composite shows the potential of an in situ preparation as a coating on the dead coral structures.
Investigation on the photocatalytic results of the silver–graphene-based composites shows that the proposed composites present prior photocatalytic activity compared to other similar structures. Cui et al. synthesized a comparable Ag3PO4/RGO/Ag composite, in which Rhodamine B degrades in 30 min.8 Degradation of MB by unknown concentration was reported to be 96.8% in 15 min using Ag3PO4/PDA (polydopamine)/RGO.41 The Ag3PO4/GO photocatalytic composite powder prepared by the co-precipitation method was reported to degrade about 98% of Rhodamine B in 40 min;34 however, in this work, the GO/RGO/Ag3PO4 composite can degrade three times more concentrated MB in a shorter time (about 5 min).
4. Conclusion
In summary, we have successfully synthesized Ag3PO4 and Ag-decorated RGO and GO/RGO photocatalysts. The obtained RGO/GO/Ag3PO4/Ag nanocomposites exhibited improved degradation of MB compared with RGO/Ag3PO4/Ag under simulated solar light irradiation. The enhancement in photocatalytic activity on GO/RGO compared to GO can be attributed to the high surface area of the composites and the effective transfer and separation of photogenerated electrons and holes by the GO nanosheets. We also showed that RGO and GO in GO/RGO/Ag3PO4/Ag would increase the photocatalyst efficiency. In this work, we have tried to modify the composition of a graphene–silver-based structure based on the Z-scheme mechanism while maintaining the high surface area for the uniform deposition of silver-based particles to improve the MB degradation by the photocatalyst in visible light. However, this modified structure can be synthesized in situ on dead coral structures that can be used in future real case-studies in the degradation of other organic pollutants.Conflicts of interest
There are no conflicts to declare.References
- B. Liu, Y. Fang, Z. Li and S. Xu, J. Nanosci. Nanotechnol., 2015, 15, 889–920 CrossRef CAS PubMed.
- M. Taghdiri, Int. J. Photoenergy, 2017, 2017, 8575096 CrossRef.
- V. Etacheri, C. Di Valentin, J. Schneider, D. Bahnemann and S. C. Pillai, J. Photochem. Photobiol., C, 2015, 25, 1–29 CrossRef CAS.
- J. Adusei-Gyamfi, B. Ouddane, L. Rietveld, J.-P. Cornard and J. Criquet, Water Res., 2019, 160, 130–147 CrossRef CAS PubMed.
- M. Lu, Photocatalysis and water purification: from fundamentals to recent applications, John Wiley & Sons, 2013 Search PubMed.
- A. Houas, H. Lachheb, M. Ksibi, E. Elaloui, C. Guillard and J.-M. Herrmann, Appl. Catal., B, 2001, 31, 145–157 CrossRef CAS.
- R. Dhanabal, A. Chithambararaj, S. Velmathi and A. C. Bose, J. Environ. Chem. Eng., 2015, 3, 1872–1881 CrossRef CAS.
- C. Cui, Y. Wang, D. Liang, W. Cui, H. Hu, B. Lu, S. Xu, X. Li, C. Wang and Y. Yang, Appl. Catal., B, 2014, 158, 150–160 CrossRef.
- J. Wen, J. Xie, X. Chen and X. Li, Appl. Surf. Sci., 2017, 391, 72–123 CrossRef CAS.
- C. A. Martinez-Huitle, M. A. Rodrigo, I. Sires and O. Scialdone, Chem. Rev., 2015, 115, 13362–13407 CrossRef CAS PubMed.
- R. Andreozzi, V. Caprio, A. Insola and R. Marotta, Catal. Today, 1999, 53, 51–59 CrossRef CAS.
- X. Li, R. Shen, S. Ma, X. Chen and J. Xie, Appl. Surf. Sci., 2018, 430, 53–107 CrossRef CAS.
- D. Xu, S. Cao, J. Zhang, B. Cheng and J. Yu, Beilstein J. Nanotechnol., 2014, 5, 658–666 CrossRef CAS PubMed.
- Q. Xu, L. Zhang, J. Yu, S. Wageh, A. A. Al-Ghamdi and M. Jaroniec, Mater. Today, 2018, 21, 1042–1063 CrossRef CAS.
- F. Kusmartsev, W. Wu, M. Pierpoint and K. Yung, Application of graphene within optoelectronic devices and transistors, ed. P. Misra, Springer, 2015, pp. 191–221 Search PubMed.
- C.-M. Chen, Surface chemistry and macroscopic assembly of graphene for application in energy storage, Springer, Berlin, Heidelberg, 2015 Search PubMed.
- J. Zhao, L. Liu and F. Li, Graphene oxide: physics and applications, Springer, Verlag, Berlin, Heidelberg, 2015 Search PubMed.
- H. Heo, S. Lee and S. Kim, Carbon, 2019, 154, 42–47 CrossRef CAS.
- Y. Fan, C. Guo, Z. Zhu, W. Xu, F. Wu, X. Yuan and S. Qin, Sci. Rep., 2018, 8, 1–8 Search PubMed.
- F. Xia, H. Wang, D. Xiao, M. Dubey and A. Ramasubramaniam, Nat. Photonics, 2014, 8, 899–907 CrossRef CAS.
- M. Inagaki and F. Kang, J. Mater. Chem. A, 2014, 2, 13193–13206 RSC.
- J. Guerrero-Contreras and F. Caballero-Briones, Mater. Chem. Phys., 2015, 153, 209–220 CrossRef CAS.
- S. Syama and P. Mohanan, Nano-Micro Lett., 2019, 11, 6 CrossRef CAS.
- M. Griffith, K. Udekwu, S. Gkotzis, T. Mah and E. Alarcon, Silver nanoparticle applications: In the fabrication and design of medical and biosensing devices, Springer, Switzerland, 2015 Search PubMed.
- A. Samal, D. Das, K. Nanda, B. Mishra, J. Das and A. Dash, Chem.–Asian J., 2016, 11, 584–595 CrossRef CAS PubMed.
- S. Song, B. Cheng, N. Wu, A. Meng, S. Cao and J. Yu, Appl. Catal., B, 2016, 181, 71–78 CrossRef CAS.
- Y. Wan, C. Liang, Y. Xia, W. Huang and Z. Li, Appl. Surf. Sci., 2017, 396, 48–57 CrossRef CAS.
- Z. Yi, J. Ye, N. Kikugawa, T. Kako, S. Ouyang, H. Stuart-Williams, H. Yang, J. Cao, W. Luo and Z. Li, Nat. Mater., 2010, 9, 559–564 CrossRef CAS PubMed.
- A. Reheman, Y. Tursun, T. Dilinuer, M. Halidan, K. Kadeer and A. Abulizi, Nanoscale Res. Lett., 2018, 13, 70 CrossRef PubMed.
- M. Zhu, P. Chen and M. Liu, Chin. Sci. Bull., 2013, 58, 84–91 CrossRef CAS.
- R. Jiang, H. Y. Zhu, J. B. Li, F. Q. Fu, J. Yao, X. X. Liang, R. Q. Guo and G. M. Zeng, J. Iran. Chem. Soc., 2016, 13, 1167–1174 CrossRef CAS.
- L. Wang and Y. Zhou, Fullerenes, Nanotubes, Carbon Nanostruct., 2016, 24, 588–593 CrossRef CAS.
- S. Krungchanuchat, N. Ekthammathat, A. Phuruangrat, S. Thongtem and T. Thongtem, Mater. Lett., 2017, 201, 58–61 CrossRef CAS.
- R. Liu, H. Li, L. Duan, H. Shen, Q. Zhang and X. Zhao, Appl. Surf. Sci., 2018, 462, 263–269 CrossRef CAS.
- C. S. Tseng, T. Wu and Y. W. Lin, Materials, 2018, 11, 708 CrossRef PubMed.
- W. Zhang, L. Zhou, J. Shi and H. Deng, Catalysts, 2018, 8, 45 CrossRef.
- J. Zwara, E. Grabowska, T. Klimczuk, W. Lisowski and A. Zaleska-Medynska, J. Photochem. Photobiol., A, 2018, 367, 240–252 CrossRef CAS.
- M. Deng and Y. Huang, Ceram. Int., 2020, 46, 2565–2570 CrossRef CAS.
- X. Hu, Q. Zhu, X. Wang, N. Kawazoe and Y. Yang, J. Mater. Chem. A, 2015, 3, 17858–17865 RSC.
- J. Niu, Z. Zhang, K. Wang, W. Shi and X. Yu, IOP Conf. Ser.: Earth Environ. Sci., 2019, 344, 012069 CrossRef.
- R. Zhang, T. Zhang, Y. Cai, X. Zhu, Q. Han, Y. Li and Y. Liu, J. Inorg. Organomet. Polym. Mater., 2020, 30, 543–553 CrossRef CAS.
- T. Nematian, A. Shakeri, Z. Salehi and A. A. Saboury, Biotechnol. Biofuels, 2020, 13, 1–15 CrossRef PubMed.
- L.-L. Qu, N. Wang, Y.-Y. Li, D.-D. Bao, G.-H. Yang and H.-T. Li, J. Mater. Sci., 2017, 52, 8311–8320 CrossRef CAS.
- A. Monshi, M. R. Foroughi and M. R. Monshi, World J. Nano Sci. Eng., 2012, 2, 154–160 CrossRef.
- G. Pavoski, T. Maraschin, F. d. C. Fim, N. M. Balzaretti, G. B. Galland, C. S. Moura and N. R. d. S. Basso, Mater. Res., 2017, 20, 53–61 CrossRef CAS.
- T. Parandhaman and S. K. Das, Biomater. Sci., 2018, 6, 3356–3372 RSC.
- K. Krishnamoorthy, M. Veerapandian, K. Yun and S.-J. Kim, Carbon, 2013, 53, 38–49 CrossRef CAS.
- I. Childres, L. A. Jauregui, W. Park, H. Cao and Y. P. Chen, New Dev. Photon Mater. Res., 2013, 1, 1–20 CrossRef.
- M. Zhu, P. Chen and M. Liu, ACS Nano, 2011, 5, 4529–4536 CrossRef CAS PubMed.
- G. Botelho, J. C. Sczancoski, J. Andres, L. Gracia and E. Longo, J. Phys. Chem. C, 2015, 119, 6293–6306 CrossRef CAS.
- X. Guan, J. Shi and L. Guo, Int. J. Hydrogen Energy, 2013, 38, 11870–11877 CrossRef CAS.
- A. Escobedo-Morales, I. Ruiz-López, M. d. Ruiz-Peralta, L. Tepech-Carrillo, M. Sánchez-Cantú and J. Moreno-Orea, Heliyon, 2019, 5, e01505 CrossRef CAS PubMed.
- P. Sehrawat, S. Islam, P. Mishra and S. Ahmad, Sci. Rep., 2018, 8, 1–13 Search PubMed.
- X. Liu, J. Xu, Z. Ni, R. Wang, J. You and R. Guo, Chem. Eng. J., 2019, 356, 22–33 CrossRef CAS.
- M. Al Kausor, S. S. Gupta and D. Chakrabortty, J. Saudi Chem. Soc., 2020, 24, 20–41 CrossRef CAS.
Footnote |
| † Electronic supplementary information (ESI) available. See DOI: 10.1039/d1ra01239h |
| This journal is © The Royal Society of Chemistry 2021 |

