
 Open Access Article
 This Open Access Article is licensed under a Creative Commons Attribution-Non Commercial 3.0 Unported Licence
An electrochemical platform based on a hemin–rGO–cMWCNTs modified aptasensor for sensitive detection of kanamycin†
Tianyi Gaoa,
Chong Sunb,
Nana Zhangb,
Yang Huangb,
Hongxing Zhub,
Chunmei Wangd,
Jinxuan Cao*a and
Daoying Wang *bc
*bc
aKey Laboratory of Animal Protein Food Processing Technology of Zhejiang Province, Ningbo University, Ningbo 315211, P. R. China. E-mail: caojinxuan@nbu.edu.cn
bInstitute of Agricultural Products Processing, Jiangsu Academy of Agricultural Sciences, Nanjing 210014, P. R. China. E-mail: daoyingwang@yahoo.com
cJiangsu Key Laboratory for Food Quality and Safety-State Key Laboratory Cultivation Base, Ministry of Science and Technology, Nanjing, Jiangsu 210014, China
dCentral Laboratory, Jiangsu Academy of Agricultural Sciences, Nanjing 210014, P. R. China
First published on 28th April 2021
Abstract
Kanamycin (KANA) residue in meat is particularly harmful to public health and there is an urgent need to establish a fast, accurate and low-cost method to determinate KANA in food quality control. In this paper, hemin–reduced graphene oxide-carboxylated multiwalled carbon nanotubes (hemin–rGO–cMWCNTs) were designed and prepared, and the characteristics of hemin–rGO–cMWCNTs are presented. After that, an aptamer/hemin–rGO–cMWCNTs sensor for determination of KANA was developed. The electrochemical characteristics were studied by cyclic voltammetry (CV), differential pulse voltammetry (DPV) and electrochemical impedance spectroscopy (EIS). Under optimal conditions, the sensitive response of the aptasensor towards KANA presented a wide concentration range of 10−9 to 10−6 M and a low detection limit of 0.36 nM (S/N = 3). Meanwhile, the aptasensor showed prominent selectivity, high stability and acceptable reproducibility in the application of KANA detection. In addition, the aptasensor detection in real samples correlated well with that obtained by liquid chromatograph mass spectrometer (LCMS).
1. Introduction
Kanamycin (KANA), an amino sugar antibiotic, is isolated from Streptomyces kanamyceticus.1 It is well known for its outstanding activity against a wide variety of pathogenic bacteria and low delayed toxicity.2 Nowadays, KANA has been widely used as a veterinary medicine in animal husbandry.3 However, the overuse of KANA contributes to the residue in animal-husbandry products and transfers into the food chain. KANA residue in meat products is particularly harmful to public health such as nephrotoxicity, ototoxicity, tinnitus and respiratory failure.4,5 Therefore, the specific recognition and quantitative detection of KANA are extremely important in meat quality and safety.Aptamers are oligonucleotides obtained by an in vitro selection process, which can be used to recognize targets like small molecules or organisms.6 Aptamers have several advantages such as relative ease of isolation and modification, tailored binding affinity and resistance against denaturizing.7,8 Consequently, by incorporating these aptamers into sensors, it is facile for aptamers to convert bio-recognition events into physically detectable electrochemical signals. At present, aptamer-based electrochemistry platform has been considered as prospective technique for rapid and sensitive detections.
In recent years, a large number of strategies have been developed for the detection of KANA such as fluorescence,9 colorimetry,10 high performance liquid chromatography,11 enzyme-linked immunosorbent assay method12 and so on. However, these methods have been faulted for time-consuming, professional operator and expensive equipment. Accordingly, it needs to develop a quick and easy detection method. Electrochemical sensors show promising performance for point-of-care due to low cost, label-free operation and ease of miniaturization for detecting tools. In this article, hemin–rGO–cMWCNTs, an aptamer carrier material with good conductivity and biocompatibility, was proposed and an aptamer-assisted amplification method for sensitive detection of KANA based on hemin–rGO–cMWCNTs was established.
Hemin, named as iron protoporphyrin IX, has been widely used in biosensor because of its cheap, the ability to catalyze the reduction reactions and strong adsorption on the carbon glass electrode (GCEs).12,13 Moreover, hemin could corporate into the binding event of aptamers, which could be used as amplifying labels for aptasensors.14 However, the application of hemin was a challenging work due to its molecular aggregation in aqueous solution.15 Herein, hemin was usually anchored on carbon or metal materials. rGO was added to provide a stable platform which prevented the accumulation of hemin. Hemin-functionalized reduced graphene oxide (hemin–rGO) was obtained by π–π interactions between rGO and hemin.16,17 In order to achieve better conductivity and more binding sites, cMWCNTs were doped into hemin–rGO.18 According to this strategy, hemin–rGO–cMWCNTs, an aptamer carrier material with good conductivity and biocompatibility, was prepared and modified on the electrochemistry sensor. Results showed that this novel sensor by molecularly grafting KANA aptamer can be used for accurate quantification of the concentration of KANA in meat sample. The prepared sensor provided a precise, convenient, sensitive and specific method for KANA detection, which could be an accurate technique in food control.
2. Experiment
2.1. Materials
Graphene oxide (GO) and carboxylated multiwalled carbon nanotubes (cMWCNTs) were purchased from Xianfeng Materials Technology Co., Ltd (Nanjing, China). KANA aptamer with a sequence of 5′-AGATGGGGGTTGAGGCTAAGCCGA-3′ was prepared by Shanghai Sangon Biotechnology Co., Ltd.19 (Shanghai, China). Disodium hydrogen phosphate dodecahydrate (Na2HPO4·12H2O), N-hydroxysuccinimide (NHS), 1-ethyl-3-(3-dimethyl aminopropyl)-carbodiimide (EDC), potassium dihydrogen phosphate (KH2PO4), ammonia (NH3·H2O), hydrazine hydrate (N2H4·H2O), hydrochloric acid (HCl), potassium chloride (KCl), nitric acid (HNO3) and sodium hydroxide (NaOH) were obtained from Guoyao Group Reagent Co., Ltd (China). Tetracycline (TET), oxytetracycline (OTC), chloramphenicol (CAP), chlortetracycline (CTC) and sulfadiazine (SDZ) were purchased from Aladdin Reagent Co., Ltd (Shanghai, China). Hemin was purchased from Yuanye Biological Co., Ltd (Shanghai, China). Dimethyl sulfoxide (DMSO) and 3-[4,5-dimethyl thiazolyl-2]-2,5-diphenyltetrazolium bromide (MTT) were obtained from Sigma Reagent Co., Ltd (USA). Hemin was biochemical reagent and other chemicals were analytical grade. All chemicals were used as received.2.2. Instrument
The morphologies of rGO, hemin–rGO and hemin–rGO–cMWCNTs was characterized by transmission electron microscopy (TEM) that carried out with HITACHI H-7650 (Hitachi, Japan). Specimens for inspection were prepared on a 200 mesh copper grid by slowly evaporating one drop of prepared solutions covered by a carbon-supported film at room temperature. Scanning Electron Microscopy (SEM) was also used to characterize the morphologies of the materials. The SEM micrographs were collected under high vacuum with an accelerating voltage of 10 kV using an EVO-LS10 SEM (Zeiss, Germany). All substrates were treated by the same modification process on glass slide and were fixed on the disks. The disks were rinsed, air-dried, coated with gold, and then the surface was investigated by SEM. FTIR and UV-vis were used to characterize the successful synthesis of the hemin–rGO–cMWCNTs. The FTIR spectra of rGO, hemin–rGO and hemin–rGO–cMWCNTs were measured using a Cary 5000 Fourier transform infrared spectrophotometer (VARIAN Cary 5000, USA) with an optical fiber in the range from 500 to 4000 cm−1. UV-vis absorbances spectrometric were collected using a UV-visible spectrophotometer (Cary 50 Conc, Australia) with a slit width of 2.0 nm.2.3. Preparation of the hemin–rGO–cMWCNTs
The hemin–rGO was prepared by one-step synthesis process.20 50.0 mg of GO and 50.0 mg of hemin were mixed in 20.0 mL of deionized water and sonicated for 1 h. Then, NH3·H2O and N2H4·H2O were added, and the mixture was heated under refluxing at 60 °C for 3.5 h. The obtained solution was filtered (φ = 0.22 μm) and continuously washed with deionized water until the filtrate was neutral. After dried, the hemin–rGO was obtained.cMWCNTs was prepared by acid treatment. 1.0 g of MWCNTs was dissolved in 30.0 mL of 65% concentrated nitric acid and sonicated for 30 min. After that, the mixed solution was heated and refluxed at 90 °C for 24 h. Then, the mixture was continuously washed until neutral and dried at 60 °C to obtain cMWCNTs.
The hemin–rGO–cMWCNTs was obtained by mixing hemin–rGO and cMWCNTs. The mixed solution was heated at 60 °C for 1.0 h under stirring. Ultimately, the obtained hemin–rGO–cMWCNTs solution was used for characterization and detection.
2.4. Biocompatibility evalution of hemin–rGO–cMWCNTs
Circular dichroism (CD) spectra in the far-UV (with the range from 190 to 250 nm) were measured on a JASCO J-7100 spectropolarimeter using a 1 mm quartz cuvette. All samples at a final concentration of 50 μM were dissolved in 0.10 M PBS (pH 6.0). Cytotoxicity of the hemin–rGO–cMWCNTs were evaluated by MTT assays. Briefly, HeLa cells were seeded to a 96-well culture plate and the cells would come to about 50% confluence after 24 h of culture. The media were changed by fresh ones, and different concentration of samples were added to the wells. The cells of positive control were only incubated with PBS and the cell viability was set as 100%. All of the cells were allowed to grow for 24 h before 10 mL MTT (5 mg mL−1) was added to each well. Then, the cells were incubated at 37 °C for an additional 4 h until the purple precipitates were visible. The medium was replaced by 100 mL DMSO and the cell plate was vibrated for 15 min at room temperature to dissolve the crystals formed by the living cells. Finally, the absorption at 490 nm of each well was measured by an ultramicroplate reader.2.5. Preparation of the aptamer/hemin–rGO–cMWCNTs/GCE and electrochemical measurement
GCEs were polished with 0.3 and 0.05 μm alumina slurry and sonicated in ethanol and deionized water for 5 min at room temperature. After that, GCEs were dried under nitrogen gas. The modified process of the electrodes was shown in Scheme 1. 7.0 μL of the hemin–rGO–cMWCNTs was dropped on GCEs and dried naturally. 40.0 μL of EDC/NHS solution (1![[thin space (1/6-em)]](https://www.rsc.org/images/entities/char_2009.gif) :1, 10 mM) was used to activate the carboxyl group of hemin–rGO–cMWCNTs. Then, 5 μL of KANA aptamer (1.0 μM) was immobilized on the surface of hemin–rGO–cMWCNTs/GCE by carboxamide bond. After dried in air, the aptamer/hemin–rGO–cMWCNTs/GCEs were achieved.
:1, 10 mM) was used to activate the carboxyl group of hemin–rGO–cMWCNTs. Then, 5 μL of KANA aptamer (1.0 μM) was immobilized on the surface of hemin–rGO–cMWCNTs/GCE by carboxamide bond. After dried in air, the aptamer/hemin–rGO–cMWCNTs/GCEs were achieved.
 | ||
| Scheme 1 The schematic diagram of the construction of the KANA/aptamer/hemin–rGO–cMWCNTs/GCE for the detection of KANA. | ||
Cyclic Voltammetry (CV), and differential pulse voltammetry (DPV) and electrochemical impedance spectroscopy (EIS) were operated on Chenhua CHI760 workstation (China) by using the traditional three-electrode system with modified GCE as working electrode, a platinum wire as the auxiliary electrode and a saturated calomel electrode as reference electrode. CV was performed at 100 mV s−1 and the potential window was set from 0.2 V to −0.1 V in 0.1 M PBS (pH 6.0). DPV tests were performed in the voltage ranging from −0.55 to −0.15 V in 0.1 M PBS (pH 6.0). EIS parameters were set as follows: the frequency ranging from 1 Hz to 100 kHz with 5 mV AC amplitude in 0.1 M PBS (pH 6.0).
2.6. Preparation and detection of real samples
Chicken meat was purchased from local supermarket. 1.0 g of the meat sample was homogenized in 10 mL 0.1 M phosphate buffer solution (pH 6.0) and centrifuged at 6000 rpm for 60 s. Then, the supernatant was collected for detection. KANA standard solution was added to the supernatant for the recovery rate experiment.3. Results and discussion
3.1. Characterization of hemin–rGO–cMWCNTs
TEM was used to characterize the morphology of the materials. Fig. 1A–C showed the TEM images of rGO, hemin–rGO, and hemin–rGO–cMWCNTs. It was clear that rGO retained a two-dimensional transparent sheet structure with wrinkles (Fig. 1A) and hemin was evenly dispersed on the surface of rGO (Fig. 1B).21 As shown in Fig. 1C, the cMWCNTs were clearly doped with hemin–rGO. And hemin was covered by cMWCNTs, attributed to the massive addition of cMWCNTs.22 Similarly, the SEM results essentially in agreement with TEM (Fig. 1D–F). FTIR spectroscopy and UV-vis spectroscopy were performed to confirm the successful synthesis of the hemin–rGO–cMWCNTs.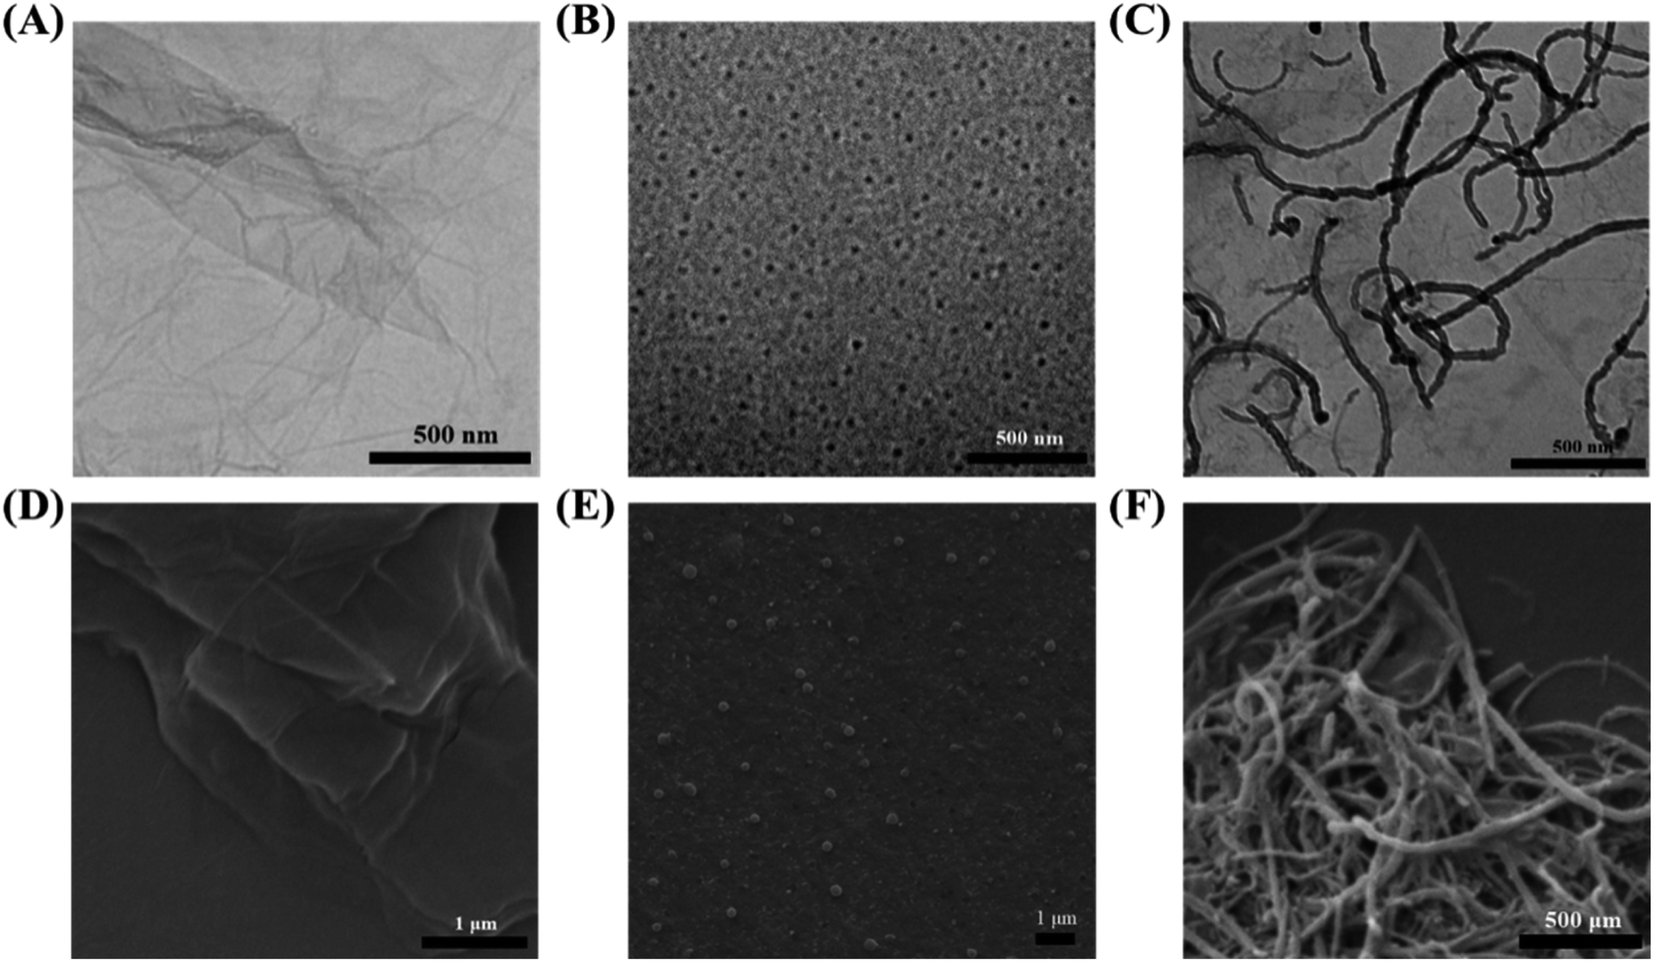 | ||
| Fig. 1 The TEM images of different material: (A) rGO, (B) hemin–rGO, (C) hemin–rGO–cMWCNTs. The SEM images of different material: (D) rGO, (E) hemin–rGO, (F) hemin–rGO–cMWCNTs. | ||
Fig. 2A showed the FTIR spectroscopy of hemin (curve a), hemin–rGO (curve b) and hemin–rGO–cMWCNTs (curve c). As shown in curve a, the peaks at 1710 cm−1 and 2924 cm−1 originated from C![[double bond, length as m-dash]](https://www.rsc.org/images/entities/char_e001.gif) O and C–H, the absorption band at 849 cm−1 was attributed to the C–H bending vibration.23 Compared with characteristic peaks of rGO, the peak was assigned to telescopic vibration of O–H and C–H,24 respectively. Meanwhile, the hemin–rGO (curve b) retained the characteristic peak of hemin. In the spectrum of hemin–rGO–cMWCNTs (curve c), the characteristic peaks at 3430 cm−1 and 1630 cm−1 enhanced, which indicated the successful preparation of hemin–rGO–cMWCNTs.
O and C–H, the absorption band at 849 cm−1 was attributed to the C–H bending vibration.23 Compared with characteristic peaks of rGO, the peak was assigned to telescopic vibration of O–H and C–H,24 respectively. Meanwhile, the hemin–rGO (curve b) retained the characteristic peak of hemin. In the spectrum of hemin–rGO–cMWCNTs (curve c), the characteristic peaks at 3430 cm−1 and 1630 cm−1 enhanced, which indicated the successful preparation of hemin–rGO–cMWCNTs.
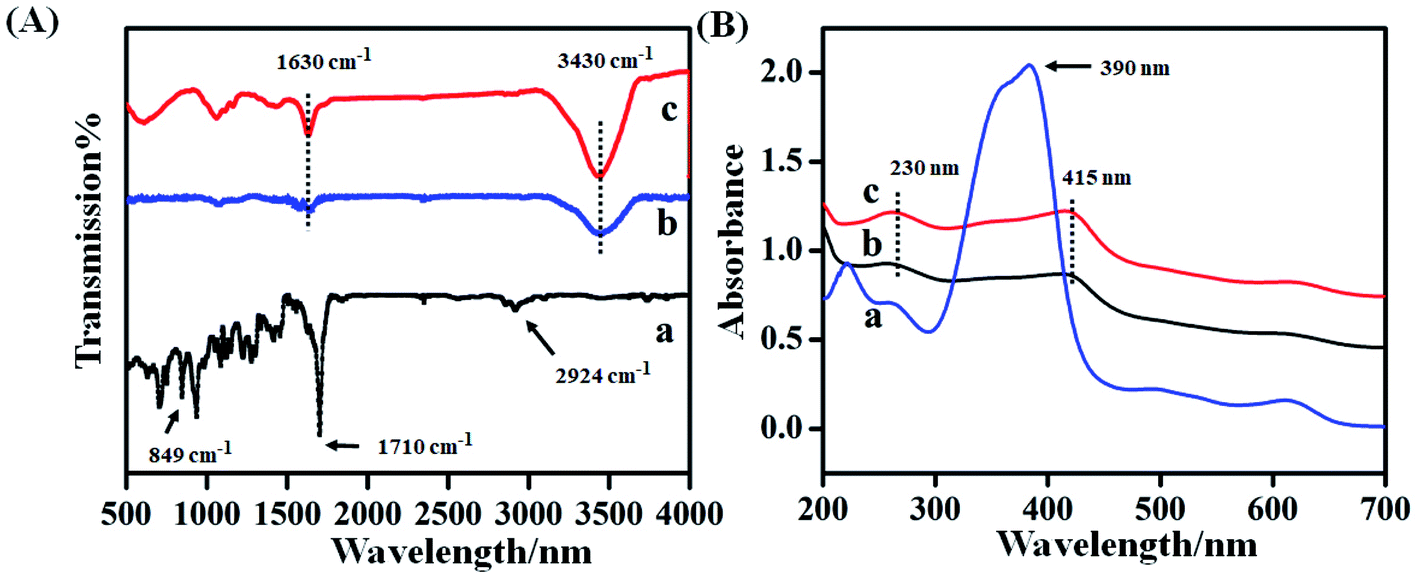 | ||
| Fig. 2 (A) FTIR spectra images of different materials: (a) hemin, (b) hemin–rGO, (c) hemin–rGO–cMWCNTs. (B) UV-vis spectra images of different materials: (a) hemin, (b) hemin–rGO, (c) hemin–rGO–cMWCNTs. | ||
Fig. 2B was the UV-vis spectrum of hemin (curve a), hemin–rGO (curve b) and hemin–rGO–cMWCNTs (curve c). Hemin (curve a) displayed the characteristic peak at 390 nm attributed to the soret effect, and several weak absorption peaks around 500–600 nm corresponded to the Q-band absorption of hemin porphyrin derivatives.25,26 After addition of rGO (curve b), the peak at 415 nm was attributed to the red shift of hemin and the characteristic peak at 230 nm was assigned to CC bond transition of rGO, proving that hemin was successfully combined with rGO through π–π action.27,28 From curve c in Fig. 2B, the peak at 230 nm was ascribed to the abundant carboxyl groups on the surface of cMWCNTs, and the peak at 415 nm was assigned to the characteristic absorption peak of hemin.29 Combined with FTIR spectra, it was verified that the hemin–rGO–cMWCNTs was synthesized successfully.
3.2. The biocompatibility of hemin–rGO–cMWCNTs
The biocompatibility of the aptasensors was characterized by CD and cytotoxicity measurements. It can be seen from curve a in Fig. 3A that the CD spectra of aptamer at room temperature exhibited a negative band centered around 200 nm and 245 nm, positive band around 210 nm in the absence of hemin–rGO–cMWCNTs. Upon the addition of 1.5 mg mL−1 hemin–rGO–cMWCNTs, the peaks were similar to the pure aptamer in both peak intensity and peak position (curve b), which attributed to the good biocompatibility of hemin–rGO–cMWCNTs.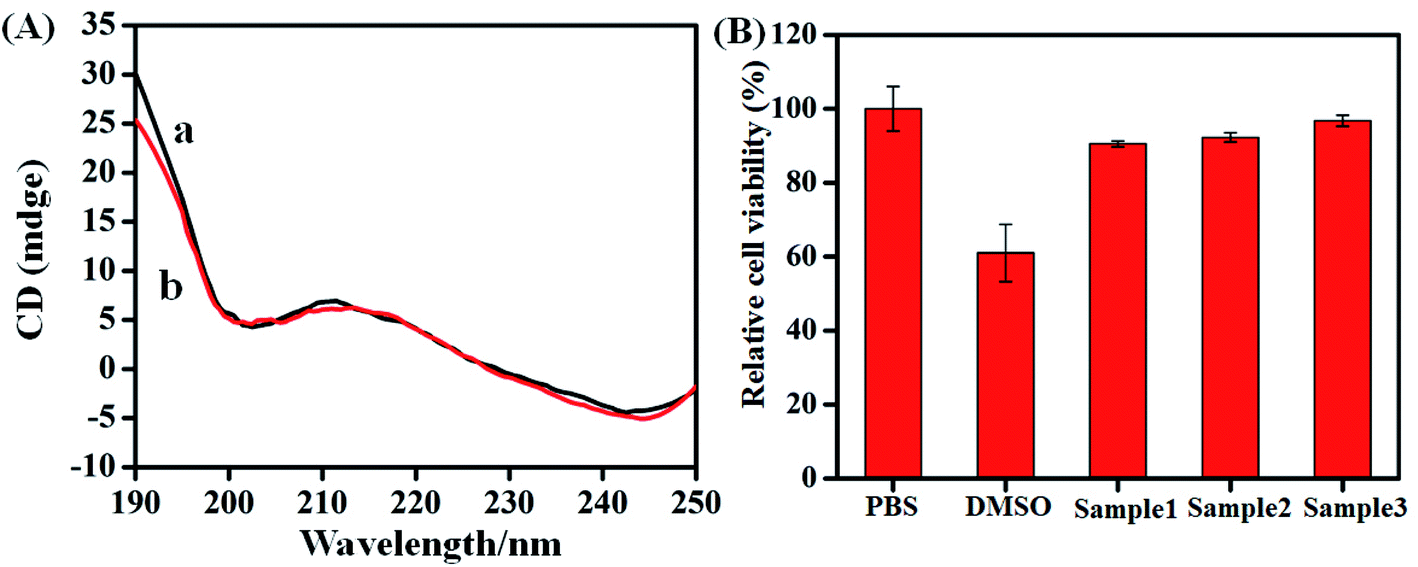 | ||
| Fig. 3 (A) The CD of aptamer (curve a) and aptamer incubated with hemin–rGO–cMWCNTs (curve b). (B) MTT assay of different concentration of hemin–rGO–cMWCNTs (Sample1: 150 μg mL−1, sample2: 15 μg mL−1, sample3: 1.5 μg mL−1). | ||
The MTT assay was performed to assess the viability of cells and to determine the cytotoxicity of hemin–graphene–cMWCNTs. Compared to the percentage of cell viability of PBS control (100%), the concentration of the hemin–graphene–cMWCNTs samples (150 μg mL−1, 15 μg mL−1, 1.5 μg mL−1) had lower cytotoxicity (90.51 ± 0.74%, 92.26 ± 1.24%, 96.78 ± 1.49%, Fig. 3B).
3.3. Electrochemical characteristics of aptasensor
In order to study the electrochemical characteristics of different materials and verify the feasibility of this experiment, CV was used to investigate the electrochemical properties of GCE (a), hemin–rGO/GCE (b), hemin–rGO–cMWCNTs/GC(c), aptamer/hemin–rGO–cMWCNTs/GCE (d) and KANA/aptamer/hemin–rGO–cMWCNTs/GCE (e) in 0.1 M PBS (pH 6.0). In curve a of Fig. 4, no peaks were observed at bare GCE. While hemin–rGO was coated on the GCE (curve b), a pair of stable and obvious redox peaks appeared around −0.42 V (vs. SCE) and −0.35 V (vs. SCE) was exhibited. The redox peaks could be ascribed to the pair of peaks can be ascribed to the DET reaction (the conversion of Fe(III/II) center) of hemin.30 After hemin–rGO–cMWCNTs was modified on the GCE (curve c), the redox peaks increased significantly according to good conductivity of hemin–rGO–cMWCNTs. When KANA aptamer was immobilized on the surface of hemin–rGO–cMWCNTs/GCE (curve d), the redox peaks decreased sharply for the high steric hindrance on aptamer/hemin–rGO–cMWCNTs/GCE.31 Ultimately, when the detected target KANA added, the aptamer/hemin–rGO–cMWCNTs/GCE could combine with KANA (curve e), causing the current peak significant to decreased. Moreover, as shown in Fig. S1A,† compared with the hemin–rGO–Au,32 the background current of hemin–rGO–cMWCNTs/GCE (curve a) was increased tremendously than hemin–rGO–Au/GCE (curve b) because of the good conductivity of cMWCNTs (Fig. S1A†), which is consistent with EIS (Fig. S1B†). The results via MTT, CD and electrochemistry showed hemin–graphene–cMWCNTs could play the role of an efficient electron-conducting tunnel and biocompatible spatial micro-environment. As described, the aptamer/hemin–rGO–cMWCNTs/GCEs had good response towards KANA and the aptasensor could be used to detect KANA in the following experiments.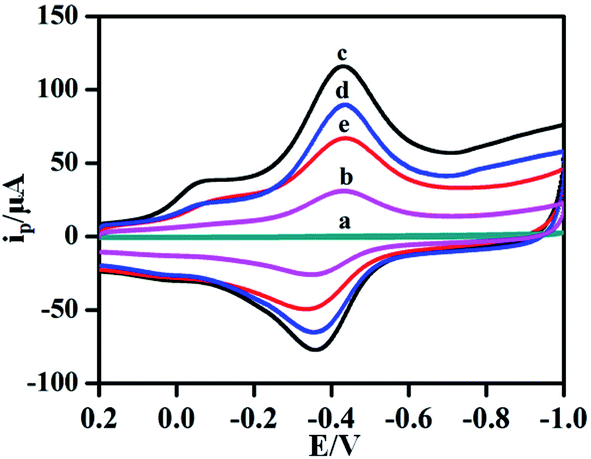 | ||
| Fig. 4 . The CV plots of different GCEs: (a) GCE, (b) hemin–rGO/GCE, (c) hemin–rGO–cMWCNTs/GCE, (d) aptamer/hemin–rGO–cMWCNTs/GCE, (e) KANA/aptamer/hemin–rGO– cMWCNTs/GCE in 0.1 M PBS (pH 6.0). | ||
3.4. The optimization of experimental conditions
To improve the performance of the KANA aptasensor, several factors such as pH, incubation temperature, incubation time and the volume of hemin–rGO–cMWCNTs modified on GCEs were investigated. The charge properties of electrode surface and the activity of aptamer were influenced by the pH value. As shown in Fig. 5A, the peak increased in the range of pH 4.0 to 6.0, and decreased gradually when the pH value was over 6.0, which attributed to the change of pH might destroy the structure and eventually lead to inactivation of the aptamers.33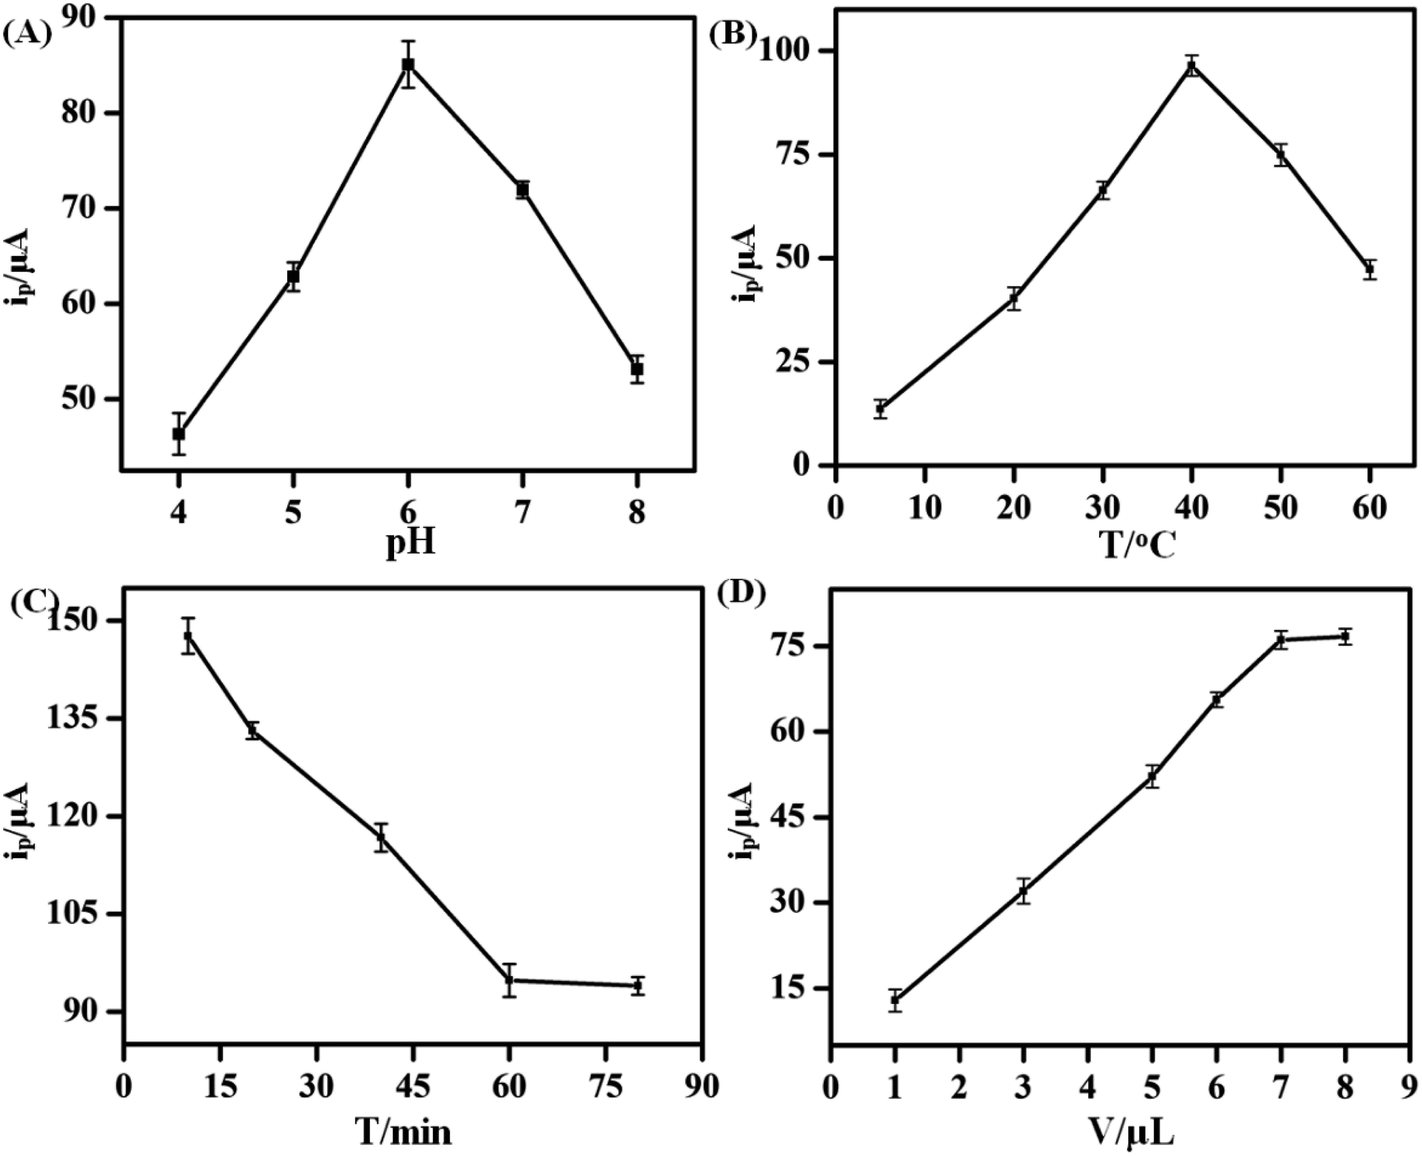 | ||
| Fig. 5 Effects of (A) the pH of phosphate buffer solution (pH: 4.0, 5.0, 6.0, 7.0, 8.0). (B) The temperature of KANA and aptamer (5.0, 20, 30, 40, 50, 60 °C). (C) The incubation time of KANA and aptamer detection in 0.1 M PBS (15, 30, 45, 60, 75, 90 min). (D) The volume of hemin–rGO–cMWCNTs modified on GCEs (1.0, 3.0, 5.0, 6.0, 7.0, 8.0 μL). | ||
Therefore, the aptasensor showed an optimal sensitivity of response at pH 6.0.
Furthermore, incubation temperature could affect the activity of aptamer. The temperature between KANA and the aptamer was investigated under 5 °C, 20 °C, 30 °C, 40 °C, 50 °C and 60 °C (Fig. 5B). The current peak increased with the temperature ranging from 5 °C to 40 °C. However, the activity of aptamer was depressed when temperature was over 40 °C. Therefore, 40 °C was adopted as the optimal temperature.
Incubation time was also an important factor in electrochemical performance of the aptasensor. A series of KANA/aptamer/hemin–rGO–cMWCNTs/GCE were incubated for 15, 30, 45, 60, 75, 90 min, respectively. As shown in Fig. 5C, the current peak decreased sharply with time increasing, and it remained stable after 60 min. The results proved that the aptamers had combined with KANA completely. Thus, the optimal incubation time was 60 min.
Moreover, the volume of hemin–rGO–cMWCNTs modified on the GCE was investigated (Fig. 5D). In the range of 1 μL to 9 μL, the peak current increased up to 7.0 μL and then kept stable, which indicated the effective area of the GCE had been covered. Thus, the optimal modified volume was set as 7.0 μL.
3.5. The effect of scan rates
Scan rates were used to reveal the electrochemical behavior on the surface of GCEs in buffer. The CVs of the KANA/aptamer/hemin–rGO–cMWCNT at different scan rates (20, 40, 50, 60, 70, 80, 80, 90, 100 mV s−1) in 0.1 M PBS (pH 6.0) were shown in Fig. 6A and B. The peak currents increased linearly as the scan rate increasing, which showed a relationship with the regression equation of Ipc (μA) = 1.72v + 0.50 (R2 = 0.99) and Ipa (μA) = −3.38v − 0.48 (R2 = 0.99). The results indicated that the electron transfer between the aptamer and the GCE could occur on the hemin–rGO–cMWCNTs, and the process between KANA and aptamers on the surface of GCE was adsorption control.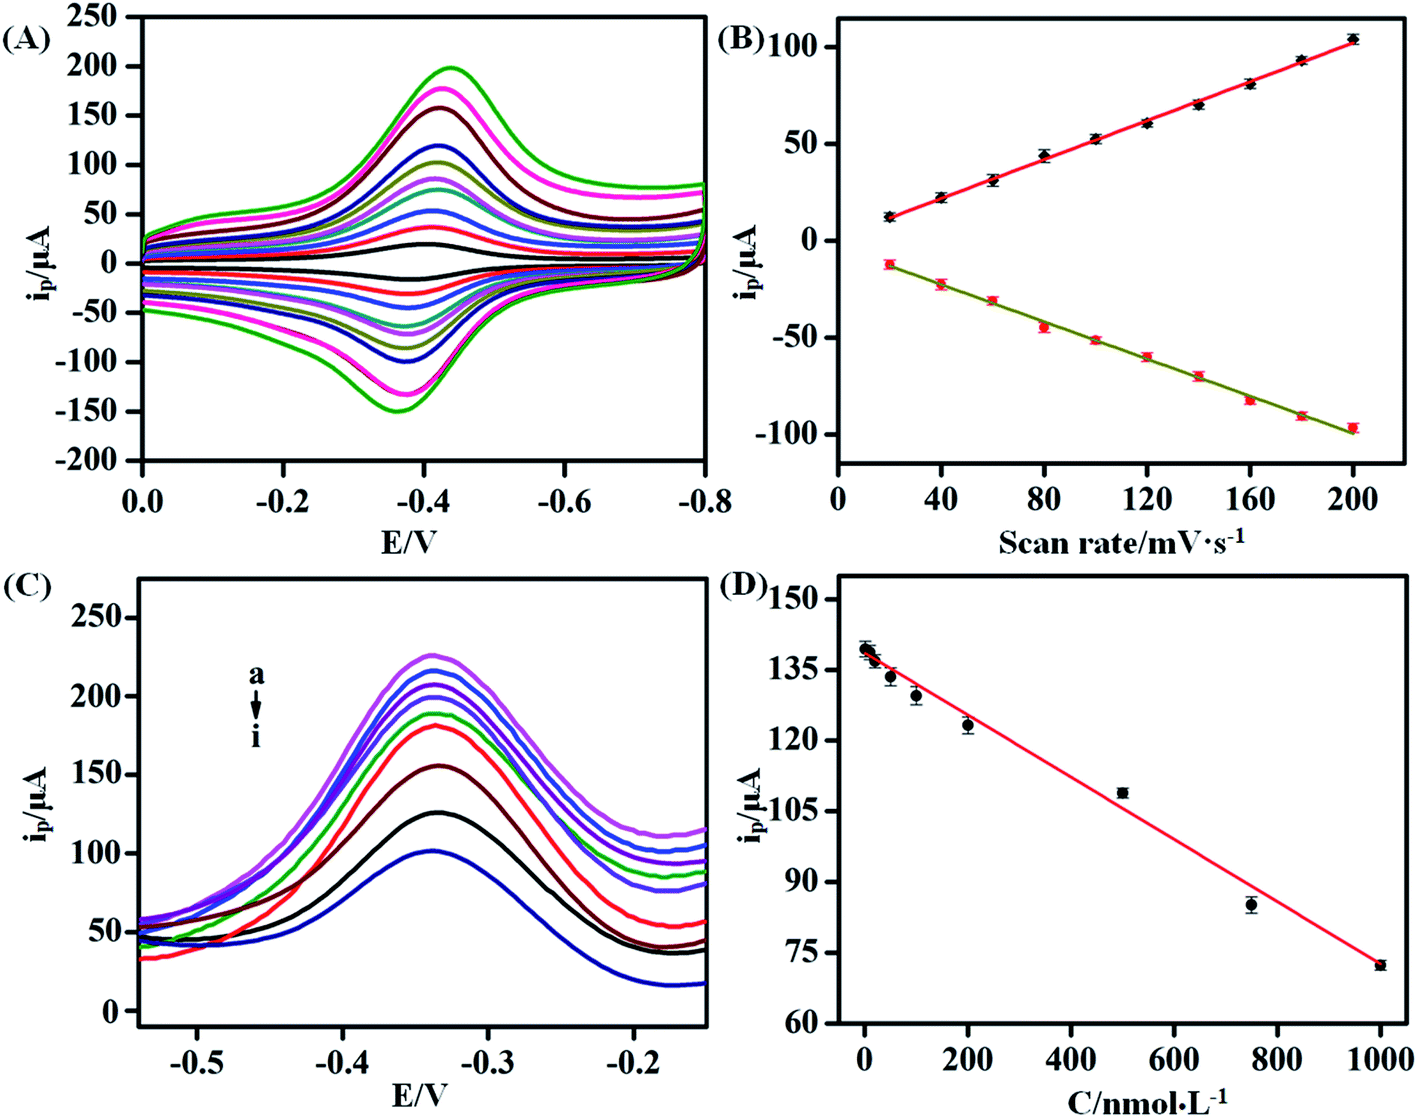 | ||
| Fig. 6 (A) The CV plots of KANA/aptamer/rGO–hemin–cMWCNTs/GCE at different scan rates (20, 40, 60, 80, 100, 120, 140, 160, 180, 200 mV s−1) in 0.1 M PBS (pH 6.0). (B) The relationship between peak current and scan rates. (C) The DPV plots of KANA/aptamer/hemin–rGO–cMWCNTs/GCE modified with different concentrations of KANA (a to i: (1 nM,,10 nM, 20 nM, 50 nM, 100 nM, 200 nM, 500 nM, 750 nM, 1000 nM)). (D) The relationship between peak current and the concentration of KANA. | ||
3.6. The detection of KANA
Under the optimal conditions, DPV was used to investigated the electrochemical responses of the aptasensor towards different concentrations of KANA in 0.1 M PBS. As shown in Fig. 6C, with the increasing concentration of KANA, the electrochemical signals gradually decreased. In the range of 10−9 to 10−6 M, the concentration of KANA had a linear relationship with the current peak (Fig. 6D). The linear equation was I (μA) = −0.07CKANA +138.19 (R2 = 0.99). The limit of detection was estimated from the equation: LOD = 3σ/κ as 0.36 nM with the signal to noise ratio being 3. In the above equation, σ is the standard deviation of the blank solution (i.e. without KANA) and κ denotes the slope of the calibration curve. For comparison, the results obtained by previously reported methods for the detection of KANA were listed in Table 1. It could be concluded the aptamer/hemin–rGO–cMWCNTs sensor had a wide linear range and a low detection limit, which could be used to detection of KANA in practical samples.| Method | R2 | Detection range | Detection limit | Ref. |
|---|---|---|---|---|
| MIL-53(Fe)@CdS QDs-PEI electrochemiluminescence | 0.99 | 10−10 to 10−6 M | 0.017 nM | 34 |
| AuNPs-aptamer hairpin DNA probe | 0.99 | 10–40 μM | 0.68 μM | 35 |
| MPDA fluorescence probe | 0.98 | 0–50 nM | 304 pM | 36 |
| Exo I-TDT aptasensor- PEC | 0.99 | 0.06–150 nM | 10 pM | 37 |
| TiO2–MoS2-AuNPs-PEC photoelectrochemistry | 0.99 | 0.2–450 nM | 0.05 nM | 38 |
| Aptamer/hemin–rGO–cMWCNTs/GCE | 0.99 | 10−9 to 10−6 M | 0.36 nM | This work |
3.7. Interference, reproducibility and stability
The selectivity and specificity were vital factors to evaluate the aptasensor. To investigate the selectivity of the aptasensor, several antibiotics commonly used in animal husbandry were studied and the concentrations of those antibiotics were set at 100 times of KANA. As revealed in Fig. 7, only the presence of KANA could decrease the current response obviously, whereas other antibiotics did not show remarkably on current responses. The limited influence caused by others antibiotic implied that the interference singles could be controlled, and the results exhibited that the aptasensor had good selectivity towards KANA. | ||
| Fig. 7 The anti-interference detection of aptamer/hemin–rGO–cMWCNTs/GCE in 0.1 M PBS with KANA (10−6 M), SDZ (10−4 M), CTC (10−4 M), TET (10−4 M), OTC (10−4 M), respectively. | ||
Meanwhile, in order to be achieve better practical application, the repeatability and stability of the aptasensor were investigated. Ten parallel prepared aptasensors were used to detect KANA and the relative standard deviation was 3.21%. Besides, the aptasensors were stored at 4 °C for ten days, and the results of stability remained 96.19%. Thus, the stability and repeatability of the aptasensor were acceptable.
3.8. The recovery rates of KANA in real sample
To verify the application and reliability of the aptasensor, LCMS was used as a reference method to measure KANA in chicken samples. Different concentrations of KANA (10 nM, 100 nM, 1000 nM) were added, then the samples were extracted and analyzed. The results were presented in Table 2. The recovery rates of the aptasensor were 98–105%, and the RSDs were less than 5%. Furthermore, the results measured by the aptasensor were well consistent with the data determined by LCMS, indicating that the method can be used for the detection of KANA in real samples efficiently.| Samples | Detected by aptasensor | Detected by LC-MS | |||||
|---|---|---|---|---|---|---|---|
| Added | Found | Recovery | RSD (n = 3) | Found | Recovery | RSD (n = 3) | |
| Chicken | 1 nM | 1.05 nM | 105% | 3.10% | 0.99 nM | 99% | 1.90% |
| 100 nM | 102.75 nM | 103% | 3.20% | 101.23 nM | 101% | 2.50% | |
| 1000 nM | 983.98 nM | 98% | 2.30% | 992.15 nM | 99% | 2.10% | |
4. Conclusions
In summary, we have developed an electrochemical aptasensor for the detection of KANA based on hemin–rGO–cMWCNTs. The aptamer/hemin–rGO–cMWCNTs exhibited several advantages. Firstly, the hemin–rGO–cMWCNTs showed good conductivity and biocompatibility, which could be used as practical carriers for loading aptamer in further study of aptasensor development. Secondly, the proposed aptamer/hemin–rGO–cMWCNTs sensor presented a low detection limit of 0.36 nM and a wide linear range from 10−9 to 10−6 M. Thirdly, the aptasensor exhibited high selectivity, good stability and repeatability for KANA detection. Moreover, the aptasensor was used to detection of KANA in practical samples with satisfactory results, which hold great application prospects in the evaluation of KANA residue.Author contributions
Conceptualization, methodology, software, investigation, writing-original draft: Tianyi Gao; writing – review & editing: Chong Sun; validation, resources, data curation: Nana Zhang; investigation: Yang Huang; validation: Hongxing Zhu; software: Chunmei Wang supervision, project administration: JinXuan Cao; supervision, project administration: Daoying Wang.Conflicts of interest
The authors declared that they have no conflicts of interest to this work. We declare that we do not have any commercial or associative interest that represents a conflict of interest in connection with the work submitted.Acknowledgements
The acknowledgements come at the end of an article after the conclusions and before the notes and references. This study was supported by National Natural Science Foundation of China (31972137) and Independent Research Project of Jiangsu Key Laboratory for Food Quality and Safety (2019JG001).Notes and references
- C. R. Strachan and J. Davies, J. Ind. Microbiol. Biotechnol., 2016, 43, 149–153 CrossRef CAS PubMed.
- Y. Yao, C. M. Jiang and J. F. Ping, Biosens. Bioelectron., 2019, 123, 178–184 CrossRef CAS PubMed.
- M. R. Vishnuraj, G. Kandeepan, K. H. Rao, S. Chand and V. Kumbhar, Biosens. Bioelectron., 2016, 2, 1235458 Search PubMed.
- H. Neuman, P. Forsythe, A. Uzan, O. Avni and O. Koren, FEMS Microbiol. Rev., 2018, 42, 489–499 CAS.
- C. Wang, D. Chen, Q. Wang and R. Tan, Biosens. Bioelectron., 2017, 91, 262–267 CrossRef CAS PubMed.
- W. Yu, B. Jialei, H. Bingyang, Y. Shuai, Z. Man, S. Xuan, P. Yuan, L. Shuang, W. Jiang and N. Baoan, Anal. Chem., 2018, 90, 9936–9942 CrossRef PubMed.
- L. Hosseinzadeha and M. Mazloum-Ardakanib, Adv. Clin. Chem., 2020, 99, 237–279 Search PubMed.
- M. Citartan, S. C. Gopinath, J. Tominaga, S.-C. Tan and T.-H. Tang, Biosens. Bioelectron., 2012, 34, 1–11 CrossRef CAS PubMed.
- T. Ye, Y. Peng, M. Yuan, H. Cao, J. Yu, Y. Li and F. Xu, Microchim. Acta, 2019, 186, 40 CrossRef PubMed.
- Q. Luan, N. Gan, Y. Cao and T. Li, J. Agric. Food Chem., 2017, 65, 5731–5740 CrossRef CAS PubMed.
- X. Zhang, J. Wang, Q. Wu, L. Li, Y. Wang and H. Yang, Molecules, 2019, 24, 1902 CrossRef CAS PubMed.
- Y. Chen, Z. Wang, Z. Wang, S. Tang, Y. Zhu and X. Xiao, J. Agric. Food Chem., 2008, 56, 2944–2952 CrossRef CAS PubMed.
- Q. L. Li, Y. Zhang, P. W. Li, H. G. Xue and N. Q. Jia, Microchim. Acta, 2020, 187, 8 CrossRef PubMed.
- S. Liu, J. Ding and W. Qin, Anal. Chem., 2019, 91, 3170–3176 CrossRef CAS PubMed.
- Y. Liu, X. L. Xu, H. T. Yang, E. S. Xu, S. S. Wu, W. Wei and J. Chen, Analyst, 2018, 143, 2501–2507 RSC.
- H.-Y. Zou, X.-Y. Lu, F.-Y. Kong, Z.-X. Wang, H.-Y. Li, H.-L. Fang and W. Wang, RSC Adv., 2020, 10, 28026–28031 RSC.
- Y. Ye, J. Gao, H. Zhuang, H. Zheng, H. Sun, Y. Ye, X. Xu and X. Cao, Microchim. Acta, 2017, 184, 245–252 CrossRef CAS.
- A. U. Alam, Y. Qin, M. Catalano, L. Wang, M. J. Kim, M. M. R. Howlader, N.-X. Hu and M. J. Deen, ACS Appl. Mater. Interfaces, 2018, 10, 21411–21427 CrossRef CAS PubMed.
- H. Li, D. E. Sun, Y. J. Liu and Z. H. Liu, Biosens. Bioelectron., 2014, 55, 149–156 CrossRef CAS PubMed.
- Y. Guo, L. Deng, J. Li, S. Guo, E. Wang and S. Dong, ACS Nano, 2011, 5, 1282–1290 CrossRef CAS PubMed.
- S. Bai, X. Sun, N. Han, X. Shu, J. Pan, H. Guo, S. Liu, Y. Feng, R. Luo and D. Li, J. Hazard. Mater., 2020, 394, 121832 CrossRef CAS PubMed.
- C. Zhang, S. Zhang, Y. Jia, Y. Li, P. Wang, Q. Liu, Z. Xu, X. Li and Y. Dong, Biosens. Bioelectron., 2019, 126, 785–791 CrossRef CAS PubMed.
- Y. Zhou, F. Li, H. Wu, Y. Chen, H. Yin, S. Ai and J. Wang, Sens. Actuators, 2019, 296 Search PubMed.
- A. K. Das, R. K. Layek, N. H. Kim, D. Jung and J. H. Lee, Nanoscale, 2014, 6, 10657–10665 RSC.
- W. W. Hu, X. H. Yu, Q. Hu, J. M. Kong, L. Z. Li and X. J. Zhang, J. Environ. Sci., 2017, 53, 278–283 CrossRef CAS PubMed.
- S. M. Moshtaghioun, Biosens. Bioelectron., 2019, 129, 1–6 CrossRef PubMed.
- X. Y. Zhang, Y. Yu, J. L. Shen, W. Qi and H. Wang, Anal. Chim. Acta, 2019, 1070, 80–87 CrossRef CAS PubMed.
- G. Li, H. Feng, X. Shi, M. Chen, J. Liang and Z. Zhou, Bioelectrochemistry, 2020, 138, 107696 CrossRef PubMed.
- J. J. Gao, M. X. Liu, H. O. Song, S. P. Zhang, Y. Y. Qian and A. M. Li, J. Hazard. Mater., 2016, 318, 99–108 CrossRef CAS PubMed.
- Q. Li, Y. Zhang, P. Li, H. Xue and N. Jia, Microchim. Acta, 2020, 187, 45 CrossRef CAS PubMed.
- Y. Tang, C. Yun, X. Liu, L. Li, L. Yang, P. Liu, Y. Zhou, H. Ju and Y. Cheng, Biosens. Bioelectron., 2018, 117, 224–231 CrossRef CAS PubMed.
- X. Xin, Y. Yang, J. Liu, X. Wang, H. Zhou and B. Yu, RSC Adv., 2016, 6, 26203–26209 RSC.
- Y. Guo, F. Yang, Y. Yao, J. Li, S. Cheng, H. Dong, H. Zhang, Y. Xiang and X. Sun, J. Hazard. Mater., 2021, 401 Search PubMed.
- D. F. Feng, X. C. Tan, Y. Y. Wu, C. H. Ai, Y. N. Luo, Q. Y. Chen and H. Y. Han, Biosens. Bioelectron., 2019, 129, 100–106 CrossRef CAS PubMed.
- C. Xu, Y. Ying and J. Ping, Microchim. Acta, 2019, 186 Search PubMed.
- P. Perumal, Analyst, 2019, 144, 2337–2344 RSC.
- K. Abnous, Biosens. Bioelectron., 2019, 123, 14–18 CrossRef PubMed.
- X. Liu, P. Liu, Y. Tang, L. Yang, L. Li, Z. Qi, D. Li and D. K. Y. Wong, Biosens. Bioelectron., 2018, 112, 193–201 CrossRef CAS PubMed.
Footnote |
| † Electronic supplementary information (ESI) available. See DOI: 10.1039/d1ra01135a |
| This journal is © The Royal Society of Chemistry 2021 |