 Open Access Article
Roles of water in the formation and preparation of graphene oxide†
Qiang Zhanga,
Yuying Yanga,
Huiqing Fana,
Liu Fengb,
Guangwu Wenb and
Lu-Chang Qin c
c
aCollege of Chemistry and Chemical Engineering, Shandong University of Technology, China
bCollege of Materials Science and Engineering, Shandong University of Technology, China
cDepartment of Physics and Astronomy, University of North Carolina at Chapel Hill, China
First published on 28th April 2021
Abstract
The functional groups and physical properties of graphene oxide (GO) are found to be sensitive to and can be controlled by the water content in the reactions when GO samples are prepared at different concentrations of sulfuric acid using a modified Hummers method. GO prepared with 93% sulfuric acid (H2SO4) showed fewer structural defects, less π–π conjugation, and larger interlayer spacing than GO prepared with 99% H2SO4. The intensity ratio of the D-band to the G-band of the Raman spectrum is 0.89 ± 0.01 and 1.02 ± 0.01, corresponding to average interlayer spacing of 0.91 nm and 0.86 nm, respectively. The yield and carbon to oxygen ratio of the GO sheets prepared from different concentrations of H2SO4 are nearly identical. More importantly, compared with GO synthesized with 99% H2SO4, GO prepared with 93% H2SO4 contains more carbon–oxygen single bonds, such as epoxy groups and hydroxyl groups, but fewer carbonyl groups.
1. Introduction
Graphene is a two-dimensional material with unique properties,1 such as mechanical stiffness, superior strength and elasticity, large specific surface area, and exciting potentials for energy storage and nanoelectronics applications.2–6 Therefore it is of great importance to establish experimental methods for mass-production of graphene with fewer layers and fewer structural defects. Since Stankovich et al. reported their successful results to obtain monolayer graphene by oxidation and reduction, the chemical method has become the most widely used technique to prepare graphene.7,8Graphene oxide (GO) is the precursor for preparation of graphene and it can be prepared through several approaches.9,10 The structure and properties of GO determine the quality and conductivity of graphene.11 Graphite oxide was first prepared by Brodie in 1859.12 Hummers and Offeman refined the method in 1958 that has since been widely used for the synthesis of GO.13 It has been observed and recognized that the product of these reactions was sensitive to not only the particular oxidants used, but also the graphite precursor and reaction conditions.14,15 This method and other subsequent improved Hummers methods all used sulfuric acid (H2SO4) to intercalate graphite and potassium permanganate (KMnO4) as a strong oxidant with the assistance of sodium nitrate (NaNO3) as an activator of aromatic carbon.16,17 As of today, H2SO4 is still the best intercalation solvent for the synthesis of GO.
Graphene has excellent electrical conductivity that relies mainly on the conjugate network of graphitic structure.18,19 Functional groups are usually attached on the basal plane of reduced graphene oxide (rGO) and the structural defects not only destroy the conjugation, but also localize the π-electrons, which often result in a decrease of both carrier mobility and carrier concentration.20 Therefore, the reduction of GO is not only concerned with removing the oxygenic functional groups bonded to graphene and atomic-scale lattice defects, but also is aimed at recovering the conjugated network of the graphitic lattice.
According to the mechanism of reduction with hydrazine, hydrazine hydrate (N2H4·H2O) can only reduce the epoxy group, forming a hydroxyl group with a low bonding energy and high activity.21,22 Then the hydroxyl group would form water molecules at normal temperature. The carbonyl groups and the carboxyl groups would remain present on the edges of the graphene sheet. Therefore, a successful synthesis of GO should satisfy two basic requirements: (a) reduce the carbonyl groups on the basal plane and (b) create structural defects in GO as few as possible to ensure rGO to possess a more graphitic structure with fewer defects. If there are many defects on the surface of GO, such defects would form new edges and then produce carbonyl groups in the oxidation reaction. Marcano et al. used a 9![[thin space (1/6-em)]](https://www.rsc.org/images/entities/char_2009.gif) :
:![[thin space (1/6-em)]](https://www.rsc.org/images/entities/char_2009.gif) 1 sulfuric acid (H2SO4) and phosphoric acid (H3PO4)-mixed solvent to synthesize GO with fewer structural defects and fewer carbonyl functional groups, though this method suffered from a low yield and also introduced phosphorus impurities.23
1 sulfuric acid (H2SO4) and phosphoric acid (H3PO4)-mixed solvent to synthesize GO with fewer structural defects and fewer carbonyl functional groups, though this method suffered from a low yield and also introduced phosphorus impurities.23
Kang et al. reported the effect of oxidation temperature on the particle size and physical properties of graphite oxide sheets.24 The C/O ratio and average size of the GO sheets increased as the oxidation temperature decreased. Thus, more functional groups and defect sites were created at higher oxidation temperature. For the preparation of large size GO, lower temperature reactions were favorable. Zhang et al. studied the effect of oxidation time and the amount of oxidants on the size control of GO sheets produced by chemical exfoliation.25 With more reaction time and oxidants, the average size of the GO sheets exhibited a Gaussian distribution. In brief, as expected, higher temperature reactions, longer oxidation time, and more oxidant will reduce the GO particle size and decrease the conjugate structure domains.
The Dimiev–Tour model for the synthesis of GO has been adopted widely for understanding the formation of graphite oxide:26,27 (i) transform graphite into a graphite intercalation compound (GIC) with H2SO4 intercalated into the graphite layers to enlarge the interlayer distance of graphite and form C(21−28)HSO4−·2H2SO4; (ii) oxidants enter further into the graphite layers and react with the C atoms on the basal plane to produce functional groups; and (iii) moisture enters the graphite interlayers and ions exchange with HSO4− or SO42− to form graphite oxide.
As illustrated in the Dimiev–Tour model, water actually played an essential role in the chemical reactions leading to the formation of GO. However, there has been no specific study reported in the literature using controlled experiments to examine the effects of water on the formation and production of GO.
In this study, we designed controlled experiments to investigate the effects of water content in the reactions and especially its effects on the formation and concentration of structural defects and carbonyl groups that were produced in the reactions. In addition, we propose a serial molecular models for understanding the dynamic processes involving C(21−28)HSO4−·2H2SO4 under the influence of manganese heptaoxide (Mn2O7). We have also examined the role of water molecules in affecting the physical and chemical properties of GO, including altering the distribution of functional groups, the inter-layer spacing, the formation of structural defects, and the solution stability.
2. Experimental
2.1 Chemical reagents
The starting materials included graphite powders (<15 μm), sulfuric acid (H2SO4, 99%), potassium permanganate (KMnO4, 98%), hydrogen peroxide (H2O2, 30%), hydrochloric acid (HCl, 37%), sodium nitrate (NaNO3, 98%), and hydrazine hydrate (N2H4·H2O, 80 wt%) and they all were purchased commercially.2.2 Materials characterization
X-ray photoelectron spectra (XPS) were recorded with (Thermo) ESCALAB 250XI. Raman spectra were recorded with HORIBA Scientific LabRAM HR Evolution with 514 nm laser. The zeta potentials of aqueous GO dispersions were measured with ZS90 Microelectrophoresis. X-ray diffraction (XRD) was carried out by using WJGS-009 D8 Advance X-ray diffractometer with Cu-Kα radiation (λ = 0.15418 nm, Bruker, Germany). UV-visible absorption spectra were taken with TU-1810 UV-visible spectrometer (PuXi, China). Transmission electron microscopy (TEM) images were taken with FEI Tecnai G2 F20 S-TWIN.2.3 Synthesis of materials
Each mixture was washed with HCl aqueous solution (5%, 800 ml, 200 ml each for 4 times) to remove the metal ions. They were then washed with deionized water until the supernatant became neutral. As the pH value increased, the hydrophilicity of GO increased. The process of washing required centrifugation to separate GO and supernatant. The centrifuge speed was set as 8000 rpm. Finally, the GO colloid was dried in a freeze dryer. The solid GO was labeled GO-1, GO-2, GO-3, GO-4, GO-5, and GO-6 in turn.
3. Results and discussion
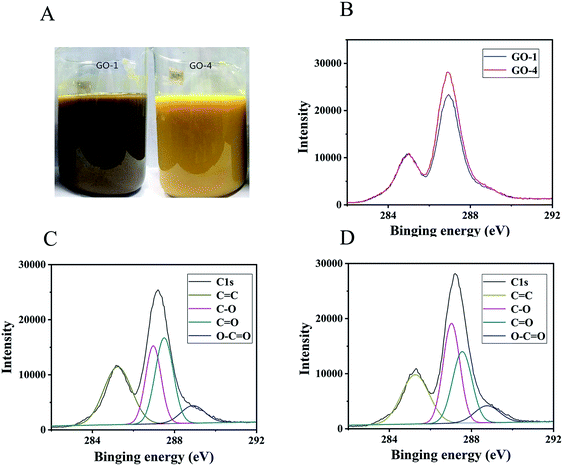
The carbon to oxygen ratio (C/O) would affect significantly the color of the GO suspension.14 The color of suspension is light green for a C/O ratio of 2.8–3.0. The color becomes yellowish green by further decreasing the C/O ratio. A bright yellow color was observed at the lowest C/O ratio of 2.0–2.4. In our experiment, we observed that GO-1 was khaki and GO-4 was bright yellow as displayed in Fig. 1 A.The C/O ratios of GO-1 (Fig. 1C) and GO-4 (Fig. 1D) were obtained from XPS measurements and they were 1.73 and 1.69, respectively, indicating a similar degree of oxidation. The C1s spectrum of GO revealed four types of carbon bonds: C![[double bond, length as m-dash]](https://www.rsc.org/images/entities/char_e001.gif) C (284.8 eV), C–O (286.9 eV including epoxy/hydroxyls), C
C (284.8 eV), C–O (286.9 eV including epoxy/hydroxyls), C![[double bond, length as m-dash]](https://www.rsc.org/images/entities/char_e001.gif) O (287.8 eV), and O–C
O (287.8 eV), and O–C![[double bond, length as m-dash]](https://www.rsc.org/images/entities/char_e001.gif) O (289.1 eV).28–30 Both GO samples had the same types of chemical bonds, i.e., the functional groups were the same. However, the concentrations of the chemical bonds were different, indicating that the content of functional groups was different. The areal fractions of the peak for the four functional groups in GO-1 (Fig. 1C) were 33.6% (C
O (289.1 eV).28–30 Both GO samples had the same types of chemical bonds, i.e., the functional groups were the same. However, the concentrations of the chemical bonds were different, indicating that the content of functional groups was different. The areal fractions of the peak for the four functional groups in GO-1 (Fig. 1C) were 33.6% (C![[double bond, length as m-dash]](https://www.rsc.org/images/entities/char_e001.gif) C), 25.5% (C–O), 32.0% (C
C), 25.5% (C–O), 32.0% (C![[double bond, length as m-dash]](https://www.rsc.org/images/entities/char_e001.gif) O), and 8.8% (O–C
O), and 8.8% (O–C![[double bond, length as m-dash]](https://www.rsc.org/images/entities/char_e001.gif) O). On the other hand, the areal fractions of the peak for the four functional groups in GO-4 (Fig. 1D) were 32.6% (C
O). On the other hand, the areal fractions of the peak for the four functional groups in GO-4 (Fig. 1D) were 32.6% (C![[double bond, length as m-dash]](https://www.rsc.org/images/entities/char_e001.gif) C), 30.6% (C–O), 26.1% (C
C), 30.6% (C–O), 26.1% (C![[double bond, length as m-dash]](https://www.rsc.org/images/entities/char_e001.gif) O), and 8.6% (O–C
O), and 8.6% (O–C![[double bond, length as m-dash]](https://www.rsc.org/images/entities/char_e001.gif) O). The ratio of peak areas for the C–O (25.5%) bond and C
O). The ratio of peak areas for the C–O (25.5%) bond and C![[double bond, length as m-dash]](https://www.rsc.org/images/entities/char_e001.gif) O (32.0%) bond in GO-1 (Fig. 1C) was 0.80, while the corresponding ration for GO-4 (Fig. 1D) was 1.17 (30.6%/26.1%). This significant difference indicates that the relative proportion of C–O bonds in GO-4 increased in comparison with that in GO-1, because GO-1 has been over-oxidized and part of the epoxy or hydroxyl groups were converted to carbonyls. The π–π conjugated structure in the graphene plane of GO-4 could have been destroyed by the introduced hydroxyl and epoxy functional groups. As a result, GO-1 has more residual π–π conjugated structures than GO-4, resulting in a lighter color than GO-1. At the same time, the carboxyl functional groups (O–C
O (32.0%) bond in GO-1 (Fig. 1C) was 0.80, while the corresponding ration for GO-4 (Fig. 1D) was 1.17 (30.6%/26.1%). This significant difference indicates that the relative proportion of C–O bonds in GO-4 increased in comparison with that in GO-1, because GO-1 has been over-oxidized and part of the epoxy or hydroxyl groups were converted to carbonyls. The π–π conjugated structure in the graphene plane of GO-4 could have been destroyed by the introduced hydroxyl and epoxy functional groups. As a result, GO-1 has more residual π–π conjugated structures than GO-4, resulting in a lighter color than GO-1. At the same time, the carboxyl functional groups (O–C![[double bond, length as m-dash]](https://www.rsc.org/images/entities/char_e001.gif) O) in GO-1 and GO-4 would also contribute to the improved stability of the GO suspensions.31
O) in GO-1 and GO-4 would also contribute to the improved stability of the GO suspensions.31
The C/O ratio in rGO-1 (ESI, Fig. S1A†) and rGO-4 (ESI, Fig. S1B†) is 9.4 and 10.7, respectively. Using hydrazine hydrate to reduce GO, the hydroxyl and epoxy groups (C–O) could be removed easily, but the carbonyl groups (C![[double bond, length as m-dash]](https://www.rsc.org/images/entities/char_e001.gif) O) could hardly be removed.22 These results indicate that more carbonyl groups remained in rGO-1 and more carbonyl groups were produced in GO-1. In Fig. 1B, using C
O) could hardly be removed.22 These results indicate that more carbonyl groups remained in rGO-1 and more carbonyl groups were produced in GO-1. In Fig. 1B, using C![[double bond, length as m-dash]](https://www.rsc.org/images/entities/char_e001.gif) C as the standard, the C1s peak in XPS of GO-1 and GO-4 were normalized. The peak at 278 eV for GO-4 is sharper than GO-1, indicating that GO-4 had a more regular structure.23,32
C as the standard, the C1s peak in XPS of GO-1 and GO-4 were normalized. The peak at 278 eV for GO-4 is sharper than GO-1, indicating that GO-4 had a more regular structure.23,32
We also characterized the GO samples with X-ray diffraction (XRD) that were prepared with different concentrations of H2SO4. No graphitic (002) peak was observed in all samples, indicating that all graphite samples had been oxidized completely.33 However, noticeable differences were observed in the GO samples prepared from different concentrations of H2SO4 in the characteristic interlayer spacing between the graphene layers. As shown in Fig. 2B, GO-4, prepared with 93% H2SO4, exhibited the largest interlayer spacing (d = 0.91 nm, 2θ = 9.7°), in contrast to the reduced interlayer spacing observed in GO-1 (d = 0.86 nm, 2θ = 10.3°) which was prepared with 99% H2SO4.
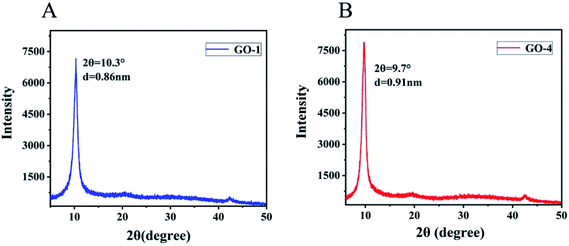 | ||
| Fig. 2 XRD pattern of (A) GO-1 and (B) GO-4. The interlayer spacing of GO-1 is 0.86 nm. The interlayer spacing of GO-4 is 0.91 nm. | ||
Hwee et al. compared the GO samples prepared by different methods and showed a variation in the spacing between the graphene layers. GO prepared using the Hummers method exhibited the largest inter-layer spacing (0.81 nm) and the lowest C/O ratio (1.12). GO prepared using the Hofmann method had an interlayer spacing of 0.72 nm and C/O ratio of 1.77. The smallest interlayer spacing of 0.70 nm was observed in GO prepared by the Staudenmaier method that had a C/O ratio of 2.52. These results showed that the lower the C/O ratio, the larger the interlayer spacing. However, since GO-1 and GO-4 samples had nearly the same C/O ratio, the difference in the interlayer spacing of the GO layers is attributed to the difference in the concentration of functional groups. As described in the established structure of GO, an epoxy group on the graphitic basal plane, the oxygen atom is 0.19 nm above the carbon grid (graphene).34 On the other hand, a hydroxyl group on the same graphitic basal plane, the top hydrogen atom is 0.22 nm above the carbon grid.34 C and O atoms in epoxy and hydroxyl groups are in the hybrid sp3 configuration.35 The C and O atoms in the carbonyl functional group are planar sp2-hybridized, contributing less to the expansion of the interlayer spacing. As a result, we suggest that GO-4 had a larger interlayer spacing than GO-1 because GO-4 contained more epoxy groups and hydroxyl groups than GO-1. In brief, the number of epoxy groups and hydroxyl groups played significant roles in governing the interlayer spacing. When the interlayer spacing was reduced, it should indicate that the amount of epoxy and hydroxyl groups in the product was reduced accordingly.
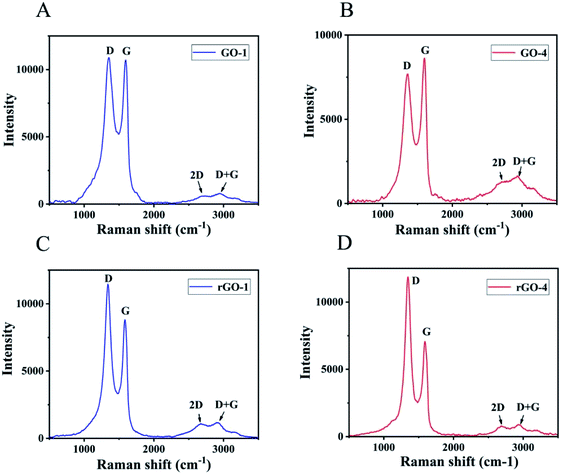
Raman spectroscopy was applied to analyze the G-band and D-band characteristic of graphitic structure. The G-band is associated with graphitic carbons and the D-band is related to the structural defects or partially disordered graphitic domains.36 The Raman spectra of GO showed the G-band at ∼1600 cm−1 and D-band at ∼1350 cm−1.37,38 The intensity ratio (ID/IG) for GO-1 (Fig. 3A) is 1.02 and the corresponding ID/IG ratio for GO-4 is 0.89 as shown in Fig. 3B. The comparative data indicated that there were more structural defects and lattice distortions in GO-1 than GO-4. In the process of peroxidation reaction between some hydroxyl and carboxyl functional groups to form carbonyl, new structural defects were formed, which led to the enhancement of the D peak in GO-1. The intensity ratio (ID/IG) for rGO-1 (Fig. 3C) is 1.30, which is also lower than that for rGO-4 as shown in Fig. 3D with ID/IG ratio of 1.68. These results indicate that there were more structural defects in rGO-4 than rGO-1. During the reduction process, GO-4 contained more hydroxyl and epoxy groups than GO-1. As more reduction reactions occurred, more structural defects were produced. The intensity of the 2D peak in GO-4 is greater than that in GO-1, indicating that the number of graphene layers in the graphite flakes in GO-4 is smaller than that in GO-1. Thicker graphite flakes resulted in the darker color of the GO-1 suspension. On the other hand, GO-1 and GO-4 contained different functional groups. GO-1 had more carbonyl groups on the edges and retained more conjugations in the basal plane, which is another reason that led to the darker color of the GO-1 suspension.
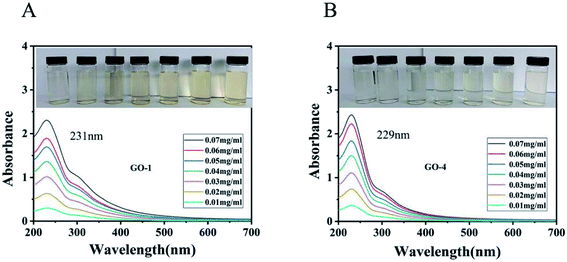
The UV-vis spectra of the GO suspensions are associated with the π → π* transitions and n → π* transitions.39,40 As shown in Fig. 4, the maximum wavelength of absorption of GO-1 is 229 nm and the maximum wavelength of absorption of GO-4 is 231 nm. Compared with the GO-1 suspension, the GO-4 absorption spectra were slightly blue-shifted. The spectra suggest that the more π–π conjugations in GO-1 were due to the greater retention of carbon rings in the basal planes. The electronic transition of the C![[double bond, length as m-dash]](https://www.rsc.org/images/entities/char_e001.gif) C double bond in graphite is the π → π* transition. When more oxygen atoms are attached onto the graphitic basal plane of GO-1, part of the electronic transition mode became the n → π* transition. Since the n → π* transition energy is less than the π → π* transition, so the absorption band is slight blue-shifted. It showed that as more oxygen atoms were introduced into the basal plane of GO-4, GO-4 would have more hydroxyl and epoxy groups than GO-1. The spectrum has a shoulder peak at 300 nm, which is attributed to the n → π* transition of C
C double bond in graphite is the π → π* transition. When more oxygen atoms are attached onto the graphitic basal plane of GO-1, part of the electronic transition mode became the n → π* transition. Since the n → π* transition energy is less than the π → π* transition, so the absorption band is slight blue-shifted. It showed that as more oxygen atoms were introduced into the basal plane of GO-4, GO-4 would have more hydroxyl and epoxy groups than GO-1. The spectrum has a shoulder peak at 300 nm, which is attributed to the n → π* transition of C![[double bond, length as m-dash]](https://www.rsc.org/images/entities/char_e001.gif) O bonds.39
O bonds.39
As illustrated in Fig. 4 (inset), a comparison of the GO suspensions with the same concentration, the color of the GO-1 suspension is darker than that of the GO-4 suspension. GO-4 had more hydroxyl and epoxy groups introduced in the basal plane than GO-1 and there were fewer π–π conjugations remained in the basal plane, resulting its color is lighter than the GO-1 suspension. On the other hand, GO-4 has fewer graphene layers than GO-1, a factor that also made the color lighter than the GO-1 suspension.
The suspensions of GO were negatively charged, mainly due to the carboxyl groups at the edges of the GO sheets.41 The zeta potentials of GO-1 and GO-4 suspensions (0.04 mg ml−1) were measured to be −42.3 mV and −44.5 mV, respectively, and they were negatively charged, indicating that they had carboxyl groups on the edges. Their values are all lower than −30 mV, so they all had good dispersibility.42 The GO-1 suspension has a slightly higher zeta potential than that of the GO-4 suspension, indicating that GO-4 is more stable and has more carboxyl groups.
By comparison, the 1.0 mg ml−1 suspension of GO-1 can be stored stably for three weeks, while the GO-4 solution could be stored stably for four weeks. (ESI, Table S1†).
When observed in TEM (Fig. 5) and SEM (ESI, Fig. S2†), the GO-1 and GO-4 samples showed a similar morphology. Their corresponding electron diffraction patterns (Fig. 5C and D) revealed that both retained excellent single crystalline structure without noticeable structural degradation due to the oxidation reactions. In fact, both GO-1 and GO-4 could be easily exfoliated into single layer GO with ultrasonic treatment.
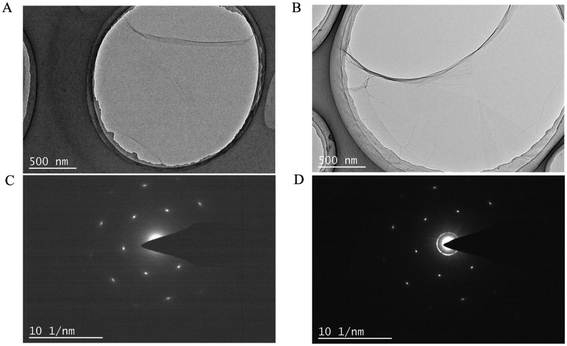 | ||
| Fig. 5 TEM images of (A) GO-1 and (B) GO-4 showing similar morphology and corresponding electron diffraction pattern of (C) GO-1 and (D) GO-4 showing single crystallinity of the GO sheets. | ||
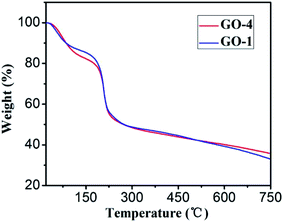
Thermogravimetric analysis (TGA) of GO-1 and GO-4 (Fig. 6) exhibited similar features: a weight loss before 100 °C is resulted from the releasing of trapped water between GO sheets.43 The curve at this stage shows that both have the same moisture content. The sharp weight loss between 200 and 230 °C is attributed to the decomposition of less stable oxygenic functional groups on the GO sheets.44 A gradual mass loss in the range of 230–800 °C is related to the removal of more stable functional groups, including part of the hydroxyl groups and carbonyl groups.45 After pyrolysis, the remaining mass of GO-4 is more than that of GO-1, indicating that the thermal stability of GO-4 is better than GO-1.
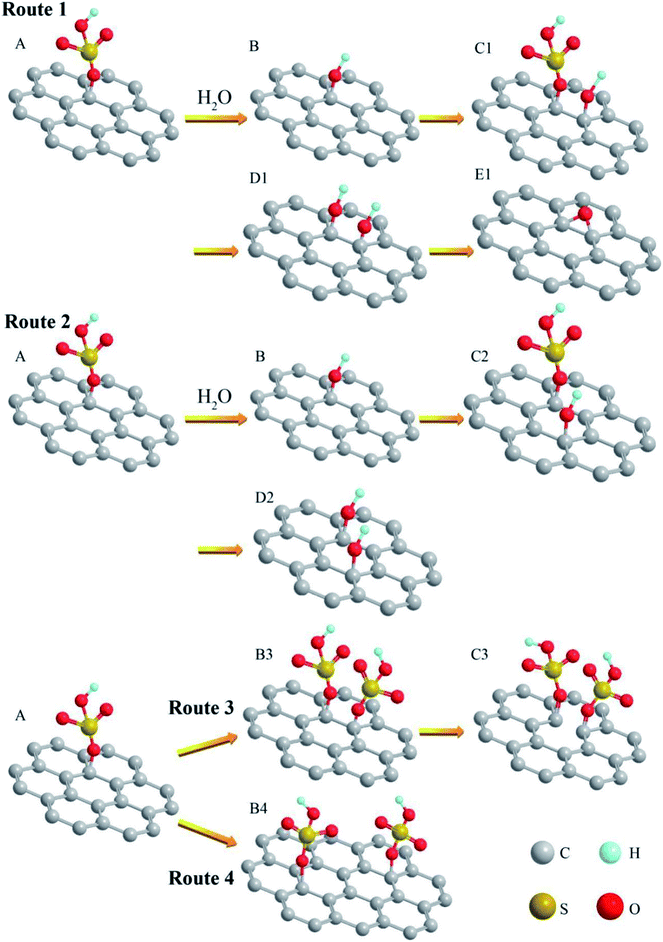
To further understand the reaction mechanism of GO, we propose a series of molecular models for the involved reactions. The first model (Fig. 7A) is assumed to start with GIC. When another HSO4− group intercalates into the graphite basal plane, the original HSO4− group will generate steric hindrance to hinder the continued insertion of the HSO4− group. On the other hand, when a water molecule is present, part of the water would ionize to form hydrogen ions (H+) and hydroxide ions (OH−). In order to reduce the steric hindrance, in Route 1 and Route 2, part of the HSO4− groups on the graphite plane could exchange with the hydroxides, generating hydroxyl groups as illustrated in Fig. 7B and H2SO4. The hydroxyl group has a smaller mass and volume than the HSO4− group, so the resulting steric hindrance is reduced. Then the next HSO4− groups can intercalate into the graphite plane more easily. The newly formed H2SO4 can slow down the decrease of H2SO4 concentration in the oxidation reaction.
In Route 1, if another intercalated HSO4− group is adjacent to the original hydroxyl (OH−) group (Fig. 7C1), the newly inserted HSO4− group could react with water, generating a hydroxyl group (Fig. 7D1). Eventually, two adjacent hydroxyl groups (OH−) could react and lose a water molecule to form an epoxy group. In Route 2, if the newly intercalated HSO4− group is relatively far away from the original hydroxyl group, it could also react with water to produce a new hydroxyl group (Fig. 7D2), but the new hydroxyl group may not react with the original hydroxyl group (OH−) to produce an epoxy group. Therefore, in Route 1 the GIC are more likely to form epoxy groups. In Route 2, GIC are more likely to form hydroxyl groups.
If the reaction uses 99% H2SO4, there is little moisture in the system, the migration of the particles would be slow, and the hydroxyl ions were difficult to form in the system. In the model of GIC (Fig. 7A), the HSO4− group cannot exchange with hydroxyl (OH−). In Route 4, the large steric hindrance could allow another HSO4− group to be intercalated away from the original HSO4− group (Fig. 7B4). Eventually it could lead to a decrease in the number of HSO4− groups on the graphite basal plane. The corresponding number of hydroxyl groups in GO is therefore reduced. In another case (Route 3), the next HSO4− group is intercalated into adjacent C atom (Fig. 7B3), the C–C bonds are likely broken by the action of steric hindrance and oxidant. Structural defects (Fig. 7C3) are therefore generated on the graphitic plane. These defects could even help form edges and are easy to produce carbonyl groups.
During the formation of graphite oxide, diamanganese heptaoxide (Mn2O7) served as the oxidizing agent that is created in the following reactions46
| KMnO4 + 3H2SO4 → K+ + MnO3+ + 3HSO4− + H+ + H2O | (1) |
| KMnO4 → K+ + MnO4− | (2) |
| MnO3+ + MnO4− → Mn2O7 | (3) |
| Mn2O7 + H2O → 2HMnO4 | (4) |
In reaction (1), water (H2O) is produced. In reaction (3), Mn2O7 is produced from the reaction between MnO3+ and MnO4−. The bimetallic heptoxide is far more oxidizing than monometallic tetraoxide.47
Another effect of water molecules in the reaction is also the reason why GO-1 is different from GO-4. Manganese heptaoxide (Mn2O7) can react with water to regenerate permanganic acid (HMnO4). Permanganic acid (HMnO4) and manganese trioxide (MnO3+) can also react to produce manganese heptaoxide (Mn2O7). The water molecules can adjust the ratio of various oxidants in the reaction, so that the oxidants of the entire reaction are in a dynamic equilibrium, preventing excessive oxidation of graphite to produce carbonyl groups. Therefore, GO-1 prepared with an anhydrous reaction has a higher carbonyl ratio than GO-4.
4. Conclusions
The water molecules in H2SO4 have a significant effect on the oxidation of graphite in the preparation of graphene oxide. The water molecule is more conducive to the oxidation of graphite to produce epoxy and hydroxyl functional groups, while reducing the occurrence of structural defects. These results suggest that the 93% H2SO4 could disrupt the basal plane of the graphite less than 99% H2SO4. As a result, GO obtained with 93% H2SO4 shows best properties, such as solubility and stability. According to the XRD analysis, GO obtained with 93% H2SO4 also has the largest (0.91 nm) average interlayer spacing. The Raman analysis showed the ID/IG ratio for GO-4 obtained with 93% H2SO4 is lower than GO-1 obtained with 99% H2SO4, indicating a less defective structure of GO-4.Conflicts of interest
There are no conflicts to declare.References
- A. K. Geim and K. S. Novoselov, Nat. Mater., 2007, 6, 183–190 CrossRef CAS PubMed.
- Y. Xu and G. Shi, J. Mater. Chem., 2011, 21, 3311–3323 RSC.
- J. Zhang, T. Tian, Y. Chen, Y. Niu, J. Tang and L. C. Qin, Chem. Phys. Lett., 2014, 591, 78–81 CrossRef CAS.
- S. Guo, Y. Zhang, Y. Ge, S. Zhang, H. Zeng and H. Zhang, Adv. Mater., 2019, 31, 1902352 CrossRef PubMed.
- J. Pei, J. Yang, Y. Tanju, H. Zhang and Y. Lu, Adv. Mater., 2017, 31, 1706945 CrossRef PubMed.
- J. He, L. Tao, H. Zhang, B. Zhou and J. Li, Nanoscale, 2019, 11, 2577–2593 RSC.
- D. R. Dreyer, S. Park, C. W. Bielawski and R. S. Ruoff, Chem. Soc. Rev., 2009, 39, 228–240 RSC.
- O. C. Compton and S. B. T. Nguyen, Small, 2010, 6, 711–723 CrossRef CAS PubMed.
- D. R. Dreyer, A. D. Todd and C. W. Bielawski, Chem. Soc. Rev., 2014, 43, 5288–5301 RSC.
- L. G. Guex, B. Sacchi, K. Peuvot, R. L. Andersson and R. T. Olsson, Nanoscale, 2017, 9, 9562–9571 RSC.
- D. A. Dikin, S. Stankovich, E. J. Zimney, R. D. Piner, G. H. B. Dommett, G. Evmenenko, S. T. Nguyen and R. S. Ruoff, Nature, 2007, 448, 457–460 CrossRef CAS.
- B. C. Brodie, Philos. Trans. R. Soc. London, 1859, 149, 249–259 CrossRef.
- W. S. Hummers and R. E. Offeman, J. Am. Chem. Soc., 1958, 208, 1334–1339 Search PubMed.
- S. Shamaila, A. K. L. Sajjad and A. Iqbal, Chem. Eng. J., 2016, 294, 458–477 CrossRef CAS.
- V. V. Avdeev, L. A. Monyakin, I. V. Nikol’skay, N. E. Sorokin and K. N. Semenenko, Carbon, 1992, 30, 819–823 CrossRef CAS.
- P. V. Lakshminarayanan, H. Toghiani and C. U. Pittman Jr, Carbon, 2004, 42, 2433–2442 CrossRef CAS.
- N. Zhang, L. Y. Wang, H. Liu and Q. K. Cai, Surf. Interface Anal., 2010, 40, 1190–1194 CrossRef.
- Y. Kopelevich and P. Esquinazi, Adv. Mater., 2007, 19, 4559–4563 CrossRef CAS.
- A. A. Balandin, S. Ghosh, W. Bao, I. Calizo, D. Teweldebrhan, F. Miao and C. N. Lau, Nano Lett., 2008, 8, 902–907 CrossRef CAS PubMed.
- S. F. Pei and H. M. Cheng, Carbon, 2012, 50, 3210–3228 CrossRef CAS.
- S. Stankovich, D. A. Dikin, R. D. Piner, K. A. Kohlhaas, A. Kleinhammes, Y. Jia, Y. Wu, S. B. T. Nguyen and R. S. Ruoff, Carbon, 2007, 45, 1558–1565 CrossRef CAS.
- X. Gao, J. Jang and S. Nagase, J. Phys. Chem. C, 2010, 114, 832–842 CrossRef CAS.
- D. C. Marcano, D. V. Kosynkin, J. M. Berlin, A. Sinitskii, Z. Sun, A. Slesarev, L. B. Alemany, W. Lu and J. M. Tour, ACS Nano, 2010, 4, 4806–4814 CrossRef CAS PubMed.
- D. W. Kang and H. S. Shin, Carbon Lett., 2012, 13, 39–43 CrossRef.
- L. Zhang, J. Liang, Y. Huang, Y. Ma, Y. Wang and Y. Chen, Carbon, 2009, 47, 3365–3368 CrossRef CAS.
- A. M. Dimiev, S. M. Bachilo, R. Saito and J. M. Tour, ACS Nano, 2012, 6, 7842–7849 CrossRef CAS PubMed.
- P. C. Eklund, C. H. Olk, F. J. Holler, J. G. Spolar and E. T. Arakawa, J. Mater. Res., 1986, 1, 361–367 CrossRef CAS.
- T. Szabó, O. Berkesi, P. Forgó, K. Josepovits, Y. Sanakis, D. Petridis and I. Dékány, Chem. Mater., 2006, 18, 2740–2749 CrossRef.
- H. He, T. Riedl, A. Lerf and J. Klinowski, J. Phys. Chem., 1996, 100, 19954–19958 CrossRef CAS.
- L. Peng, Z. Xu, Z. Liu, Y. Wei, H. Sun, Z. Li, X. Zhao and C. Gao, Nat. Commun., 2015, 6, 5716 CrossRef CAS PubMed.
- J. T. Robinson, F. K. Perkins, E. S. Snow, Z. Wei and P. E. Sheehan, Nano Lett., 2008, 8, 3137–3140 CrossRef CAS PubMed.
- Y. Aoi, K. Ono and E. Kamijo, J. Appl. Phys., 1999, 86, 2318–2322 CrossRef CAS.
- Q. Du, M. Zheng, L. Zhang, Y. Wang and J. Cao, Chem. Res., 2010, 55, 3897–3903 CAS.
- H. C. Schniepp, JeL. Li, M. J. McAllister, H. Sai, M. HerreraAlonso, D. H. Adamson, R. K. Prud'homme, R. Car, D. A. Saville and I. A. Aksay, J. Phys. Chem. B, 2006, 110, 8535–8539 CrossRef CAS PubMed.
- C. Gómez-Navarro, J. C. Meyer, R. S. Sundaram, A. Chuvilin and U. Kaiser, Nano Lett., 2010, 10, 1144–1148 CrossRef.
- K. N. Kudin, B. Ozbas, H. C. Schniepp, R. K. Prud'Homme, I. A. Aksay and R. Car, Nano Lett., 2008, 8, 36–41 CrossRef CAS.
- F. Tuinstra and J. L. Koenig, J. Chem. Phys., 1970, 53, 1126–1130 CrossRef CAS.
- G. Venugopal, M.-H. Jung, M. Suemitsu and S.-J. Kim, Carbon, 2011, 49, 2766–2772 CrossRef CAS.
- J. Chen, Y. Li, L. Huang, C. Li and G. Shi, Carbon, 2015, 81, 826–834 CrossRef CAS.
- Y. Xu, K. Sheng, C. Li and G. Shi, J. Mater. Chem., 2011, 21, 7376–7380 RSC.
- I. Jung, D. A. Dikin, R. D. Piner and R. S. Ruoff, Nano Lett., 2008, 8, 4283–4287 CrossRef CAS PubMed.
- D. Li, M. B. Müller, S. Gilje, R. B. Kaner and G. G. Wallace, Nat. Nanotechnol., 2008, 3, 101–105 CrossRef CAS PubMed.
- S. Eigler, C. Dotzer, A. Hirsch, M. Enzelberger and P. Müller, Chem. Mater., 2012, 24, 1276–1282 CrossRef CAS.
- M. J. Mcallister, J.-L. Li, D. H. Adamson, H. C. Schniepp, A. A. Abdala, J. Liu, M. Herrera-Alonso, D. L. Milius, R. Car, R. K. Prud'Homme and I. A. Aksay, Chem. Mater., 2007, 19, 4396–4404 CrossRef CAS.
- V. Agarwal and P. Zetterlund, Chem. Eng. J., 2020, 405, 127018 CrossRef.
- K. R. Koch, J. Chem. Educ., 1982, 59, 973–974 CrossRef CAS.
- A. Simon, R. Dronskowski, B. Krebs and B. Hettich, Angew Chem. Int. Ed. Engl., 1987, 26, 139–140 CrossRef.
Footnote |
| † Electronic supplementary information (ESI) available. See DOI: 10.1039/d0ra10026a |
| This journal is © The Royal Society of Chemistry 2021 |

