 Open Access Article
Green synthesis of ZnO coated hybrid biochar for the synchronous removal of ciprofloxacin and tetracycline in wastewater†
Abisola O. Egbedina *a,
Kayode O. Adebowalea,
Bamidele I. Olu-Owolabia,
Emmanuel I. Unuabonahb and
Morenike O. Adesinabc
aDepartment of Chemistry, Faculty of Science, University of Ibadan, Oduduwa Road, Nigeria. E-mail: adeyemoabisola@yahoo.com
bAfrican Centre of Excellence for Water and Environment Research (ACEWATER), Redeemer's University, PMB 230, Ede, Osun State, Nigeria
cDepartment of Chemical Sciences, Lead City University, Ibadan, Nigeria
First published on 24th May 2021
Abstract
Preparation of biochar from kaolinite and coconut husk (KCB) and further activated with HCl (KCB-A) and KOH (KCB-B) via a microwave technique for the remediation of ciprofloxacin (CIP) and tetracycline (TET) from water was carried out. Characterization using scanning electron microscopy, energy dispersive X-ray, Fourier transform infrared spectroscopy and X-ray diffraction showed the successful synthesis of functionalized biochars. Batch adsorption experiments demonstrated the potential of the adsorbents for fast and efficient removal of CIP and TET from solution. The adsorption capacities were found to be 71, 140 and 229 mg g−1 for CIP and 118, 117 and 232 mg g−1 for TET removal on KCB, KCB-A and KCB-B, respectively. For KCB, KCB-B and KCB-B, CIP adsorption best followed the pseudo second order kinetic model (PSOM), pseudo first order kinetic model (PFOM) and intraparticle diffusion (IDP) respectively. TET adsorption followed PSOM for KCB, IPD for KCB-B and PFOM for KCB-A. CIP adsorption on KCB, KCB-A and KCB-B best fit the Temkin, Langmuir and Brouers–Sotolongo isotherms, respectively, and TET adsorption on KCB best fit Brouers–Sotolongo while KCB-A and KCB-B best fit Langmuir–Freundlich. Adsorption of both contaminants was thermodynamically feasible showing that these materials are excellent adsorbents for the treatment of pharmaceuticals in water.
1. Introduction
Antibiotics are indispensable in the treatment of infectious diseases of humans and animals. Of the various antibiotics currently in use, ciprofloxacin, a member of the fluoroquinoline family, and tetracycline, a broad spectrum antibiotic, are the most commonly used in the treatment of bacterial infections and as animal growth promoters1,2 and both have been classified as high priority emerging organic pollutants by the World Health Organisation (WHO).3,4As a result of their widespread use, coupled with inadequate treatment of wastewater and their discharge into the environment, they have been detected in various systems such as soil, sediment, surface, ground and drinking waters including living tissues and this has raised concerns about their toxicity.5,6 Even at low concentrations they have resulted in increase in antibacterial-resistant strains of organisms along with other adverse health effects such as stomatitis, leukopenia. In addition, their presence in the environment results in aquatic toxicity, genotoxicity.6,7 Increase in population and continued usage coupled with indiscriminate discharge into the environment is expected to cause further rise in these species. Once these pollutants reach water sources, they are able to transfer to other non-point sources. Antibiotics especially are difficult to degrade and 30–90% of administered doses remain undegraded in an organism.6 The widespread use of antibiotics as promoters of good health ensures that they are continually used and discharged into the environment either in the form in which they were used or in their sometimes more toxic metabolite form. Their toxic effects coupled with their incessant input into the environment have led to policy makers, government agencies and the scientific community to promote technologies and strategies for the treatment of waters polluted by these substances.8
Wastewater treatment plants using conventional treatment methods have been found to be inadequate in the complete removal of these pollutants.6 Advanced techniques have shown promising success in the removal of these pollutants. These methods are as varied as the physicochemical characteristics of each antibiotic compound. Oxidation processes have the disadvantages of high cost, incomplete mineralization and the production of even more toxic metabolites.6 Low pressure membranes such as microfiltration, ultrafiltration and loose nanofiltration are limited due to their pore sizes while reverse osmosis, nanofiltration techniques have been found to have incomplete rejection as high as 95%.9 Adsorption however does not result in generation of toxic by-products; is efficient; versatile; offers ease of operation and employs the use of low-cost materials as adsorbents10 and is easily incorporated into current wastewater treatment processes.11
Biochar has attracted the attention of researchers as an adsorbent material due to its high porosity, surface area and adsorption capabilities,12 the availability of diverse feedstock and ease of production,13 low-cost and environmentally friendly nature.4 Several materials have been utilized as starting precursors for biochar manufacture including mangosteen shells,14 poplar wood,15 sewage sludge,16 corn straw17 and sugarcane bagasse.18
In this study, biochar material prepared from a hybrid of two low-cost precursors was functionalized in situ followed by further activation to improve the physicochemical properties of the adsorbents while their efficiency for the simultaneous removal of ciprofloxacin and tetracycline under a range of experimental parameters was evaluated.
2. Materials and method
2.1. Materials
Kaolinite clay was obtained from Federal Institute of Industrial Research Oshodi (FIIRO), Lagos State, Nigeria. Coconut husks were obtained from local markets in Ibadan, Oyo State, Nigeria. Ciprofloxacin (CIP), tetracycline (TET) and zinc chloride were obtained from Sigma-Aldrich. All chemicals were used as received.2.2. Synthesis of hybrid biochar (KCB)
Firstly, the clay was purified according to the method reported by ref. 19 (see ESI†). Coconut husks were washed with distilled water, sun-dried and milled. Kaolinite clay, biomass and ZnCl2 were thoroughly mixed in a mass ratio of 1![[thin space (1/6-em)]](https://www.rsc.org/images/entities/char_2009.gif) :
:![[thin space (1/6-em)]](https://www.rsc.org/images/entities/char_2009.gif) 1
1![[thin space (1/6-em)]](https://www.rsc.org/images/entities/char_2009.gif) :
:![[thin space (1/6-em)]](https://www.rsc.org/images/entities/char_2009.gif) 2 respectively. 10 mL of 0.1 M NaOH was added with constant stirring for 12 h after which it was transferred to an oven at 150 °C for 24 h to allow for impregnation. Then, the impregnated mixture was heated under microwave irradiation at 540 W for 10 min after which it was washed several times with distilled water until pH 7 to remove excess NaOH and ZnCl2. The obtained sample was dried at 105 °C, cooled and stored in an airtight container labeled KCB.
2 respectively. 10 mL of 0.1 M NaOH was added with constant stirring for 12 h after which it was transferred to an oven at 150 °C for 24 h to allow for impregnation. Then, the impregnated mixture was heated under microwave irradiation at 540 W for 10 min after which it was washed several times with distilled water until pH 7 to remove excess NaOH and ZnCl2. The obtained sample was dried at 105 °C, cooled and stored in an airtight container labeled KCB.
2.3. Activation of KCB
1 g each of KCB was added to 50 mL of either 0.1 M KOH or 2 M HCl in a beaker. The mixtures were stirred constantly for 1 h after which they were filtered and washed severally until neutral pH. This was followed by drying at 105 °C. The samples obtained were stored and labelled KCB-A and KCB-B for acid and alkali activated samples respectively.2.4. Surface characterization
The mineralogical compositions and crystallinity of the adsorbents were determined via X-ray diffraction (XRD) with patterns recorded on a BRUKER AXS (Germany) D8 Advance X-ray Diffractometer and operated in a continuous Θ–Θ scan in locked coupled mode with Cu–K radiation. Surface characteristics and elemental compositions of the adsorbents were determined using scanning electron microscopy (SEM: BRUKER) with an operating voltage of 20 kV equipped with energy dispersive X-ray (EDX). Fourier transformed infrared spectroscopy (FTIR) spectra of the biochars were obtained using Shimadzu FT-IR 8400S (class 1, Laser product) Spectrophotometer. The pH at point of zero charge (pHpzc) was determined by using the salt addition method as described by ref. 20.2.5. Batch adsorption experiments
Equilibrium adsorption experiments were performed in batch mode by agitating 50 mg of each adsorbent with 10 mL aqueous solution of either CIP or TET with concentrations ranging from 10–150 mg L−1 for 2 h to determine the equilibrium adsorption capacity of the adsorbents. The solutions were filtered and the residual concentrations of the pollutants in solution were determined using a UV-vis spectrophotometer (Shimadzu UV-1650 pc) at wavelengths of 277.5 nm and 355 nm for CIP and TET respectively, determined after scanning. The adsorption capacity for each pollutant was estimated using eqn (1) below:
 | (1) |
Kinetic studies were carried out by reacting 500 mg of each adsorbent with 100 mL of CIP or TET. 10 mL of each solution was withdrawn using a syringe at predetermined time intervals (within 1 h). Results were analysed with five kinetic models: the pseudo first-order (PFOM), pseudo second-order (PSOM), Bruoers–Sotolongon fractal kinetics (BSF), intraparticle diffusion (IDP) and Elovich (E) kinetic models. Details of both isotherm and kinetic models are given in Tables S1 and S2 (ESI†).
3. Results and discussion
3.1 Surface characterization
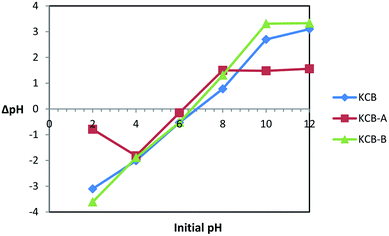
pHpzc is the pH that indicates the net surface charge on adsorbents in solution. The ease of adsorption of molecules or ions to the surface of adsorbents is dependent on the pHpzc of such material. The information provided by the pHpzc is useful in understanding and manipulating the best pH at which a particular adsorbate can be removed from solution by altering the net surface charge of a material to be used as an adsorbent in solution. KCB, KCB-A and KCB-B were found to have pHpzc of 6.8, 6.0 and 6.6 respectively (Fig. 1). Below these values, the surface charge on the adsorbent in solution is positive and above this value, the charge on the adsorbent is negative.Activation was found to alter the surface chemistry of KCB. KCB-A showed reduced pHpzc values compared with KCB. This is attributed to acid treatment of the sample which lowered its pHpzc value due to the introduction of functional groups on the surface of the adsorbent that increased the acidic surface oxides.21
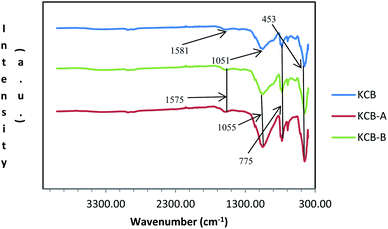
Fig. 2 shows the FTIR spectra of the adsorbents. The loss of the external hydroxyls usually associated with kaolinite can be due to the effect of heat during the modification process.22 The absorption shown by the very weak band at around 1580 cm−1 can be attributed to H–O–H bending of kaolinite. The presence of Zn–O absorption peak in the adsorbent is shown by absorption at around 453 cm−1 which is attributed to the ZnCl2 used during the modification. The broad band at 1055 cm−1 is due to the presence of Al–Si–O stretching of amorphous aluminosilicates which shifted to 1051 cm−1 in KCB-A and KCB-B. The peak observed at about 775 cm−1 indicates Si–O vibrations of the quartz while the peak appearing at about 800 cm−1 indicates the presence of Al–O–H bond vibrations. Activation with either acid or alkali was found to increase the intensity of these peaks. Similar results were reported22 for the synthesis of a kaolinite/pawpaw composite (HYCA).
The SEM images of KCB, KCB-A and KCB-B as shown in Fig. 3(a–c) show that the adsorbent pores have irregular shapes and sizes majorly ellipsoidal and are heterogeneously distributed. Their sharp edges also suggest good crystallinity.23 The adsorbents are highly porous with pore sizes ranging from 7 μm to 20 μm which indicates the heterogeneous nature of the adsorbents. The presence of Zn is seen from the scattering of particles on the surface of the adsorbents showing its aggregation on the surface of the adsorbent rather than incorporation into the structure. Surface structure of KCB changed slightly after modification with both acid and alkali. Activation also appears to unblock some pores resulting in the generation of more visible pores than that seen for KCB.24
Elemental (EDX) analysis (Table 1) confirms the carbonization of the precursors25 which resulted in a higher carbon content than kaolinite (0.16%)22 and coconut husk (20%).26 Activation of KCB further increased the amount of carbon by approx. 100% to give 89% and 81% in KCB-A and KCB-B respectively which shows that activation improved upon the surface properties of KCB-A and KCB-B.
| Atoms | Lines | KCB | KCB-A | KCB-B |
|---|---|---|---|---|
| C | K-series | 43.20 | 89.27 | 80.58 |
| Si | K-series | 38.71 | 4.11 | 1.50 |
| O | K-series | 7.26 | 5.99 | 6.16 |
| Zn | K-series | 5.15 | — | 7.41 |
| Fe | K-series | 3.86 | — | 1.36 |
| Ca | K-series | 1.20 | — | 0.84 |
| Cl | K-series | 0.62 | 0.54 | 0.57 |
| K | K-series | — | — | 1.58 |
| Al | K-series | — | 0.09 | — |
| Total | 100 | 100 | 100 |
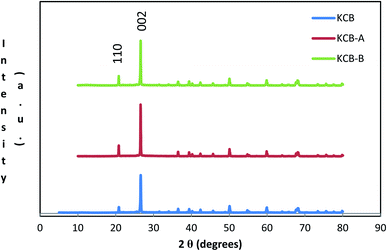
XRD further confirms the result of FTIR (Fig. 4). It displays characteristic diffraction peaks of kaolinite at 2Θ of 20.81° and 26.61° for KCB and 20.80° and 20.57° for both KCB-A and KCB-B corresponding to the reflections from (110) and (002) plane respectively. This suggests that the crystal structure of kaolinite is not affected by modification with the biomass or the synthesis process. Activation of KCB with either acid or alkali resulted in an increase in the intensity of the peaks. This is attributed to structural disorder which affected the crystallinity of the sample.27 The full width at maximum height (FWMH) is used to determine the Lc which is a measure of crystallite size and obtained using the Debye-Scherrer equation (eqn (2)).28
 | (2) |
The values of 5.4, 5.4 and 6.1 nm were obtained as the crystallite sizes for KCB, KCB-A and KCB-B respectively (Fig. 5).
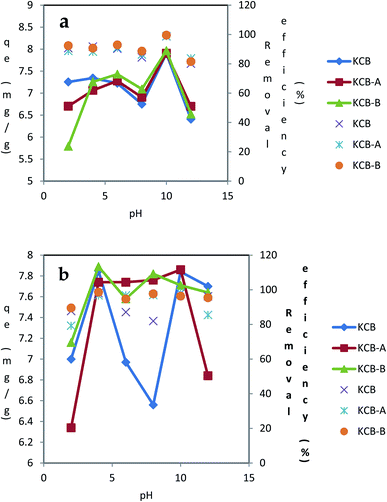 | ||
| Fig. 5 Effect of pH on the adsorption of (a) TET (b) CIP using KCB, KCB-A and KCB-B (initial concentration = 40 mg L−1; contact time = 60 minutes; adsorbent dosage = 0.05 g; temperature = 303 K). | ||
3.2 Adsorption performance
The plots of the effect of pH (2–12) on the adsorption of CIP and TET with an initial concentration of 40 mg L−1 are shown in Fig. 6. For the 3 adsorbents, the removal of TET was higher in basic medium (pH 10) than in acidic medium. At this pH, the surfaces of these adsorbents are expected to be negatively charged. TET is negatively charged at this pH, occurring as a divalent anionic species. It is expected that under these conditions, repulsion mechanism will be activated leading to decrease in adsorption. However, there was an increase in adsorption showing a higher affinity of the adsorbents for this divalent form of TET. It is also a testament to the fact that electrostatic interactions is not at play between TET and the adsorbents. Further increase in pH from 10 to 12 resulted in a decrease in adsorption. For CIP adsorption on KCB-A, there was an increase in adsorption up to pH 4. Between pH 4 and 10, there was no significant change in adsorption as the solution moved from being acidic to alkaline. At pH 12 however, there was a sharp decline in adsorption with further increase in pH. The pHpzc of KCB-A is 6.0. Below this pH, the surface of this adsorbent is positively charged.
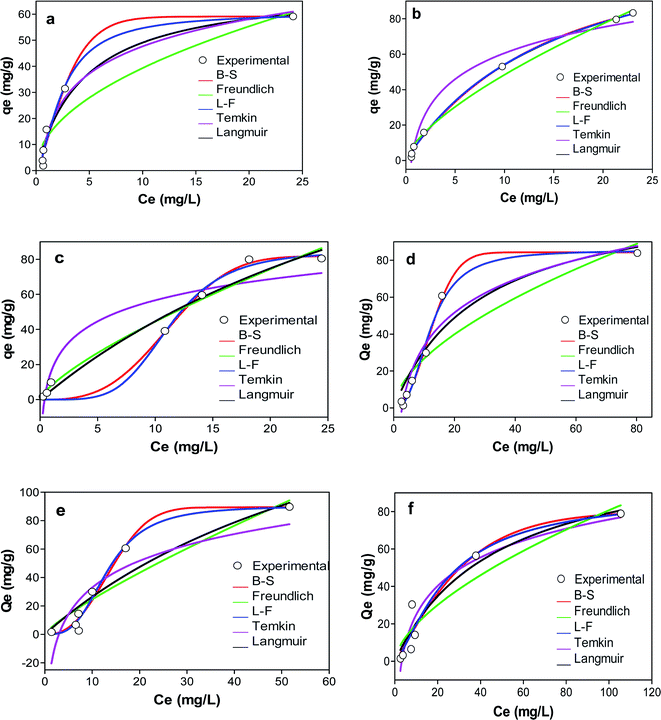 | ||
| Fig. 6 Graphs showing the adsorption isotherms of (a) KCB (b) KCB-A (c) KCB-B on CIP (d) KCB (e) KCB-A and (f) KCB-B on TET. | ||
On the other hand, at pH below 6.1, CIP exists as a cation, as an anion beyond 9 and as a neutral molecule between 6.1 and 8.9. With this information, it is expected that there will be a decline in adsorption at pH below 6. Based on experimental observations, this was not the case. Rather than a decline in adsorption at pH less than 6, there was a steady rise in adsorption up to pH 4. This result shows that adsorption could not have been due to electrostatic interactions between the adsorbent and the adsorbate. This phenomenon has been suggested to be due to the suppression of electrostatic interactions by the hydrophobicity of CIP.30 Between pH 6 and 8, the adsorption was steady, averaging 97%. Non-polar adsorbents are capable of adsorbing organic pollutants which exist in molecular form31 which could explain the higher adsorption at those pH values. Also at pH beyond 9, CIP is anionic while the adsorbent is negatively charged. This should result in a decline in adsorption as a result of electrostatic repulsion. This led to a decrease in adsorption from pH 10. However, this decline in adsorption from pH 10 could be attributed to decrease in hydrophobicity of CIP rather than electrostatic repulsions between the adsorbent and adsorbate as hydrophobicity has been found to reduce with the formation of anions. KCB-B on CIP showed an increase in adsorption up to pH 4. Between pH 4 and 8 where the CIP molecules are expected to be neutral, there was a decline in adsorption capacity. At that pH too, the surface of the adsorbent is positively charged which could be responsible for the decline in adsorption because beyond the pHpzc of the adsorbent where its surface becomes increasingly negative and deprotonation of the second amine group of CIP begins to occur, adsorption increases slightly. As soon as the negative charge on the adsorbent is fully established and CIP becomes fully deprotonated at pH beyond 8, adsorption capacity declines. KCB also shows a similar adsorption pattern to KCB-B except that the decrease extends from pH 4 to 8. There was increase in adsorption capacity from pH 8 to 10 followed by a final decline in adsorption. Adsorption of CIP and TET onto these adsorbents have been attributed to take place via a series of mechanisms notably π–π interactions, hydrophobic interactions, London dispersion forces, hydrogen bonding or van der Waals forces.32
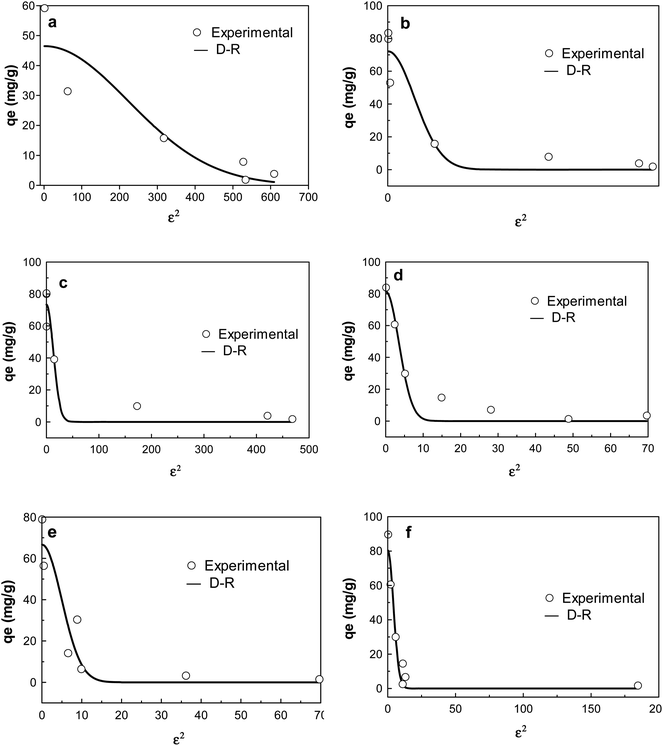 | ||
| Fig. 7 D–R isotherm plots of adsorption of CIP on (a) KCB (b) KCB-A (c) KCB-B; TET on (d) KCB (e) KCB-A and (f) KCB-B. | ||
The D–R isotherm is applied to estimate the porosity apparent free energy and the characteristics of adsorption. The value of E, which represents the free mean energy (kJ mol−1) was obtained (Table S1†). An E value < 8 kJ mol−1 is indicative of physical adsorption.33 The value of E for the adsorption of TET on the adsorbents and KCB on CIP were less than 8 kJ mol−1 showing that the mechanisms of adsorption were physical in nature. This was corroborated by the enthalpy values obtained for thermodynamics studies (Table S3†).
The heterogeneity factor (n) in the Freundlich model indicates the degree of heterogeneity and hence how favourable the adsorption is.33 The value of Freundlich constant, n was greater than 1 for all adsorbents on both CIP and TET indicating that the adsorption was favourable at studied conditions. This is corroborated by the n factor predicted using L–F model and further buttressed by the value of the dimensionless constants, RL which were all less than one. The surface heterogeneities of the adsorbents are confirmed by the presence of various functional groups present on the adsorbents (Fig. 2).
The experimental data were further modelled with three-parameter isotherm models in a bid to improve the precision of analysis. Comparison of the R2 showed better fitting when compared with the two parameter isotherm models. Of the three models however, L–F isotherm, a model that combines the features of Langmuir and Freundlich isotherms was the best fit for the adsorption of CIP (R2 > 0.98) while B–S isotherm was the best fit for adsorption of TET (R2 > 0.997 and R2 > 0.969 for KCB and KCB-A respectively) except by KCB-B whose adsorption best fit L–F (R2; error analysis). L–F is used for predicting the heterogeneous nature of the adsorption system while circumventing the limitation of high adsorbate concentrations of Freundlich.34 This shows that both monolayer and multilayer are occurring simultaneously within the system, indicating that the adsorption could be driven by more than one force of attraction. Studies have shown that for most organic pollutants, a number of bonding mechanisms such as electrostatic interactions, ion-exchange, π–π interactions, H-bonding or hydrophobic interactions occur in tandem during the adsorption process.34,35
The fit of the experimental data with B–S isotherm is used to predict the adsorption capacity of the adsorbents for complex, heterogeneous systems involving sorbent materials with different chemical characteristics.36 The high R2 values (R2 > 0.999) observed for both CIP and TET for this model show that the adsorbents possess heterogeneous active sites. The adsorption capacities obtained for these adsorbents are seen to be higher when compared with those obtained for other agrogenic materials in previous studies as can be seen in Table 2 indicating the higher potential of these adsorbents for CIP and TET removal.
| Adsorbent | Pollutant | qmax (mg g−1) | Ref. |
|---|---|---|---|
| Pistachio shell powder coated ZnO nanoparticles | CIP | 98.72 | 37 |
| Eu doped SrAl2O4 composite | CIP | 7.10 | 38 |
| Reduced GO/magnetite composite | CIP | 18.98 | 16 |
| Poly(1-trimethystilyl-1-propyne) | CIP | 33.10 | 39 |
| Aluminum-pillared kaolin sodium alginate beads | CIP | 68.36 | 40 |
| Clay/coconut husk biochar | CIP | 71 | This study |
| HCl-activated clay/coconut husk biochar | CIP | 140 | This study |
| KOH-activated clay/coconut husk biochar | CIP | 232 | This study |
| Pistachio shell powder coated ZnO nanoparticles | TET | 92 | 37 |
| Eu doped SrAl2O4 composite | TET | 26 | 38 |
| KOH-activated reed biochar | TET | 146 | 41 |
| Wood biochar | TET | 120 | 7 |
| α-Fe2O3/reduced graphene oxide | TET | 39 | 42 |
| Clay/coconut husk biochar | TET | 118 | This study |
| HCl-activated clay/coconut husk biochar | TET | 117 | This study |
| KOH-activated clay/coconut husk biochar | TET | 232 | This study |
 | (3) |
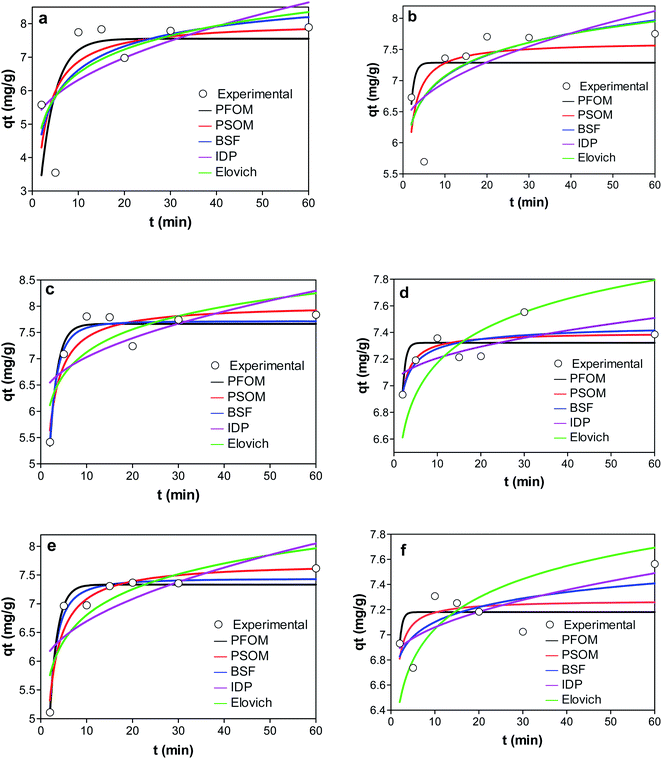 | ||
| Fig. 8 Graphs showing the adsorption kinetics of (a) KCB (b) KCB-A (c) KCB-B on CIP (d) KCB (e) KCB-A and (f) KCB-B on TET. | ||
Of the kinetic models studied, the PFOM best described the adsorption of KCB and KCB-B for CIP adsorption and KCB-A and KCB-B for TET adsorption. Pseudo first order kinetic model works best at high concentrations showing that a high concentration of pollutants can be successfully removed.7
Though PFOM fits only over the initial 20–30 minutes of adsorption,31 it is suitable for the removal of these pollutants as most of the pollutants were removed within that frame of time. On the other hand, PSOM gave the best fit for the data on CIP adsorption by KCB-A as well as TET adsorption by KCB. This indicates that the adsorption worked well over the whole range of adsorption time and follows the chemisorption process. It can also be said that the adsorption capacity was positively related to the amount of active sites on the adsorbent. Higher values of h observed for the activated adsorbents are attributed to additional adsorption sites created by increasing functional groups brought about by chemical activation. This is further confirmed by the fitting with intraparticle diffusion (IPD) kinetic model. The rate constants as an indication of how fast the adsorption is show that the rates of adsorption by the activated adsorbents were faster than the inactivated adsorbent. It has been shown that if K1 is greater than K2, the adsorption is restricted by internal diffusion.45 The results in Table S2† suggest that internal diffusion occurred in addition to surface adsorption. If intraparticle is the sole limiting step, a plot of qt versus t0.5 should pass through the origin. The line of fit did not pass through the origin, showing that intraparticle diffusion alone is not the sole rate limiting step and that surface diffusion could also have contributed to the process46 making the mechanism all the more complex. The high KIPD values obtained for the adsorbents could be proportional to the number of functional sites produces by activation and this is supported by the h values reported earlier. The values of C obtained are an indication of the boundary layer thickness between the adsorbate and adsorbent.47 The low value of C obtained for the adsorption shows that they are less affected by boundary layer with low resistance to external mass transfer. KCB-A and KCB-B were least affected by boundary layer when compared to KCB showing that activation had an impact on the mechanism of transfer of adsorbate to adsorbent.44 Brouers–Sotolongo fractal kinetic model, BSF is used to describe complex adsorption systems by predicting that the adsorption followed a first order mechanism. This closeness of the qe values obtained from this model to the experimental qe suggests that adsorption onto these adsorbents is via a complex mechanism involving various forces of attraction including the weak van der Waal forces.48 This suggests that the adsorption sites of these adsorbents are heterogeneous in nature. On the other hand, Elovich model presented the worst prediction. This model does not propose a definite mechanism for the adsorption process.49 This finding strengthens the prediction that the adsorption mechanism occurred via a series of complex mechanisms.
The positive ΔS obtained for adsorption of CIP on KCB and KCB-A suggested an irreversible process and is indicative of structural changes happening within the system, an increase in randomness at the solid/solution interface upon adsorption. This reflects greater affinity of the adsorbates for the adsorbents with increase in temperature.33
4. Conclusion
This study reports the utilization of adsorbents prepared by microwave technology from low-cost, underutilized biomass in the successful removal of antibiotics pollutants from simulated wastewater. Pseudo first order kinetic model (PFOM) provided a better fit to the kinetic data for CIP adsorption KCB-B and TET adsorption on KCB-A. Pseudo second order kinetic model (PSOM) explained best the adsorption of CIP and TET on KCB while intraparticle diffusion (IDP) provided the best fit for CIP adsorption on KCB-A and TET adsorption on KCB-B. The adsorption isotherm models showed that the adsorbents prepared were very effective in the removal of CIP and TET with the chemically activated adsorbents showing greater affinity. Thermodynamics analyses indicate that the adsorption was spontaneous and favourable. These results demonstrate that these adsorbents provide alternative readily available, low-cost and reusable materials that can successfully replace activated carbon in wastewater treatment.Author contributions
Abisola Egbedina: writing – original draft, methodology, investigation, formal analysis. Kayode Adebowale: conceptualization, supervision, project administration, writing – review & editing. Bamidele Olu-Owolabi: conceptualization, supervision, writing – review & editing. Emmanuel Unuabonah: conceptualization, methodology, writing – review & editing. Morenike Adesina: investigation.Conflicts of interest
The authors declare that they do not have any conflict of interest.References
- M. E. Elhussien, M. Ahmed, R. M. Hussein and M. H. Elsaim, Adv. Biochem., 2017, 5, 89–96, DOI:10.11648/j.ab.20170505.12.
- M. Wu, S. Zhao, R. Jing, Y. Shao, X. Liu, F. Lv, X. Hu, Q. Zhang, Z. Meng and A. Liu, Appl. Clay Sci., 2019, 180 DOI:10.1016/j.clay.2019.105175.
- M. Salvia, M. Fieu and E. Vulliet, Determination of Tetracycline and Fluoroquinolone Antibiotics at Trace Levels in Sludge and Soil. 2015, 2015 Search PubMed.
- Z. Anfar, M. Zbair, H. Ahsaine, A. Jada and N. El Alem, RSC Adv., 2020, 10, 11371–11380 RSC.
- J. Dutta and A. A. Mala, Water Sci. Technol., 2020, 1–26, DOI:10.2166/wst.2020.335.
- M. Li, Y. Liu, G. Zeng, N. Liu and S. Liu, Chemosphere, 2019, 226, 360–380, DOI:10.1016/j.chemosphere.2019.03.117.
- X. Zhu, D. C. W. Tsang, F. Chen, S. Li and S. X. Yang, Environ. Technol., 2015, 36(24), 3094–3102, DOI:10.1080/09593330.2015.1054316.
- M. J. Lujan-Facundo, M. I. Iborra-Clar, J. A. Mendoza-Roca and M. I. Alcaina-Miranda, JCLP, 2019, 238, 117866 CAS.
- Y. Chao, W. Zhu, F. Chen, P. Wang, Z. Da, Y. Chao, W. Zhu, F. Chen, P. Wang, Z. Da, X. Wu, H. Ji, S. Yan and H. Li, Sep. Sci. Technol., 2014, 49(14), 2221–2227, DOI:10.1080/01496395.2014.914954.
- H. T. Van, L. H. Nguyen, N. V. Dang, H.-P. Chao, Q. T. Nguyen, T. H. Nguyen, T. B. L. Nguyen, D. V. Thanh, H. D. Nguyen, P. Q. Thang, P. T. H. Tranh and V. P. Hoang, RSC Adv., 2021, 11, 5801 RSC.
- M. J. Ahmed and B. H. Hameed, Ecotoxicol. Environ. Saf., 2018, 149, 257–266, DOI:10.1016/j.ecoenv.2017.12.012.
- G. Z. Kyzas and E. A. Deliyanni, Chem. Eng. Res. Des., 2014, 97, 135–144, DOI:10.1016/j.cherd.2014.08.020.
- P. R. Yaashikaa, P. S. Kumar, S. J. Varjani and A. Saravanan, Bioresour. Technol., 2019, 292(122030), 1–11, DOI:10.1016/j.biortech.2019.122030.
- G. Enaime, A. Baçaoui, A. Yaacoubi and M. Lübken, Appl. Sci., 2020, 10, 3492, DOI:10.3390/app101034.
- R. Shan, Y. Shi, J. Gu, J. Bi, H. Yuan and B. Luo, J. Environ. Chem. Eng., 2020, 8(4), 103885, DOI:10.1016/j.jece.2020.103885.
- J. Zhang, A. Koubaa, D. Xing, H. Wang, Y. Wang, W. Liu, Z. Zhang, X. Wang and Q. Wang, Bioresour. Technol., 2020, 312, 123586, DOI:10.1016/j.biortech.2020.123586.
- L. Tang, J. Yu, Y. Pang, G. Zeng and Y. Deng, Chem. Eng. J., 2018, 336, 160–169, DOI:10.1016/j.cej.2017.11.048.
- L. Zhu, N. Zhao, L. Tong, Y. Lv and G. Li, Chemosphere, 2018, 210, 734–744, DOI:10.1016/j.chemosphere.2018.07.090.
- G. F. Ferreira, M. Pierozzi, A. Claudia, F. Widner, P. Silva and M. Strauss, J. Polym. Environ., 2019, 27(8), 1735–1745, DOI:10.1007/s10924-019-01468-1.
- M. O. Omoregie, F. O. Agunbiade, M. O. Alfred, O. T. Olaniyi, T. A. Adewumi, A. A. Bayode, A. E. Ofomaja, E. B. Naidoo, P. Okoli, T. A. Adebayo and E. I. Unuabonah, Chem. Pap., 2018, 72(2), 409–417 CrossRef.
- E. Simsek, D. Saloglu, N. Ozcan, I. Novak and D. Berek, J. Taiwan Inst. Chem. Eng., 2016, 1–11, DOI:10.1016/j.jtice.2016.11.008.
- J. R. Kim, S. G. Huling and E. Kan, Chem. Eng. J., 2015, 262, 1260–1267, DOI:10.1016/j.cej.2014.10.065.
- E. Unuabonah, C. Gu, J. Weber, S. Lubahn and A. Taubert, ACS ES&T, 2013, 1, 966–973, DOI:10.1021/sc400051y.
- M. F. Anuar, Y. W. Fen, M. H. M. Zaid, K. A. Matori and R. E. M. Khadir, Results Phys., 2018, 11, 1–4 CrossRef.
- M. El Bouraie and A. A. Masoud, Appl. Clay Sci., 2017, 140, 157–164 CrossRef CAS.
- W. Zhang, X. Shi, Y. Zhang, W. Gu, B. Li and Y. Xian, J. Mater. Chem. A, 2013, 1, 1745–1753, 10.1039/c2ta00294a.
- I. A. W. Tan, A. L. Ahmad and B. H. Hameed, J. Hazard. Mater., 2008, 153(1–2), 708–717 Search PubMed.
- A. K. Panda, B. G. Mishra, D. K. Mishra and R. K. Singh, Colloids Surf., A, 2010, 363(1–3), 98–104, DOI:10.1016/j.colsurfa.2010.04.022.
- T. Qui, J. Yang, X. Bai and Y. Wang, RSC Adv., 2019, 9, 12737–12746 RSC.
- K. Adebowale, A. Egbedina and B. Shonde, Appl. Water Sci., 2020, 10, 225, DOI:10.1007/s13201-020-01307-y.
- J. Wang, B. Chen and B. Xing, Environ. Sci. Technol., 2016, 50(7), 3798–3808, DOI:10.1021/acs.est.5b0486.
- D. Fu, Y. Zhang, F. Lv, P. K. Chu and J. Shang, Chem. Eng. J., 2012, 193–194, 39–49 CrossRef CAS.
- G. Varank, A. Demir, K. Yetilmezsou, S. Top, E. Sekman and M. S. Bilgili, Indian J. Chem. Technol., 2012, 19, 7–25 CAS.
- X. Wang, P. Tang, C. Ding, X. Cao, S. Yuan, X. Zuo and X. Deng, Biochem. Pharmacol., 2017, 5(5), 4291–4297, DOI:10.1016/j.jece.2017.08.018.
- M. Casen, C. K. Lenarci, V. Mislej, M. Levslek, A. Kovacic, B. Cimrmaamcic, N. Uraniek, T. Kosjek, D. Heath, M. S. Dolenc and E. Heath, STOTEN, 2018, 616–617, 744–753 Search PubMed.
- R. Acosta, D. Nabarlatz, A. Sanchez-Sanchez, J. Jaguello, P. Gadonneux, A. Celzard and V. Ferro, J. Environ. Chem. Eng., 2018, 6(1), 823–833 CrossRef CAS.
- F. Brouers and T. J. Al-Musawi, J. Mol. Liq., 2016, 212, 46–51 CrossRef.
- A. A. Mohammed, T. J. Al-Musawi, S. L. Kareem, M. Zarrabi and A. M. Al-Ma'abreh, Arabian J. Chem., 2020, 13(3), 4629–4643 CrossRef CAS.
- B. Turan, M. Bugdayci, K. Benzesik and P. Demircivi, Sep. Sci. Technol., 2021 DOI:10.1080/01496395.2021.1878372.
- M. N. Alnajrani and O. A. Alsager, Sci. Rep., 2020, 10, 794 CrossRef CAS PubMed.
- Y. Hu, C. Pan, X. Zheng, S. Liu, F. Hu, L. Xu, G. Xu and X. Peng, Water, 2020, 12(3), 905 CrossRef CAS.
- C. Zhao, J. Ma, Z. Li, H. Xia, H. Liu and Y. Yang, RSC Adv., 2020, 10, 5066–5076 RSC.
- A. M. Huizar-Felix, C. Aguilar-Flores, A. M. Martinez-de-la Cruz, J. Barandiaran, S. Sepulveda-Guzman and R. Cruz-Silva, Nanomaterials, 2019, 9(3), 313 CrossRef CAS PubMed.
- A. L. Prasad, T. Santhi and S. Manonmani, Arabian J. Chem., 2015, 8, 343–354, DOI:10.1016/j.arabjc.2011.01.020.
- P. N. Diagboya, B. I. Olu-Owolabi, D. Zhou and B.-H. Han, Carbon, 2014, 79, 174–182, DOI:10.1016/j.carbon.2014.07.057.
- Z. Fang, Y. Hu, X. Wu, Y. Qin, J. Cheng, Y. Chen, P. Tan and H. Li, Chem. Eng. J., 2018, 334, 948–956, DOI:10.1016/j.cej.2017.10.067.
- X. Li, M. Zhou, J. Jia, J. Ma and Q. Jia, Sep. Purif. Technol., 2018, 195, 130–137 CrossRef CAS.
- A. Pholosi, B. E. Naidoo and A. E. Ofomaja, Mater. Chem. Phys., 2019, 222, 20–30, DOI:10.1016/j.matchemphys.2018.09.067.
- E. I. Unuabonah, F. O. Agunbiade, M. O. Alfred, T. A. Adewumi, C. P. Okoli, M. O. Omoregie, M. O. Akanbi, A. E. Ofomaja and A. Taubert, JCLP, 2017, 164, 652–663, DOI:10.1016/j.jclepro.2017.06.160.
- S. Chakraborty, A. Muhkerjee, S. Das, N. R. Maddela, S. Iram and P. Das, Environmental Engineering Research, 2021, 26(1), 190372, DOI:10.4491/eer.2019.372.
Footnote |
| † Electronic supplementary information (ESI) available. See DOI: 10.1039/d1ra01130h |
| This journal is © The Royal Society of Chemistry 2021 |

