
 Open Access Article
 This Open Access Article is licensed under a Creative Commons Attribution-Non Commercial 3.0 Unported Licence
Three-dimensional mesoporous PtM (M = Co, Cu, Ni) nanowire catalysts with high-performance towards methanol electro-oxidation reaction and oxygen reduction reaction
Junzhe Sun *a,
Yubo Houa,
Xuetao Wanga,
Tianyi Kou*b,
Na Liuc,
Ruijie Zhanga and
Zhonghua Zhangc
*a,
Yubo Houa,
Xuetao Wanga,
Tianyi Kou*b,
Na Liuc,
Ruijie Zhanga and
Zhonghua Zhangc
aSchool of Materials and Chemical Engineering, Zhongyuan University of Technology, Zhengzhou, 450007, P. R. China. E-mail: haikuo527@163.com
bDepartment of Chemistry and Biochemistry, University of California, Santa Cruz, California 95064, USA. E-mail: tkou@ucsc.edu
cKey Laboratory for Liquid-Solid Structural Evolution and Processing of Materials (Ministry of Education), School of Materials Science and Engineering, Shandong University, Jingshi Road 17923, Jinan, 250061, P. R. China
First published on 21st April 2021
Abstract
Alloying with transition elements is proven to be an effective way to improve the methanol electro-oxidation reaction (MOR) and oxygen reduction reaction (ORR) activities of Pt catalysts for direct methanol fuel cells (DMFCs). Through a process of rapid solidification and two-step dealloying, we have successfully fabricated three-dimensional mesoporous PtM (M = Co, Cu, Ni) nanowire catalysts, which show much enhanced electrocatalytic properties towards MOR and ORR in comparison with the commercial Pt/C catalyst. Electrochemical tests indicate that alloying with Cu presents the best ORR activities, the half-wave potential of which is 42 mV positively shifted compared with the commercial Pt/C (0.892 V vs. RHE). Meanwhile, the PtM nanowire catalysts also possess good CO tolerance as well as stability for 10![[thin space (1/6-em)]](https://www.rsc.org/images/entities/char_2009.gif) 000 cycles of cyclic voltammetry scanning. This convenient preparation method is promising for the development of high performance electrocatalysts for MOR and ORR in DMFCs.
000 cycles of cyclic voltammetry scanning. This convenient preparation method is promising for the development of high performance electrocatalysts for MOR and ORR in DMFCs.
1. Introduction
Proton exchange membrane fuel cells (PEMFCs) have more prospects in technology and application for automobile transportation and portable electronics due to the high power density, transient response and relative long charging time.1,2 Among a great variety, the low temperature direct methanol fuel cell (DMFC), as a portable device, has attracted more and more attention due to the high energy density of methanol.3,4 However, among the components of a PEMFC, the Pt-based catalyst and its associated catalyst layer account for more than half of the total cost, therefore the high cost is the main factor limiting its commercial application.5 Compared with the anodic methanol oxidation reaction (MOR), the slow cathodic oxygen reduction reaction (ORR) has a larger activation barrier; people are committed to developing novel catalysts requiring not only reduction of the Pt loading (particularly in the cathode catalyst layer) but also improvement of the catalytic activity and stability.6–8 To address these problems, alloying Pt with the second transition metals into nanostructures have been proven to be an effective way to design novel catalysts.9,10 Up to now, it has been found that the Pt-based bimetallic nanocrystals have synergistic effect on improving catalytic activity and CO tolerance.11 During the synthesis of novel catalysts, it is found that optimizing the shape, morphology and composition of catalysts is the key factor for improving catalytic activity and stability.12–14Nowadays people mainly use chemical reduction method to prepare Pt-based nanoparticles, in which metal salts and reducing agents are usually used as precursors.15–17 These precursors have an important impact on the size and morphology of the synthesized Pt-based bimetallic nanoparticles, at the same time, there are problems of stability in the long-time operating process. In addition, Pt-based nanocatalyst with core–shell structure was prepared by electrodeposition and under potential deposition, which further improved the utilization of Pt.18–20 Although the above methods can be used to prepare Pt-based alloy catalysts with nanostructures, there are still problems such as complex process with multi-step, accurate control of test conditions, which is not conducive to the industrial application. Recently, nanoporous metals fabricated by dealloying have attracted increasing attention for their unique 3D bicontinuous porous structures and wide applications in catalysis, sensor, and actuator, and so on.21–24 Especially, nanoporous metals obtained by dealloying have been proved to be efficient electrocatalysts for MOR and ORR in DMFCs.25,26
In our work, we firstly used rapid solidification method to prepare Al-based ternary precursor alloys containing Pt, and then dealloyed the precursor alloys to obtain binary PtM (M = Co, Cu, Ni) alloys with 3D bicontinuous structure. At the same time, the catalytic performance and stability of mesoporous PtM alloys were evaluated in comparison with that of commercial Pt/C catalyst. This work provided a low cost, environmentally friendly and simple synthesis method of high efficiency catalysts.
2. Experimental section
All the ingots of Al97Co2.5Pt0.5, Al95Cu4.5Pt0.5 and Al96Ni3.5Pt0.5 (at%) were prepared by high-frequency induction heating under argon atmosphere. Then the pre-alloyed ingots were remelted and rapidly solidified into ribbons by a single roller melt spinning apparatus. Then the melt-spun ribbons were dealloyed firstly in a 2 M NaOH aqueous solution for 4 h and then in a 2 M HNO3 solution for 4 h at room temperature. The as-dealloyed samples were rinsed using distilled water and dehydrated alcohol.X-ray diffraction patterns of the melt-spun ribbons and as-dealloyed samples were obtained by an X-ray diffractometer (XRD, Rigaku D/max-rB) with Cu Kα radiation. The microstructural characterization was carried out using a scanning electron microscope (SEM, LEO 1530VP), a transmission electron microscope (TEM, Philips CM 20) with selected-area electron diffraction (SAED) and a high-resolution TEM (HRTEM, FEI Tecnai G2). The chemical compositions of the as-dealloyed samples were determined by an energy-dispersive X-ray (EDX) analyzer attached to SEM. For one composition, at least 3 EDX experiments were performed and an average value was given in the results.
All electrochemical measurements were performed in a standard three-electrode cell with a plate-like Pt counter electrode using a CHI 760E Potentiostat. The saturated calomel electrode (SCE) was used as the reference electrode for MOR test. The ORR activities were measured by using a rotating disk electrode (RDE, Pine) system with the Ag/AgCl as the reference electrode. The calibrated value of the SCE and Ag/AgCl vs. RHE is 0.241 V and 0.256 V, respectively. All electrode potentials were referred to RHE throughout this paper. The catalyst suspensions were made by sonicating a mixture of catalyst powder, XC-72 carbon powder, isopropanol, and Nafion solution (0.5 wt%) for 30 min. Then a proper amount of the catalyst suspension was placed on pre-polished 4 and 5 mm diameter glassy carbon (GC) electrodes for MOR and ORR measurements, respectively. The modified GC electrode was used as the working electrode. Prior to the electrochemical measurements, the electrolytes were deoxygenated by bubbling with high-purity N2 for at least 30 min. The electrocatalytic activities measurements of the mesoporous PtM alloys for methanol electro-oxidation were recorded in a 0.5 M H2SO4 + 0.5 M CH3OH solution at 30 °C, and the corresponding electrodes were firstly pre-activated by cyclic voltammetry (CV) in a 0.5 M H2SO4 solution to reach a relative stable state. The CO stripping experiments were carried out by firstly holding the working electrode at 0.1 V (vs. RHE) in a CO-saturated 0.5 M H2SO4 solution for 500 s, and then transferring the working electrode into a N2-purged 0.5 M H2SO4 solution to record the CO-stripping profiles. For the ORR measurements, the working electrode was also firstly pre-activated by CV in 0.1 M HClO4 solution saturated with N2 for 30 min until it was stable, and the scanning rate was 50 mV s−1. Then, it was successively transferred to 0.1 M N2-saturated HClO4 solution and O2-saturated HClO4 solution for ORR experiment. The LSV curve was negatively recorded from 1.1 to 0.05 V (vs. RHE) at 1600 rpm, and the scanning rate was 10 mV s−1. Solution resistance (Rs) for the ORR were corrected by electrochemical impedance spectroscopy (EIS) measurements, which were performed in a frequency range from 100 mHz to 100 kHz with a potential amplitude of 5 mV at 0.58 V (vs. Ag/AgCl), and the impedance fitting software used was ZSimpWin. For comparison, the commercial Johnson Matthey (JM) Pt/C catalyst was also measured under the identical experimental conditions. All the electrochemically active surface areas (ECSAs) of Pt electrodes were calculated by integration of the charge associated with the hydrogen adsorption/desorption using a charge density of 210 μC cm−2.27,28 The current densities were normalized by the ECSAs and the Pt loading mass, respectively.
3. Results and discussion
3.1 Preparation and characterization of mesoporous PtM (M = Co, Cu, Ni) nanowire
Fig. 1a shows the XRD patterns of the melt-spun Al97Co2.5Pt0.5, Al95Cu4.5Pt0.5 and Al96Ni3.5Pt0.5 ribbons. These patterns all show a set of four main diffraction peaks, which can be index as the (111), (200), (220) and (311) reflections of face-centered-cubic (fcc) Al phase compared to the standard Al (PDF No. 65-2869), implying that the fcc Al is the main phase of the precursors. In addition, it is speculated that some unknown metastable phases also exist in the precursors according to the minor diffraction peaks appearing on the XRD patterns. Based on the Al–Co, Al–Cu and Al–Ni binary phase diagrams, the Co, Cu, Ni and the minor Pt exist in the form of intermetallic phases as displayed by small diffraction peaks on the XRD patterns. After two-step of dealloying in NaOH and HNO3 solutions, the XRD patterns of these samples are given in Fig. 1b. The XRD patterns show a set of four diffraction peaks, which slightly shift positively compared to pure Pt (PDF No. 65-2868), implying the contraction of Pt lattice and the formation of PtM (M = Co, Cu, Ni) solid solution alloys.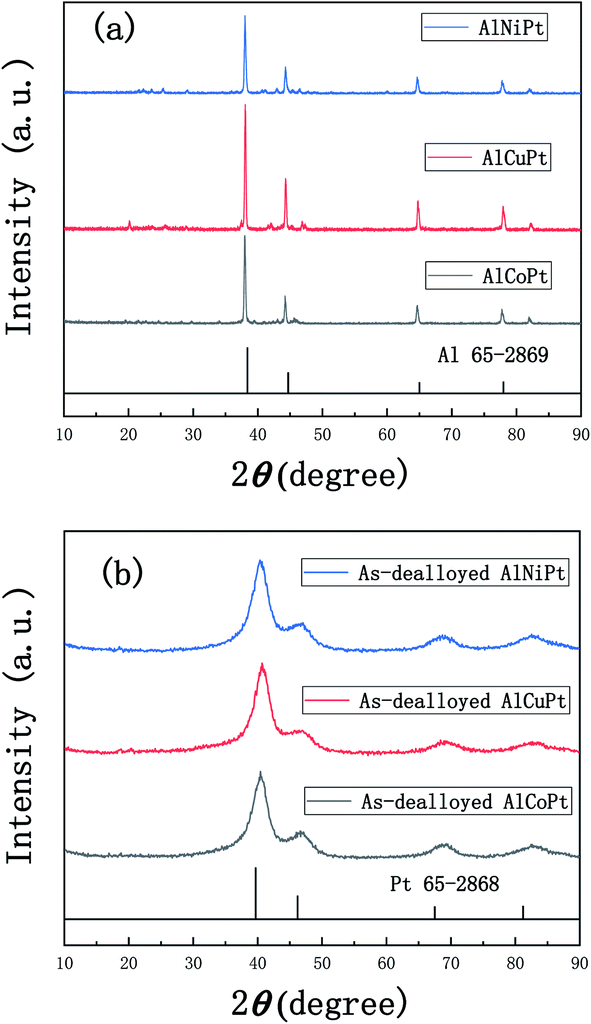 | ||
| Fig. 1 XRD patterns of (a) the melt-spun Al97Co2.5Pt0.5, Al95Cu4.5Pt0.5, Al96Ni3.5Pt0.5 ribbons and (b) the dealloyed samples obtained by dealloying of Al97Co2.5Pt0.5, Al95Cu4.5Pt0.5, Al96Ni3.5Pt0.5 firstly in the 2 M NaOH solution for 4 h and then in the 2 M HNO3 solution for 4 h. | ||
Fig. 2a, c and e show the SEM micrographs of the as-dealloyed Al97Co2.5Pt0.5, Al95Cu4.5Pt0.5 and Al96Ni3.5Pt0.5 samples obtained by successively dealloying in 2 M NaOH and 2 M HNO3 solutions. From the low-magnification SEM images it can be found that there is slight difference among these three as-dealloyed samples. There are a lot of corrosion pits in the PtCo samples, while the whole matrix is composed of numerous small particles (Fig. 2a). In contrast, particles in the PtCu alloy are finer with uniform distribution, exhibiting a lot of needle-like structure (Fig. 2c). Unlike these two alloys, although the distribution is still uniform, the PtNi alloy shows much more compact structure and fewer holes appear on the substrate (Fig. 2e). The corresponding EDX results demonstrate that the chemical compositions of these as-dealloyed samples are 78% Pt–22% Co, 77.5% Pt–22.5% Cu and 82.5% Pt–17.5% Ni in at% respectively. The atomic ratio of Pt:M is close to 4:1. However, due to the restriction of the magnification times of SEM, more structural information can be further obtained by the TEM and HRTEM analysis, which are given in Fig. 3. According to the ‘volcano’ plot, a series of active skin-type Pt3X compounds, such as Pt3Y, Pt3Co, Pt3Fe, Pt3Ni, and so on, were identified as the most stable Pt-based binary alloys with better ORR activity than Pt.29,30 More details and experiment results about the effect of the different elements on the electrocatalytic properties of these alloys will be given in the following section.
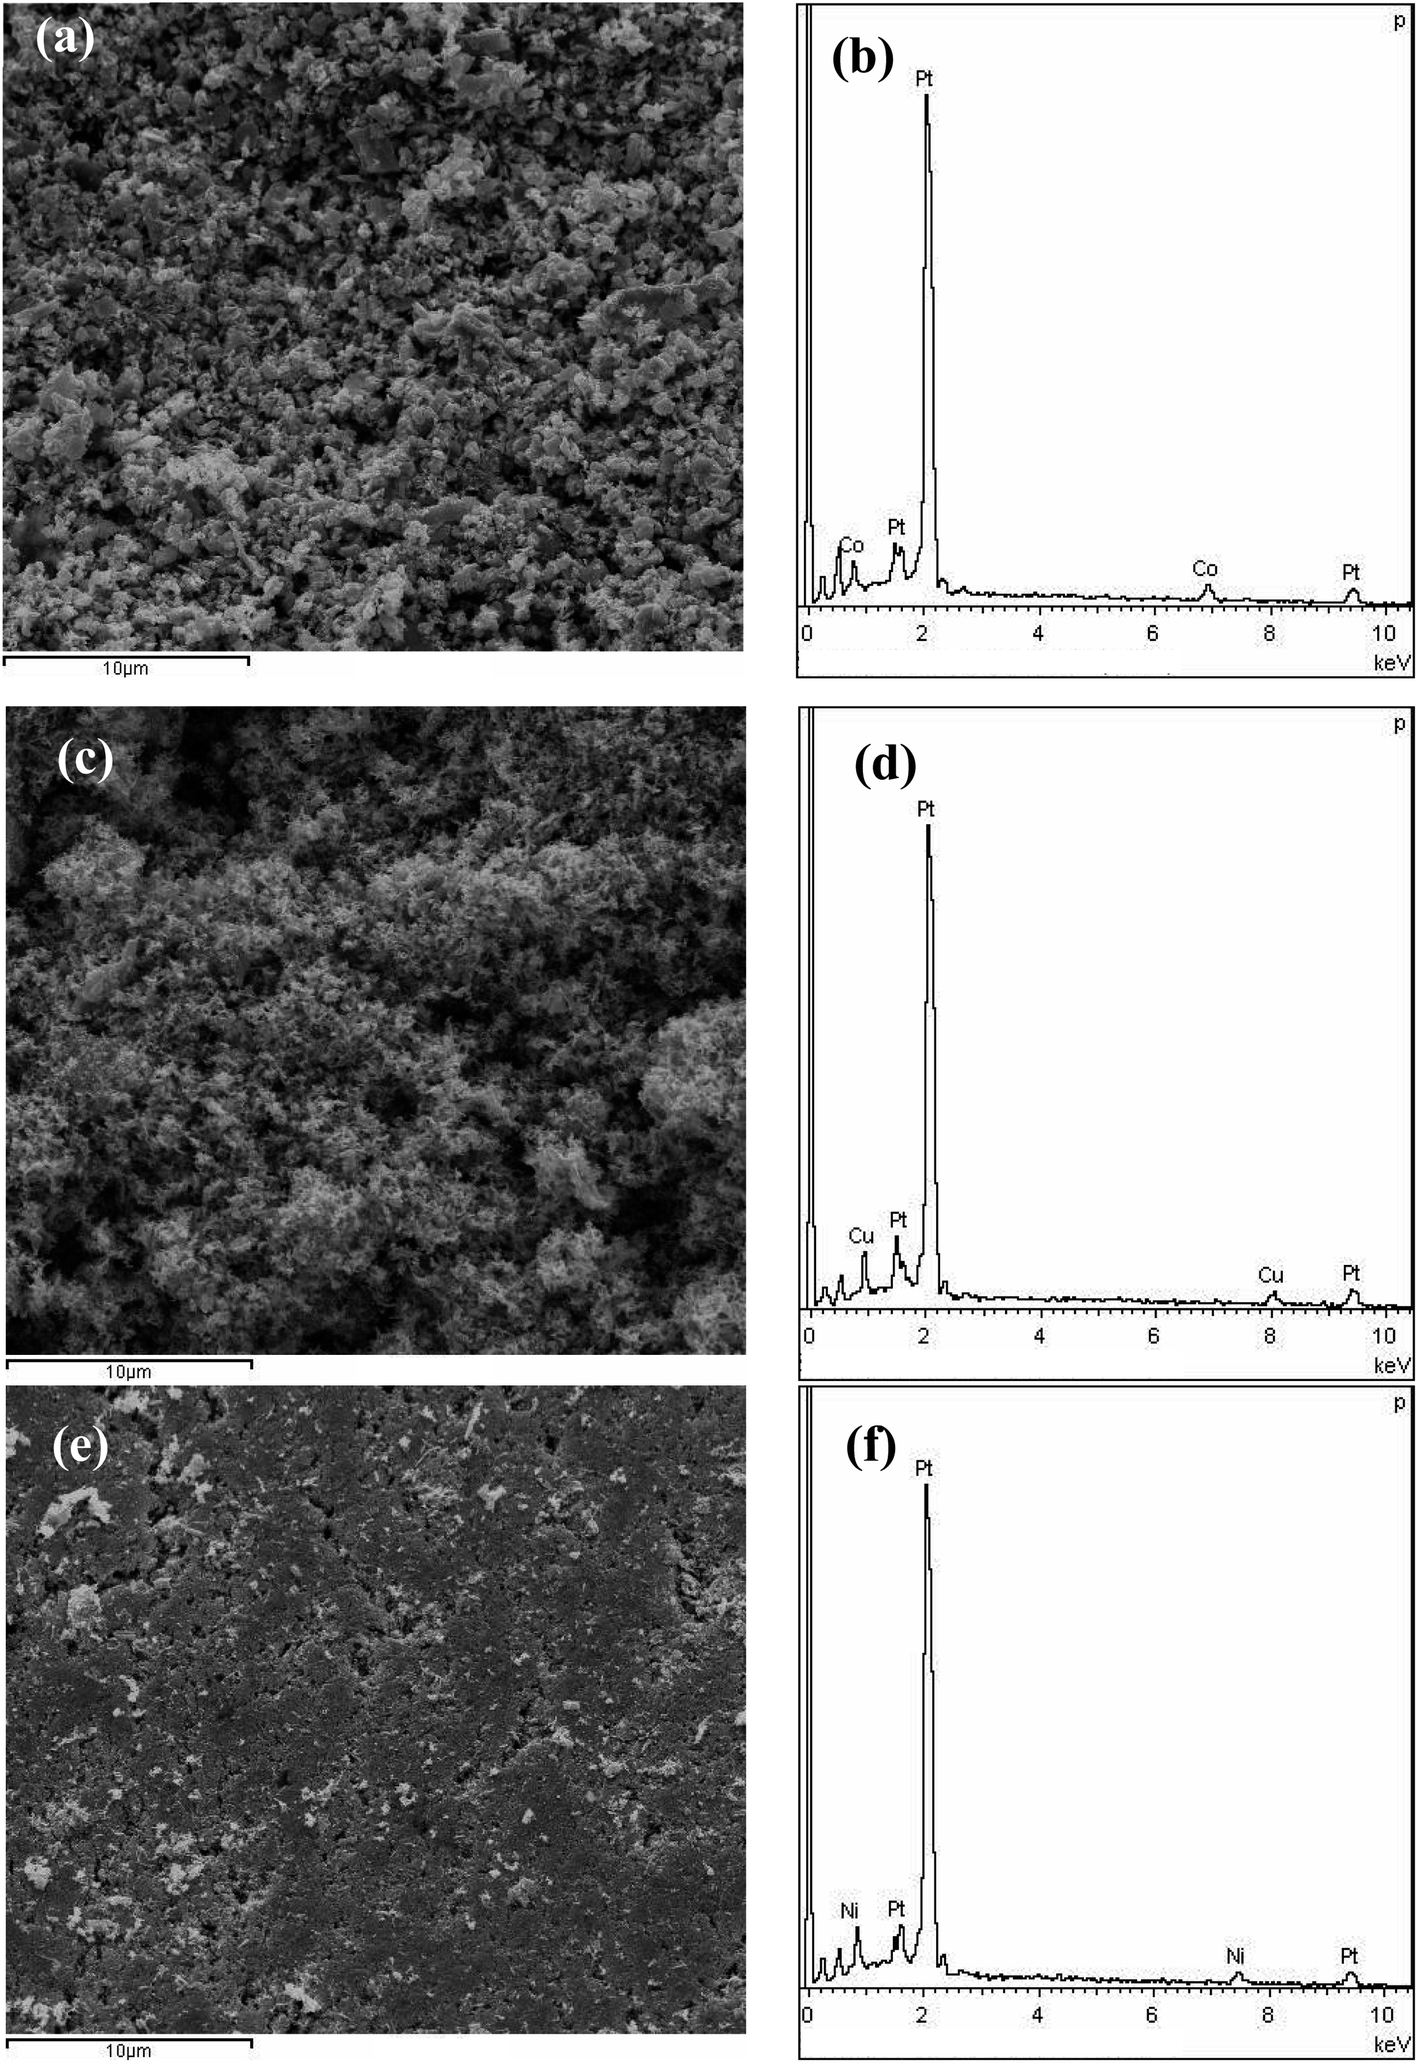 | ||
| Fig. 2 SEM images of the as-dealloyed samples of (a) PtCo, (c) PtCu, and (e) PtNi. (b, d and f) Corresponding EDX spectra of (a, c and e), respectively. | ||
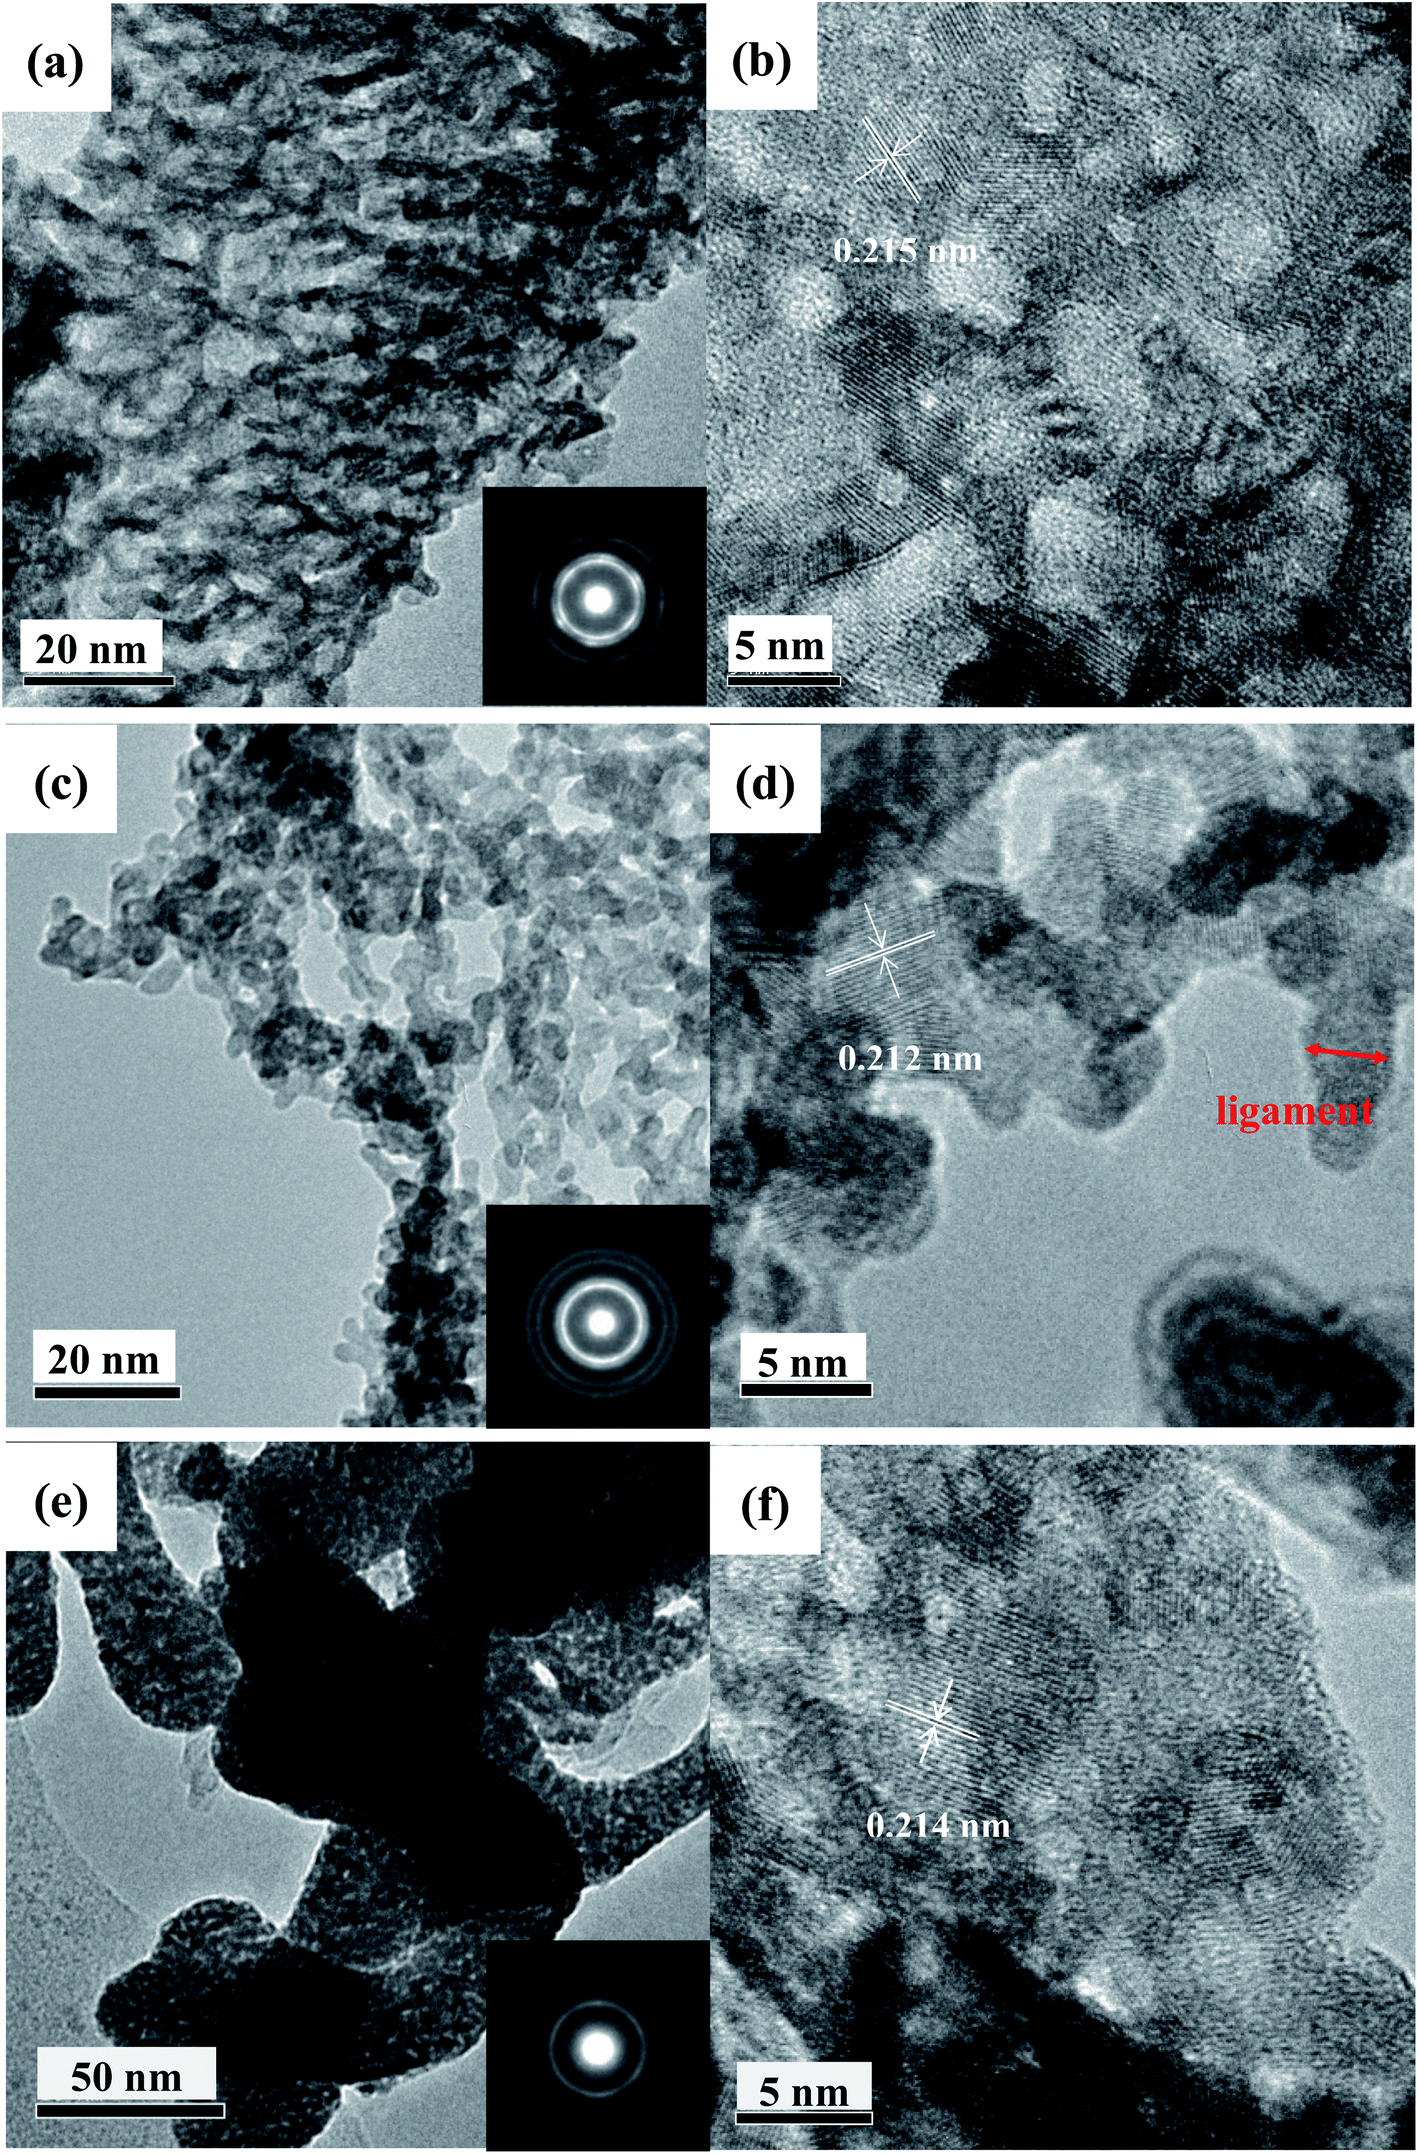 | ||
| Fig. 3 TEM images of the as-dealloyed samples of (a) PtCo, (c) PtCu, and (e) PtNi. HRTEM images of the as-dealloyed samples of (b) PtCo, (d) PtCu, and (f) PtNi. Insets in (a, c and e): corresponding SAED patterns. | ||
The TEM and HRTEM images are performed for further structural analysis (Fig. 3a–e). The TEM images clearly show the 3D bicontinuous interpenetrating ligament (dark skeleton)-channel (bright region) structure of the mesoporous PtM nanowire catalysts (Fig. 3a, c and e). Meanwhile, from the low-magnification TEM image in Fig. 3e, it can be seen that the mesoporous PtNi alloy consists of dendritic particles with a width of dozens of nanometers. We speculate that this structure retains the rapid solidification microstructure in the master alloy. From the HRTEM images we can further see that there are mesoporous nanostructures in these particles (Fig. 3f). The average ligament size is 2.7 ± 0.5 nm, 2.6 ± 0.4 nm and 2.7 ± 0.7 nm for the PtCo, PtCu and PtNi alloy, respectively.
After comparison, we found that the ligament size of the mesoporous PtM nanowire alloys obtained by rapid solidification and dealloying is smaller than that of the nanoporous Pt3Cu alloy obtained by mechanical alloying and dealloying (3.3 ± 0.7 nm).31 Moreover, the SAED patterns (inserts of Fig. 3a, c and e) are all composed of polycrystalline diffraction rings, which can be indexed as fcc PtM (111), (200), (220) and (311) reflections from the inner ring to the outer one, respectively. These phenomena also suggest these alloys are composed of nanocrystals, and the Co, Cu, Ni elements form a face-centered cubic solid solution alloy with Pt, respectively. By calculation, the lattice spacing of the mesoporous PtCo, PtCu and PtNi nanowire alloys for (111) planes is 0.215 nm, 0.212 nm and 0.214 nm (as indicated in Fig. 3b, d and f), respectively, which are smaller than the value (0.226 nm) of the (111) crystal plane of Pt, indicating that alloying with M (M = Co, Cu, Ni) elements results in the lattice shrinkage.
3.2 Formation mechanism of mesoporous PtM (M = Co, Cu, Ni) nanowires
Fig. 4 shows the process of obtaining mesoporous PtM nanowires by the two-step dealloying. Firstly, the precursor alloy ribbons obtained by rapid solidification have two main phases: α-Al and AlxMy phase (a small amount of Pt exists in the AlxMy phase). During the dealloying process in the NaOH solution, the more active Al element in α-Al and AlxMy phase is preferentially dissolved to form AlO2−, and the relatively inert M and Pt diffuse and reorganize in surface.32,33 In this process, the precursor alloy structure formed by rapid solidification is retained, and the sample is mainly composed of M (containing a small amount of Pt) and the remaining Al, initially forming a porous structure. Secondly, during the dealloying process in the HNO3 solution, M dissolves to form M2+ or M3+ and the remaining Al dissolves to form Al3+. Meanwhile, the inert Pt atoms diffuse and reorganize to form a mesoporous structure. Due to the low surface diffusion rate of Pt, ultrafine mesoporous nanowire structures dominated by Pt (including a small amount of M) are finally formed. The TEM images of the mesoporous PtM nanowire alloy and its local enlargement are shown on the right of Fig. 4, which also indicate the formation of the mesoporous nanowire structure.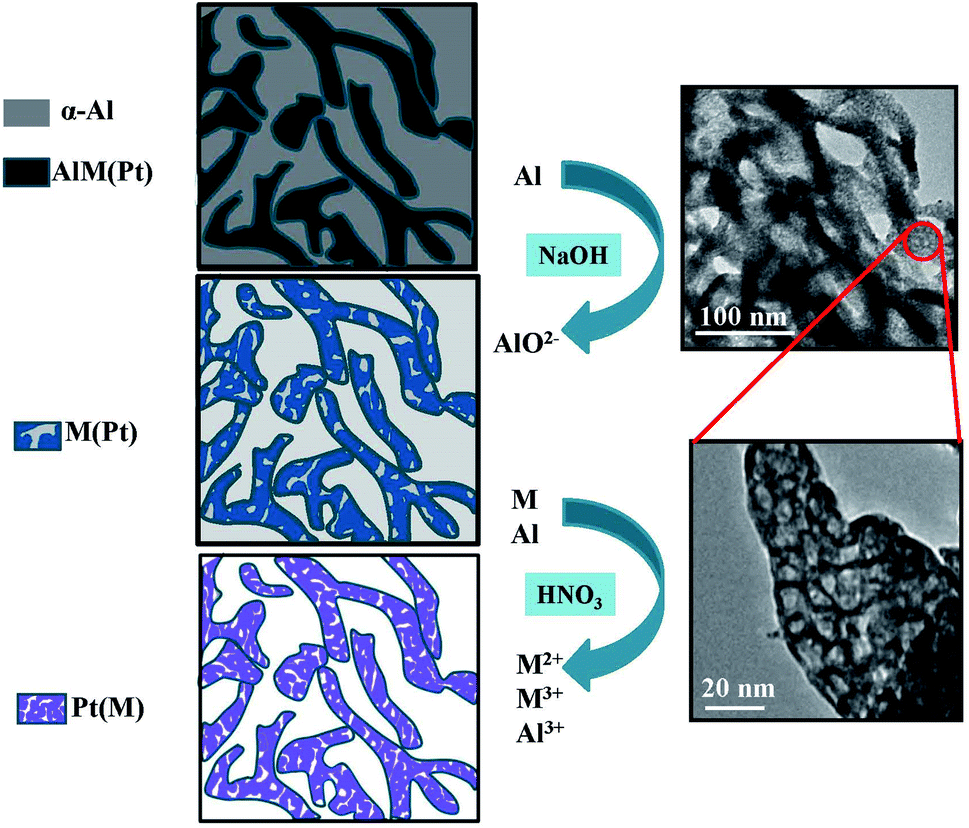 | ||
| Fig. 4 Schematic illustration showing the fabrication process of mesoporous PtM (M = Co, Cu, Ni) nanowires by the two-step dealloying. | ||
3.3 Effect of the addition of different elements M (M = Co, Cu, Ni) on MOR performance
We firstly studied the effect of different element addition on the electrocatalytic performance of methanol. Fig. 5a shows the stable CV curves of mesoporous PtM and commercial JM Pt/C catalyst in the 0.5 M H2SO4 solution. Compared with commercial Pt/C catalysts, mesoporous PtM alloys present similar hydrogen adsorption/desorption peaks, double-electrical layer and Pt oxidation/reduction peaks. A slight difference is that the hydrogen separation characteristics of PtM alloys are not as obvious as those of commercial Pt/C catalyst, which may be contributed to the effect of alloying. During the CV scanning, the separated hydrogen peaks of PtM alloys gradually appear, which is related to the gradual dissolution of M (M = Co, Cu, Ni) elements in the surface layer of ligaments. By comparison, we found that the reduction peak position corresponding to Pt oxide moved to high potential after adding M element, and the addition of Co element results in the largest positive shift of reduction peak (Fig. 5a), indicating that Pt oxides in the alloy are reduced earlier during the process of negative scanning. According to the method of calculating the ECSAs of Pt electrode mentioned above, the ECSAs of mesoporous PtCo, PtCu and PtNi nanowire alloys were calculated to be 24, 28 and 19 m2 g−1, respectively. Fig. 5b and c show the CV curves of methanol electro-oxidation by ECSAs and mass normalized of mesoporous PtCo, PtCu, PtNi and Pt/C catalysts respectively. Although the ECSA of PtM is less than the commercial Pt/C catalyst (47 m2 g−1), however, the catalytic activity of mesoporous PtM alloys is significantly higher than that of commercial Pt/C catalyst (Fig. 5b). Among these catalysts, the mass-normalized activity from high to low in turn for PtCu > PtCo > PtNi, shows that alloying with Cu is more beneficial to the improvement of catalytic activity. For the mesoporous PtCu alloy, the peak current density of the positive scan curve is 2.63 mA cm−2, which is about 6.7 times as that of the commercial Pt/C catalyst (0.39 mA cm−2). Meanwhile, If/Ib values (If is the peak current in the positive sweep process, Ib is the peak current in the back sweep process) were used to characterize the degree of catalyst poisoning.34–36 The calculated If/Ib values of mesoporous PtCo, PtCu and Pt Ni alloys are 1.18, 1.24 and 1.19 respectively, while the commercial Pt/C values is 0.91. The higher If/Ib values indicate that PtM alloys have better CO poisoning resistance. According to the DFT calculation results of CO adsorption energy on Pt (111) and nano-porous Pt3Cu (111) surfaces, we believe that the addition of different elements changes the electronic structure of Pt differently, thus improving the catalytic activity and the resistance of CO poisoning.35 In addition, the catalytic activity of methanol is also related to the variety of M element in the mesoporous PtM alloy and the extent of lattice contraction (distortion) caused by it. As shown in Fig. 5c, the alloying of mesoporous PtM also enhances its mass normalized activity and reduces the loading of Pt. The mass normalized activities of mesoporous PtCo, PtCu and PtNi alloys are 513, 741 and 308 mA mgPt−1, respectively, which were 2.8, 4.0 and 1.7 times that of commercial Pt/C (183 mA mgPt−1). We preliminarily speculate that these enhanced methanol catalytic properties may also be the result of a combination of several aspects, such as surface effects and alloying effects, as well as the unique 3D discontinuous mesoporous structure that provides better material and electron transport channels for the reaction.30,37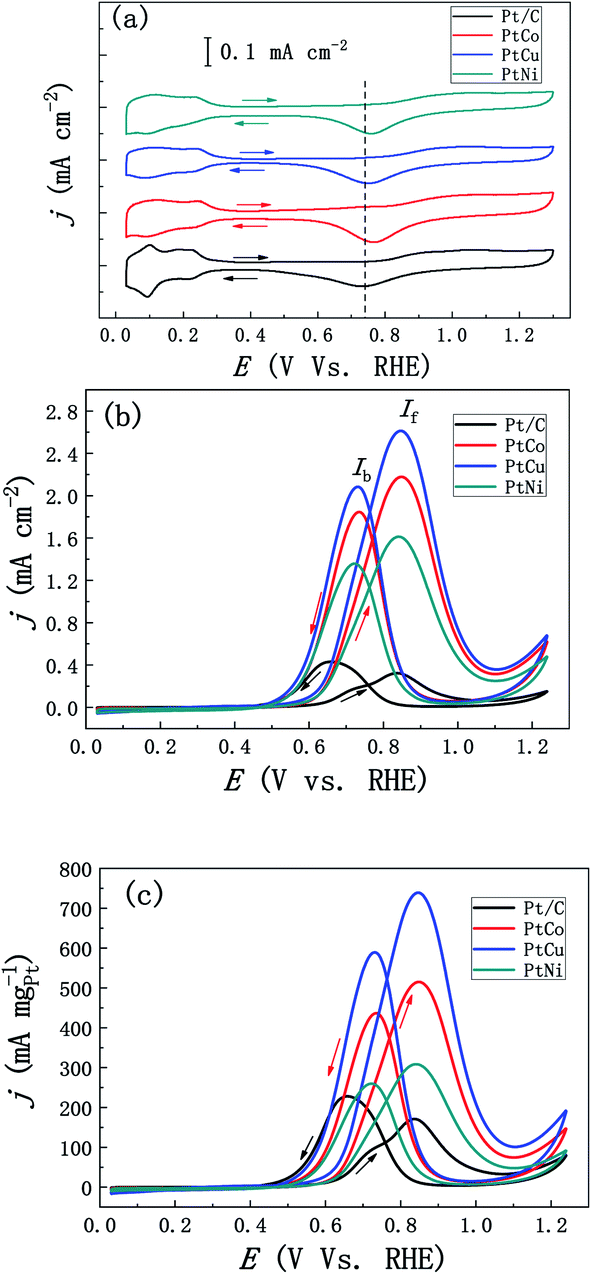 | ||
| Fig. 5 (a) Stable CV curves of the mesoporous PtM (M = Co, Cu, Ni) and Pt/C catalysts in the N2-purged 0.5 M H2SO4 solution (scan rate: 50 mV s−1). (b) Pt ECSA-normalized and (c) mass-normalized CVs for methanol electro-oxidation in the 0.5 M H2SO4 + 0.5 M CH3OH solution at 30 °C (scan rate: 20 mV s−1). | ||
In order to further characterize the CO poisoning resistance of catalysts, we tested the CO electrochemical desorption curves of the three samples, and compared them with the commercial Pt/C catalyst. As shown in Fig. 6, under the same condition, the initial potential of CO desorption of mesoporous PtM alloys is significantly lower than the corresponding value of commercial Pt/C catalyst. For the mesoporous PtCo, PtCu and PtNi alloys, the peak positions of CO desorption related to pre-adsorption of CO oxidation are 0.843, 0.826 and 0.829 V (vs. RHE) respectively. Compared with commercial Pt/C catalyst (0.910 V, vs. RHE), the peak positions of CO desorption are negatively shifted by 67, 84 and 81 mV respectively. The lower CO oxidation potential indicates that mesoporous PtM alloy shows weaker binding with CO, and stronger CO tolerance after alloying with M element. The enhanced CO tolerance of mesoporous PtM nanowire alloys could be attributed to the modification of the electronic surface structure after dealloying and a bifunctional mechanism.38,39 The results are consistent with that of mesoporous PtM alloys possessing larger If/Ib values. Among them the PtCu alloy with the best CO tolerance has the lowest initial potential and peak potential, which is coincidence with the highest If/Ib values among these alloys. Considering the methanol catalysis and CO poisoning resistance comprehensively, we believe that the addition of Cu in these three alloys is more conducive to improving the methanol catalysis performance and CO poisoning resistance.
 | ||
| Fig. 6 Electrochemical CO-stripping curves in the 0.5 M H2SO4 solution of (a) JM Pt/C, (b) mesoporous PtCo, (c) mesoporous PtCu and (d) mesoporous PtNi catalysts (scan rate: 20 mV s−1). | ||
3.4 Effects of addition of different elements M (M = Co, Cu, Ni) on ORR performance
In addition, we studied the effects of the addition of three different elements Co, Cu and Ni on ORR performance of these alloys. Fig. 7a shows the CV curves of PtCo, PtCu and PtNi alloys and commercial Pt/C catalysts in the 0.1 M N2-saturated HClO4 solution. Similar to the CV curve scanning in the H2SO4 solution, we found that PtM alloys show analogous hydrogen region and oxidation and reduction peaks of Pt, which is similar to Pt/C catalyst. Compared with Pt/C catalyst, the reduction peaks of PtM alloys shift to higher potential, indicating that Pt oxides are reduced earlier in the negative-scanning process after alloying. In addition, according to the methods described above, the ECSAs of these three alloys were calculated to be 26, 31 and 21 m2 g−1, respectively, which are similar to the results obtained in the H2SO4 solution. Considering the influence of solution resistance and other factors, the EIS measurements were performed at 0.836 V (vs. RHE) to correct the ORR polarization curve. Fig. 7b shows the oxygen reduction curves after IR compensation of these three alloys at 1600 rpm in the 0.1 M O2-saturated HClO4 solution and all current densities of LSV curves were corrected by background currents for capacitive current contribution. As can be seen from Fig. 7b, the half-wave potential of these PtCo, PtCu and PtNi alloys positively shifts by 21, 42 and 12 mV compared with that of Pt/C (0.892 V vs. RHE), respectively, indicating that the addition of transition element M improves the ORR reaction kinetics in the low overpotential region. In order to further compare the ORR activity of PtM catalysts with that of commercial Pt/C catalyst, the ECSAs-normalized kinetic current densities (0.85–0.95 V vs. RHE) were calculated according to the calculation methods mentioned above. As shown in Fig. 8a, we can clearly see that all these three mesoporous PtM alloys present higher specific current densities than commercial Pt/C catalyst in the potential range of 0.85–0.95 V (vs. RHE). Among them, the kinetic current density of mesoporous PtCu alloy with the highest current density is 2.42 mA cm−2 at 0.90 V (vs. RHE), which is about 7.5 times that of commercial Pt/C (0.32 mA cm−2). At the same time, the mass-normalized activity of these three alloys at 0.90 V (vs. RHE) is compared in Fig. 8b. It is found that the mass activity of the mesoporous PtM is enhanced after alloying with Co, Cu and Ni elements. The mass activity of PtCo, PtCu and PtNi is 342, 742 and 256 mA mgPt−1 respectively, which is 1.6, 3.5 and 1.2 times that of commercial Pt/C (214 mA mgPt−1). The performance of the mesoporous PtM (M = Co, Cu, Ni) nanowire alloys for MOR and ORR activities have been summarized and compared with the reported catalysts in Table 1. It has been reported that the 3d transition metals such as Co, Cu and Ni combine with Pt to form low cost nanostructured PtCo, PtCu and PtNi alloy catalysts with improved electro-catalytic activities for MOR and ORR. For the methanol electro-oxidation, it has been reported that the peak current density of methanol electro-oxidation for np-PtCo alloy is more than 5 times of that on Pt/C.40,41 And the ECSA specific activities of Pt–Cu nanospheres and Pt–Cu nanocubes are ∼3 and ∼4.2 times that for Pt nanospheres, respectively.42 Meanwhile, the ECSA specific activities of spherical PtCu and cubic PtCu are ∼3.2 and ∼4.1 times that for spherical Pt, respectively.43 The as-prepared np-PtNi and PtNi CNCs show great catalytic performance in the methanol oxidation reaction.41,44 According to the ‘volcano’ plot, a series of active skin-type Pt3X compounds, such as Pt3Ni, Pt3Fe, Pt3Co, and so on, were identified as the most stable Pt-based binary alloys with better ORR activity than Pt.29,30 It has been reported that the ionic liquid impregnated nanoporous PtNi alloy exhibits ∼5 times of electrochemically active surface area (ECSA) specific activities towards ORR than that of Pt/C catalyst,45 while the corresponding enhanced factors of the reported nanoporous Pt1Ni1 and Pt6Ni1 are ∼3.4 and ∼6.2 times, respectively.46 The Pt3Co/CNx nanotube electrocatalysts possess the highest ORR activity among the series of Pt–Co/CNx, of which the mass activity is ∼3 times than that of Pt/C catalyst.47 The dealloyed PtCo3 electrocatalyst performs 3 times higher in terms of Pt-based mass activity and 4–5 times higher in terms of ECSA-based specific activity than a 28.2 wt% Pt/C.48 It has been also reported that HNP–PtCu and core–shell PtCu exhibit superior specific activities for ORR compared with commercial Pt/C catalysts.49,50 These results on Co, Cu and Ni addition further verify that the nanoporous structure are beneficial to the improvement of the electro-catalytic activity. In our work, alloying with Co, Cu, Ni in mesoporous PtM (M = Co, Cu, Ni) alloy both increases the MOR and ORR activities in acidic medium, of which the corresponding ECSA specific activities of mesoporous PtCu with the best performance are ∼6.7 and ∼7.5 times that for commercial Pt/C catalyst, respectively. Based on the literature, the obtained mesoporous PtM (M = Co, Cu, Ni) alloy in our work shows the relatively increased activities among the reported PtCo, PtCu and PtNi catalysts. The unique nanostructure and 3D ligaments interpenetrating provide a good channel for mass and electron transport, and the alloying with M (M = Co, Cu) appropriately changes the electronic structure of Pt and optimizes the ability to bind with oxygen, thus enhancing the ORR activity of the alloy. The addition of Cu element is more beneficial to improve the ORR reaction of the alloy, followed by the effect of Co and the weak effect of Ni, which is basically consistent with the results of the “Volcano” plot proposed based on theoretical and experimental data.29,51,52 According to the “Volcano” plot, for Pt3X series different elements have different influences on the changes in the electronic structure of surface Pt, so the stability of some intermediate products can be changed to affect the ORR activity. When the adsorption energy of the alloy surface is 0.0–0.4 eV lower than that of the Pt (111) crystal surface, the alloy presents better ORR performance, and the alloy with the best ORR performance appears at a position 0.2 eV lower than that of the Pt (111).29 As shown in Fig. 8c, we compared the results of our experiment with those reported in the literature,29,37 on the right side of the “Volcano” plot, a decreasing trend of ORR activity appears, and alloying with Cu results in a better ORR activity.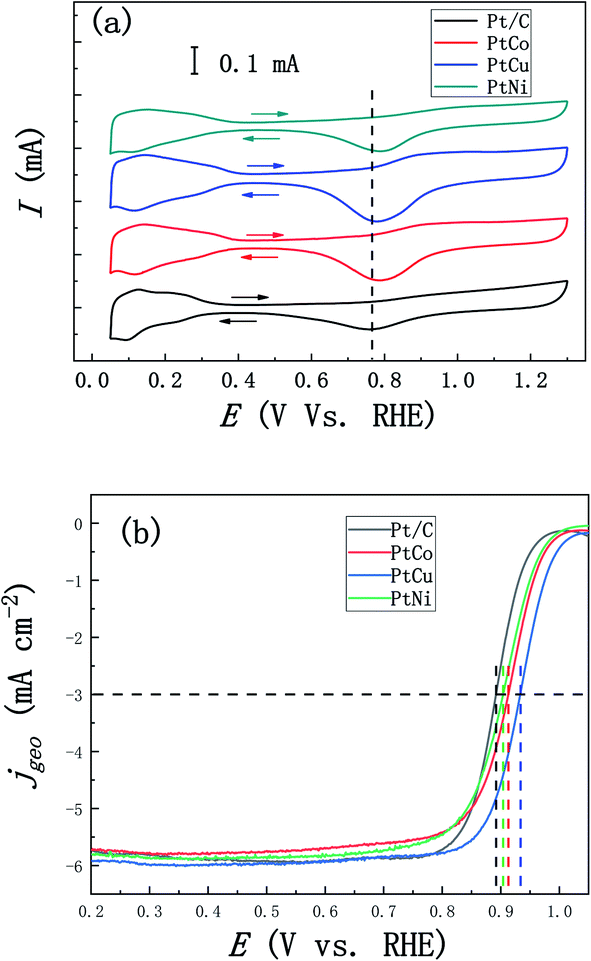 | ||
| Fig. 7 (a) CV curves of mesoporous PtM (M = Co, Cu, Ni) and Pt/C catalysts in the N2-purged 0.1 M HClO4 solution (scan rate: 50 mV s−1). (b) ORR polarization curves for mesoporous PtM (M = Co, Cu, Ni) and Pt/C catalysts in the O2-saturated 0.1 M HClO4 solution at 30 °C at 1600 rpm (scan rate: 10 mV s−1). | ||
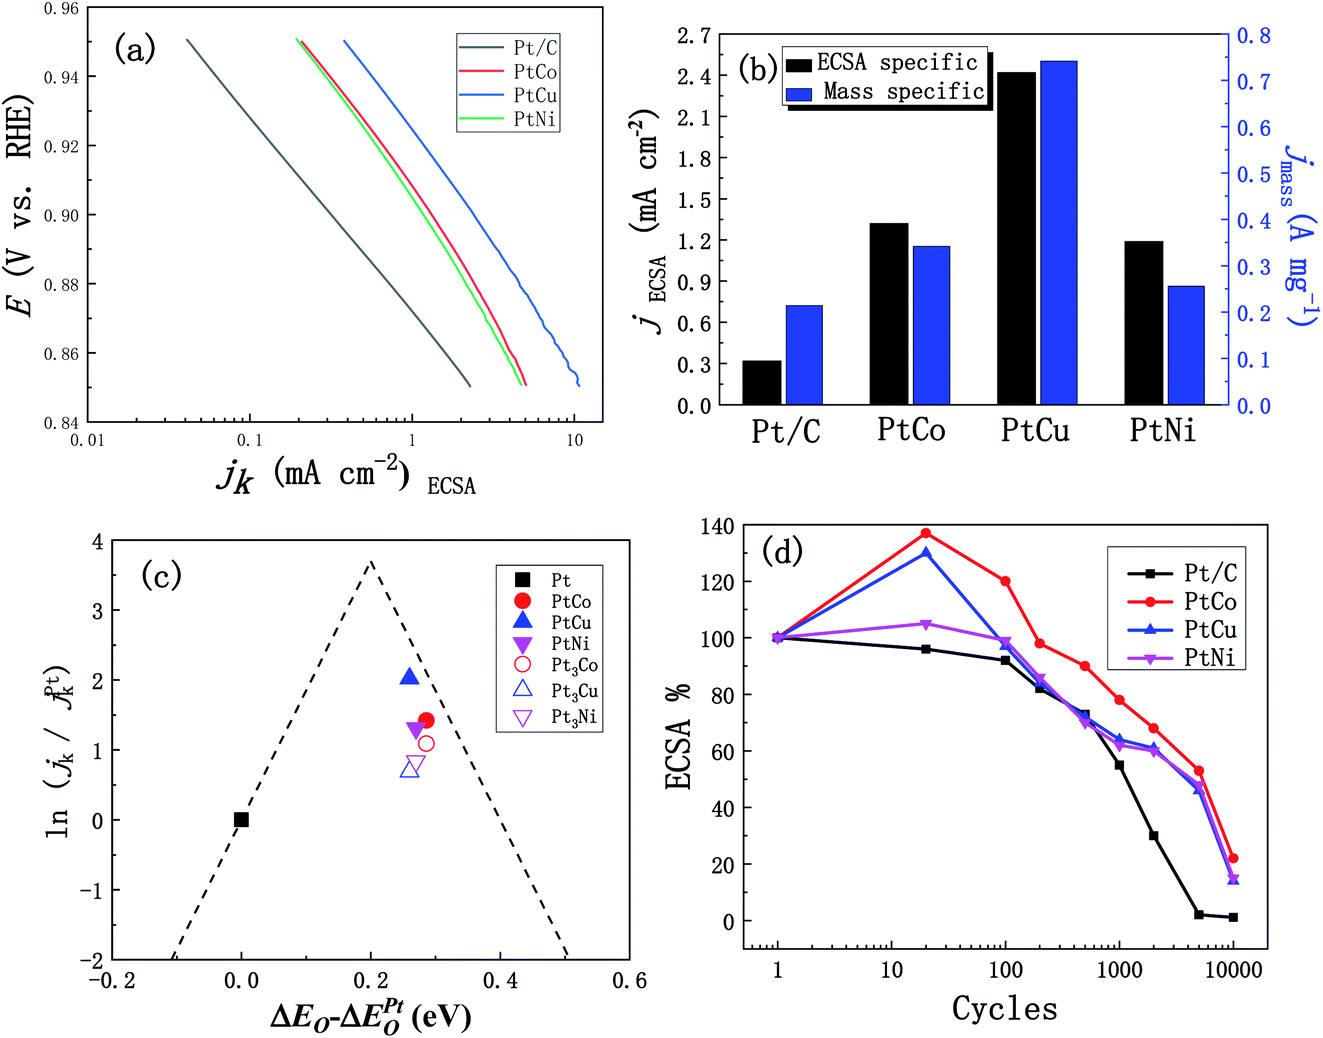 | ||
| Fig. 8 (a) ECSA specific kinetic current densities (jk) for mesoporous PtM (M = Co, Cu, Ni) and Pt/C catalysts. (b) The ECSA and Pt mass specific kinetic densities for mesoporous PtM and Pt/C catalysts at 0.90 V (vs. RHE). (c) Volcano plots for the oxygen reduction reaction on mesoporous PtM (M = Co, Cu, Ni) alloys. (The measured experimental data are marked by solid symbols and the data from literature29,37 are marked by hollow symbols. The dash lines are the theoretical predictions.51,52) (d) The loss of ECSA for mesoporous PtM and Pt/C catalysts vs. the scanning cycles in N2-purged 0.1 M HClO4 solution (0.05–1.4 V vs. RHE, scan rate: 50 mV s−1). | ||
| Sample | ECSA (m2 g−1) | MOR | ORR | Reference | ||||
|---|---|---|---|---|---|---|---|---|
| jECSA (mA cm−2) | jmass (mA mgPt−1) | If/Ib | Ehalf (V) (vs. RHE) | jECSA,0.90 V (mA cm−2) | jmass,0.90 V (mA mgPt−1) | |||
| Pt/C | 47 | 0.39 | 183 | 0.91 | 0.892 | 0.32 | 214 | This work |
| PtCo | 24 | 2.17 | 513 | 1.18 | 0.913 | 1.32 | 342 | This work |
| PtCu | 28 | 2.63 | 741 | 1.24 | 0.934 | 2.42 | 742 | This work |
| PtNi | 19 | 1.61 | 308 | 1.19 | 0.904 | 1.19 | 256 | This work |
| PtCo | 5(1) (ref. 40) | 1300(500) (ref. 40) | 1.11 (ref. 40) | 0.74 (ref. 47) | 303 (ref. 47) | 40 and 47 | ||
| PtCo | 23 (ref. 41) | 5(1) (ref. 41) | 600(400) (ref. 41) | 0.804 (ref. 48) | 380 (ref. 48) | 41 and 48 | ||
| PtCu | 4.2(1) (ref. 42) | 1.6 (ref. 42) | 0.68 (ref. 49) | 350 (ref. 49) | 42 and 49 | |||
| PtCu | 4.1(1) (ref. 43) | 0.42 (ref. 50) | 280 (ref. 50) | 43 and 50 | ||||
| PtNi | 51 (ref. 44) | 1.37 (ref. 44) | 700 (ref. 44) | 0.960 (ref. 45) | 18 (ref. 45) | 44 and 45 | ||
| PtNi | 22 (ref. 41) | 4(1) (ref. 41) | 490(400) (ref. 41) | 0.916 (ref. 46) | 1.23 (ref. 46) | 650 (ref. 46) | 41 and 46 | |
In order to further evaluate the practical performance of the catalysts, we tested the stability of these three alloys in the 0.1 M HClO4 solution in the potential range 0.05–1.4 V vs. RHE for 10000 cycles of CV scanning. The percentage of ECSAs area after certain cycles relative to the initial ones were recorded, and then compared it with the commercial Pt/C catalyst. As shown in Fig. 8d, the ECSAs of mesoporous PtCo, PtCu and PtNi alloys increase firstly in the first 100 cycles and then decrease in the following stage of CV curves. The ECSA increase of mesoporous PtM (M = Co, Cu, Ni) catalyst was related to the M dissolution in the potential excursion.46 After 10000 cycles of CV scanning, the ECSAs of mesoporous PtCo, PtCu and PtNi are 22%, 14% and 15% of the initial area, respectively, while the ECSA of commercial Pt/C catalyst has been reduced to about 1% of the initial area. It was speculated that the ECSA of the commercial Pt/C catalyst decreased rapidly due to Ostwald ripening and Pt loss into the ionomer phase, and the higher ECSA loss rates are related the upper potential limit of the voltage cycle, which is up to 1.4 V (vs. RHE).53 In addition, the stability of mesoporous PtCu alloy with good ORR activity among the three alloys is lower than that of the other two alloys. The PtCu alloy contains relatively soluble Cu elements, which affects the stability of the alloy, but its stability is still significantly higher than that of commercial Pt/C catalyst.
4. Conclusions
A series of binary PtM (M = Co, Cu, Ni) catalysts with 3D bicontinuous ultrafine porous structure were produced by rapid solidification and two-step dealloying, and the average size of ligaments were 2.7 ± 0.5 nm, 2.6 ± 0.4 nm and 2.7 ± 0.7 nm, respectively. Electrochemical tests show that the methanol catalytic performance and oxygen reduction performance of these three PtM binary catalysts are much better than those of commercial Pt/C catalyst, and the addition of Cu is more conducive to the improvement of electrocatalytic MOR and ORR performance. The addition of different transition elements Co, Cu and Ni optimizes the electronic structure of Pt to different degrees, and thus improves the catalytic performance to varying degrees, which indicates that the change of alloyed electronic structure has an important influence on the catalytic performance.Conflicts of interest
There are no conflicts to declare.Acknowledgements
The authors gratefully acknowledge financial support by Youth Program of National Natural Science Foundation of China (51701244) and the Key Scientific Research Projects of Colleges and Universities in Henan Province (16A430033).References
- B. G. Pollet, S. S. Kocha and I. Staffell, Curr. Opin. Electrochem., 2019, 16, 90–95 CrossRef CAS.
- Z. P. Cano, D. Banham, S. Ye, A. Hintennach, J. Lu, M. Fowler and Z. Chen, Nat. Energy, 2018, 3, 279–289 CrossRef.
- N. Kakati, J. Maiti, S. H. Lee, S. H. Jee, B. Viswanathan and Y.-S. Yoon, Chem. Rev., 2014, 114, 12397–12429 CrossRef CAS PubMed.
- Z. Xia, X. Zhang, H. Sun, S. Wang and G. Sun, Nano Energy, 2019, 65, 104048 CrossRef CAS.
- R. Bashyam and P. Zelenay, Nature, 2006, 443, 63–66 CrossRef CAS PubMed.
- I. E. L. Stephens, J. Rossmeisl and I. Chorkendorff, Science, 2016, 354, 1378–1379 CrossRef CAS PubMed.
- S. Yi, H. Jiang, X. Bao, S. Zou, J. Liao and Z. Zhang, J. Electroanal. Chem., 2019, 848, 113279 CrossRef CAS.
- X. X. Wang, J. Sokolowski, H. Liu and G. Wu, Chin. J. Catal., 2020, 41, 739–755 CrossRef CAS.
- Y.-J. Wang, N. Zhao, B. Fang, H. Li, X. Bi and H. Wang, Chem. Rev., 2015, 115, 3433–3467 CrossRef CAS PubMed.
- S. Huang, A. Shan and R. Wang, Catalysts, 2018, 8, 538 CrossRef.
- J. Zhang, H. Ma, D. Zhang, P. Liu, F. Tian and Y. Ding, Phys. Chem. Chem. Phys., 2008, 10, 3250–3255 RSC.
- Y. Xia, Y. Xiong, B. Lim and S. E. Skrabalak, Angew. Chem., Int. Ed., 2009, 48, 60–103 CrossRef CAS PubMed.
- X. Zhao, S. Chen, Z. Fang, J. Ding, W. Sang, Y. Wang, J. Zhao, Z. Peng and J. Zeng, J. Am. Chem. Soc., 2015, 137, 2804–2807 CrossRef CAS PubMed.
- Y. Nie, L. Li and Z. Wei, Chem. Soc. Rev., 2015, 44, 2168–2201 RSC.
- Z. Peng and H. Yang, J. Am. Chem. Soc., 2009, 131, 7542–7543 CrossRef CAS PubMed.
- L. Gan, S. Rudi, C. Cui, M. Heggen and P. Strasser, Small, 2016, 12, 3189–3196 CrossRef CAS PubMed.
- J. Lai, B. Huang, Y. Tang, F. Lin, P. Zhou, X. Chen, Y. Sun, F. Lv and S. Guo, Chem, 2018, 4, 1153–1166 CAS.
- J. L. Zhang, Y. Mo, M. B. Vukmirovic, R. F. Klie, K. Sasaki and R. Adzic, J. Phys. Chem. B, 2004, 108, 10955–10964 CrossRef CAS.
- J. Zhang, M. B. Vukmirovic, K. Sasaki, A. U. Nilekar, M. Mavrikakis and R. R. Adzic, J. Am. Chem. Soc., 2005, 127, 12480–12481 CrossRef CAS PubMed.
- Y. Dai and S. Chen, Int. J. Hydrogen Energy, 2016, 41, 22976–22982 CrossRef CAS.
- L. Y. Chen, T. Fujita, Y. Ding and M. W. Chen, Adv. Funct. Mater., 2010, 20, 2279–2285 CrossRef CAS.
- H. J. Jin, X. L. Wang, S. Parida, K. Wang, M. Seo and J. Weissmüller, Nano Lett., 2009, 10, 187–194 CrossRef PubMed.
- Y. Yu, L. Gu, X. Lang, C. Zhu, T. Fujita, M. W. Chen and J. Maier, Adv. Mater., 2011, 23, 2443–2447 CrossRef CAS PubMed.
- H. Su, Q. Tian, C.-A. H. Price, L. Xu, K. Qian and J. Liu, Nano Today, 2020, 31, 100834 CrossRef CAS.
- Y. Qiao and C. M. Li, J. Mater. Chem., 2011, 21, 4027–4036 RSC.
- D. Wang, Y. Yu, J. Zhu, S. Liu, D. A. Muller and H. D. Abruña, Nano Lett., 2015, 15, 1343–1348 CrossRef CAS PubMed.
- Z. Chen, M. Waje, W. Li and Y. Yan, Angew. Chem., Int. Ed., 2007, 46, 4060–4063 CrossRef CAS PubMed.
- J. Zhang, K. Sasaki, E. Sutter and R. R. Adzic, Science, 2007, 315, 220–222 CrossRef CAS PubMed.
- J. Greeley, I. E. L. Stephens, A. S. Bondarenko, T. P. Johansson, H. A. Hansen, T. F. Jaramillo, J. Rossmeisl, I. Chorkendorff and J. K. Nørskov, Nat. Chem., 2009, 1, 552–556 CrossRef CAS PubMed.
- V. Stamenkovic, B. S. Mun, K. J. J. Mayrhofer, P. N. Ross, N. M. Markovic, J. Rossmeisl, J. Greeley and J. K. Nørskov, Angew. Chem., Int. Ed., 2006, 118, 2963–2967 CrossRef.
- J. Sun, J. Shi, J. Xu, X. Chen, Z. Zhang and Z. Peng, J. Power Sources, 2015, 279, 334–344 CrossRef CAS.
- J. Erlebacher, M. J. Aziz, A. Karma, N. Dimitrov and K. Sieradzki, Nature, 2001, 410, 450–453 CrossRef CAS PubMed.
- J. A. Forty, Nature, 1979, 282, 597–598 CrossRef.
- N. M. Marković and P. N. Ross, Surf. Sci. Rep., 2002, 45, 117–229 CrossRef.
- H. A. Gasteiger, N. M. Marković, P. N. Ross and E. J. Cairns, J. Electrochem. Soc., 1994, 141, 1795–1803 CrossRef CAS.
- S. Sriramulu, T. D. Jarvi and E. M. Stuve, Electrochim. Acta, 1998, 44, 1127–1134 CrossRef CAS.
- P. Strasser, S. Koh, T. Anniyev, J. Greeley, K. More, C. Yu, Z. Liu, S. Kaya, D. Nordlund, H. Ogasawara, M. F. Toney and A. Nilsson, Nat. Chem., 2010, 2, 454–460 CrossRef CAS PubMed.
- Y. Wu, D. Wang, Z. Niu, P. Chen, G. Zhou and Y. Li, Angew. Chem., Int. Ed., 2012, 51, 12524–12528 CrossRef CAS PubMed.
- J. Xu, X. Liu, Y. Chen, Y. Zhou, T. Lu and Y. Tang, J. Mater. Chem., 2012, 22, 23659–23667 RSC.
- H. Qiu and F. Zou, ACS Appl. Mater. Interfaces, 2012, 4, 1404–1410 CrossRef CAS PubMed.
- C. Xu, J. Hou, X. Pang, X. Li, M. Zhu and B. Tang, Int. J. Hydrogen Energy, 2012, 37, 10489–10498 CrossRef CAS.
- D. Xu, Z. Liu, H. Yang, Q. Liu, J. Zhang, J. Fang, S. Zou and K. Sun, Angew. Chem., Int. Ed., 2009, 48, 4217–4221 CrossRef CAS PubMed.
- H. Yang, L. Dai, D. Xu, J. Fang and S. Zou, Electrochim. Acta, 2010, 55, 8000–8004 CrossRef CAS.
- P. Yang, X. Yuan, H. Hu, Y. Liu, H. Zheng, D. Yang, L. Chen, M. Cao, Y. Xu, Y. Min, Y. Li and Q. Zhang, Adv. Funct. Mater., 2017, 1704774, 1–8 Search PubMed.
- J. Snyder, T. Fujita, M. W. Chen and J. Erlebacher, Nat. Mater., 2010, 9, 904–907 CrossRef CAS PubMed.
- R. Wang, C. Xu, X. Bi and Y. Ding, Energy Environ. Sci., 2012, 5, 5281–5286 RSC.
- S. Jiang, Y. Ma, G. Jian, H. Tao, X. Wang, Y. Fan, Y. Lu, Z. Hu and Y. Chen, Adv. Mater., 2009, 21, 4953–4956 CrossRef CAS PubMed.
- M. Oezaslana and P. Strasser, J. Power Sources, 2011, 196, 5240–5249 CrossRef.
- I. Dutta, M. K. Carpenter, M. P. Balogh, J. M. Ziegelbauer, T. E. Moylan, M. H. Atwan and N. P. Irish, J. Phys. Chem. C, 2010, 114, 16309–16320 CrossRef CAS PubMed.
- C. Xu, H. Zhang, Q. Hao and H. Duan, ChemPlusChem, 2014, 79(1), 107–113 CrossRef CAS PubMed.
- J. K. Nørskov, J. Rossmeisl, A. Logadottir, L. Lindqvist, J. R. Kitchin, T. Bligaard and H. Jónsson, J. Phys. Chem. B, 2004, 108, 17886–17892 CrossRef.
- J. Rossmeisl, G. Karlberg, T. Jaramillo and J. Nørskov, Faraday Discuss., 2009, 140, 337–346 RSC.
- A. Kneer and N. Wagner, J. Electrochem. Soc., 2019, 166, F120–F127 CrossRef CAS.
| This journal is © The Royal Society of Chemistry 2021 |