 Open Access Article
Novel poly(arylene ether ketone)/poly(ethylene glycol)-grafted poly(arylene ether ketone) composite microporous polymer electrolyte for electrical double-layer capacitors with efficient ionic transport†
Fangyuan Hu *a,
Yiting Liua,
Wenlong Shaob,
Tianpeng Zhanga,
Siyang Liua,
Dongming Liua,
Shouhai Zhang
 b and
Xigao Jian
 ab
ab
aSchool of Materials Science and Engineering, State Key Laboratory of Fine Chemicals, Key Laboratory of Energy Materials and Devices (Liaoning Province), Liaoning Province Engineering Centre of High Performance Resins, Dalian University of Technology, Dalian, 116024, China. E-mail: hufangyuan@dlut.edu.cn
bState Key Laboratory of Fine Chemicals, Liaoning Province Engineering Research Centre of High Performance Resins, Dalian University of Technology, Dalian, 116024, China
First published on 21st April 2021
Abstract
Polymer electrolytes have attracted considerable research interest due to their advantages of shape control, excellent safety, and flexibility. However, the limited use of traditional polymer electrolytes in electric double-layer capacitors due to their unsatisfactory ionic conductivities and poor mechanical properties makes them difficult to operate for long periods of time in large-scale energy storage. Therefore, we fabricated a high-performance microporous electrolyte based on poly(arylene ether ketone) (PAEK)/poly(ethylene glycol)-grafted poly(arylene ether ketone) (PAEK-g-PEG) using a certain amount of carboxylated chitosan with a high electrolyte uptake rate of 322 wt% and a high ionic conductivity of 2 × 10⁻² S cm−1 at room temperature. A symmetric solid-state supercapacitor that uses activated carbon as electrodes and a composite microporous polymer film as the electrolyte shows a high specific capacitance of 134.38 F g−1 at a current density of 0.2 A g−1, while liquid electrolytes demonstrate a specific capacitance of 126.92 F g−1. Energy density of the solid-state supercapacitor was 15.82% higher than that of the liquid supercapacitor at a current density of 5 A g−1. In addition, the solid-state supercapacitor exhibited excellent cycling stability of over 5000 charge/discharge cycles at a current density of 1 A g−1. Furthermore, solid-state supercapacitors display lower self-discharge behavior with an open-circuit potential drop of only 36% within 70![[thin space (1/6-em)]](https://www.rsc.org/images/entities/char_2009.gif) 000 s, which is significantly better than that of conventional supercapacitors (52% @ 70
000 s, which is significantly better than that of conventional supercapacitors (52% @ 70![[thin space (1/6-em)]](https://www.rsc.org/images/entities/char_2009.gif) 000 s), at a charging current density of 1 mA cm−2. The satisfactory results indicated that the PAEK/PAEK-g-PEG composite microporous polymer film demonstrates high potential as an electrolyte material in practical applications of solid-state and portable energy storage devices.
000 s), at a charging current density of 1 mA cm−2. The satisfactory results indicated that the PAEK/PAEK-g-PEG composite microporous polymer film demonstrates high potential as an electrolyte material in practical applications of solid-state and portable energy storage devices.
1. Introduction
Renewable energy storage and conversion systems have attracted considerable research attention due to the irreversible consumption of fossil fuels and growing energy demand.1,2 Among various electrochemical energy storage systems, electric double-layer capacitors (EDLCs) are effective renewable energy storage systems and promising devices because of their high power density, satisfactory cyclic life, and rapid charge/discharge rate.3,4 These advantages of EDLCs satisfy the requirement of portable electronic devices, energy-efficient industrial equipment, and hybrid electric vehicles.5,6The performance of EDLCs mainly depends on the electrode material and electrolyte used.7–9 Many electrode materials have been developed to improve the performance of EDLCs (e.g., energy density and specific capacitance).10,11 Apart from electrodes, electrolytes are also a crucial component that significantly affects specific energy, lifespan, operating voltage, and safety properties of EDLCs.12 Traditional liquid electrolytes are widely used despite their limitations, such as their susceptibility to leakage during usage and nonflexibility.13–15 Furthermore, flammable organic liquid electrolytes can result in the risk of combustion. These factors have impeded the practical application of EDLCs in large-scale energy storage systems.13 Solid electrolytes were developed to overcome the shortcomings of their liquid counterpart. Meanwhile, polymer electrolytes have attracted considerable research attention due to their excellent safety and flexibility. The three types of polymer electrolytes include solid (SPEs),16 gel (GPEs), and microporous (MPEs) polymer electrolytes.17,18 Ion conductivity of SPEs is excessively low at room temperature despite their satisfactory mechanical properties. The ionic conductivity of GPEs at room temperature is similar to that of liquid electrolyte, but their excessively poor mechanical properties make them unsuitable for large-scale energy storage.18 An ideal solid electrolyte should exhibit excellent ionic conductivity at room temperature and sufficient mechanical strength.19 MPEs with these features are considered promising electrolytes because of their micropores, polymer membrane matrix, and ability to retain a large amount of electrolytes in the pore structure to ensure ionic conductivity.12 Nonsolvent-induced phase separation (NIPS), a conventional method for fabricating MPEs, has been used to create ion transport channels.20 The hydrophilic segment of copolymer moves to the isopropanol-rich phase and remains on the pore surface of the obtained porous membrane when a copolymer is used to prepare porous membranes in the NIPS process with isopropanol as the coagulation bath. This method has been widely used in the fabrication of functional porous polymer membranes.21 Moreover, the ionic conductivity mainly depends on the absorption of MPEs by micropores. The morphology of MPEs, including porosity, pore size, and pore distribution, remarkably affects the absorption of electrolytes and thus seriously influences the ionic conductivity of MPEs.22,23
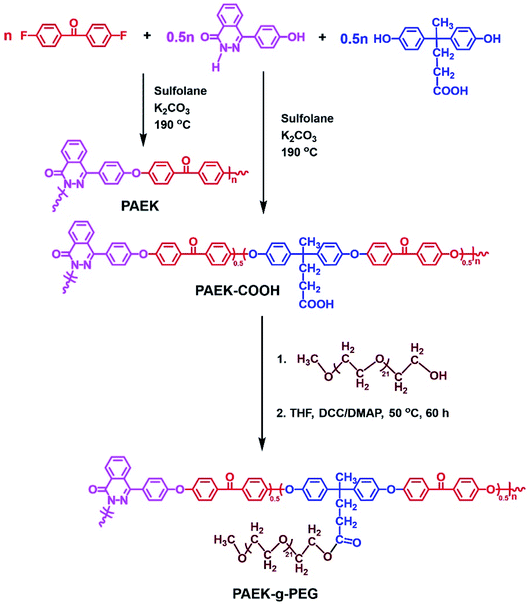
Many polymers, such as polyvinyl alcohol (PVA),24 poly(ethylene oxide) (PEO),25 polyacrylonitrile (PAN),26 poly(vinylidene fluoride) (PVDF),27 poly(vinylidene fluoride-co-hexafluoropropylene) (PVDF-HFP),28 and their blends, are used in MPEs. PEO-based polymers are widely applied in electrolytes due to their unique structure, which can form complexes with lithium salt.29,30 Poly(ethylene glycol) (PEG) was selected as the hydrophilic segment in the preparation of porous membranes in previous studies.31 In summary, these advantages of PEO-based polymers can lead to high ionic conductivity.32 However, excessively poor mechanical properties of PEO-based polymers make them unsuitable for the application of MPEs.12 Therefore, developing new material for MPEs with mechanical properties and high solvation efficiency with lithium salts is critical. Poly(arylene ether ketone) (PAEK) polymers are a thermoplastic material with excellent thermal and mechanical properties widely applied in fuel cells.33–35 However, the immiscibility of PAEK and PEG can lead to large-scale phase separation. Na et al.12 prepared PAEK/PAEK-g-PEG composite MPEs that demonstrate high ionic conductivity of 8 × 10⁻³ S cm−1 at room temperature via grafting method to increase their compatibility. However, synthesized polymers contain a certain amount of fluorine, which can cause air pollution by releasing fluorine-containing gases in the event of dangerous combustion, and the low porosity caused by the nonideal porous structure of the membrane limits the further improvement of ion conductivity. We molecularly designed and developed high-performance PAEK material with satisfactory mechanical properties and excellent thermal stability. The results of our previous studies indicated that the use of total aryl, twisted and noncoplanar 4-(4-hydroxyl-phenyl)(2H)-phthalazine-1-one (DHPZ) effectively increases thermal properties and solubility of PAEK.36–39 Therefore, PAEK was synthesized via aromatic nucleophilic substitution reaction and PAEK-g-PEG was synthesized using PAEK with free carboxyl groups and asymmetric methoxypolyethylene glycol to introduce PEG pendant groups through catalyzed esterification reactions of N,N′-dicyclohexylcarbodiimide (DCC) and 4-(dimethylamino)pyridine (DMAP). The PAEK main-chain backbone of PAEK-g-PEG shows excellent compatibility with PAEK, while PEG pendant groups show affinity with nonsolvent isopropanol through a hydrogen bond that results in enhanced pore structures. In addition, the formation of complexes of EO units in PAEK-g-PEG with lithium ion is beneficial to the transport of lithium ions and further improvement of the ionic conductivity.40,41
This study aimed to fabricate a high-performance MPE with excellent thermal stability and high ionic conductivity for EDLCs. We mixed PAEK-g-PEG with PAEK as the MPE matrix. The porosity, pore distribution, and diameter of MPEs can be controlled by adjusting the content of PAEK-g-PEG segments. Suitability of MPEs with high porosity and acceptable mechanical properties was determined by adjusting the ratio of the two components. The aqueous LiClO4 solid electrolyte was obtained by adding the appropriate amount of chitosan to improve the liquid-retention capacity of electrolytes. The PAEK/PAEK-g-PEG composite membrane was then soaked in the aqueous LiClO4 electrolyte with chitosan to form MPEs. Solid-state EDLCs with activated carbon as the electrode were prepared using the obtained MPEs. The electrochemical performance of EDLC with MPEs and commercial separators were investigated via cyclic voltammetry (CV), galvanostatic charge/discharge (GCD) measurements, electrochemical impedance spectroscopy (EIS), and self-discharge tests.
2. Experimental
2.1 Material synthesis
![[double bond, length as m-dash]](https://www.rsc.org/images/entities/char_e001.gif) O), 1591, 1504 (Ar), 1237 (Ar–O–Ar).
O), 1591, 1504 (Ar), 1237 (Ar–O–Ar).
PAEK–COOK was prepared using a similar synthesis procedure to that of PAEK. Then, 10 g of PAEK–COOK was dissolved in 200 ml of THF and 20 ml of concentrated HCl was added in a drop-wise manner while stirring. The mixture was continuously stirred for 8 h to ensure that the reaction was completed. Third, the product was poured in deionized water and dried to constant weight. Yield (82%). Mn: 24.4 kg mol−1. IR (Fig. S2†): νmax (cm−1): 1730 (O![[double bond, length as m-dash]](https://www.rsc.org/images/entities/char_e001.gif) C–OH), 1591, 1504 (Ar), 1237 (Ar–O–Ar), 1661 (Ar–C
C–OH), 1591, 1504 (Ar), 1237 (Ar–O–Ar), 1661 (Ar–C![[double bond, length as m-dash]](https://www.rsc.org/images/entities/char_e001.gif) O).
O).
The synthesis procedure of the PAEK-g-PEG polymer was conducted as follows: 10 g of PAEK–COOH, 30 g (30 mmol) of MPEG (methoxypolyethylene glycol, Mn = 1000 g mol−1), 100 ml of anhydrous THF were added to a three-necked flask equipped with a mechanical stirrer and nitrogen inlet in nitrogen atmosphere. The mixture was continuously stirred until it was dissolved. An anhydrous THF solution (30 ml) made of 2.536 g (12.3 mmol) of DCC and 0.150 g (1.23 mmol) of DMAP was added in a drop-wise manner in 2 h to avoid the formation of gel. The reaction was continued at 50 °C for 60 h under nitrogen. The solution was filtered to remove the precipitate (dicyclohexylurea, DCU) and then precipitated in deionized water. The product was boiled thrice to remove the unreacted MPEG and then dried in a vacuum at 80 °C for 48 h. Yield: 78%. Mn: 33.9 kg mol−1. IR (Fig. S2†): νmax (cm−1): 1730 (O![[double bond, length as m-dash]](https://www.rsc.org/images/entities/char_e001.gif) C–O–R), 1661 (Ar–C
C–O–R), 1661 (Ar–C![[double bond, length as m-dash]](https://www.rsc.org/images/entities/char_e001.gif) O), 1591, 1504 (Ar), 1103 (–C–O–C–), 1237 (Ar–O–Ar), 2928 (–CH2).
O), 1591, 1504 (Ar), 1103 (–C–O–C–), 1237 (Ar–O–Ar), 2928 (–CH2).
2.2 Preparation of PAEK/PAEK-g-PEG composite microporous polymer electrolyte
Microporous PAEK/PAEK-g-PEG composite membranes were fabricated via the NIPS process using 1-methyl-2-pyrrolidone (NMP) as the solvent of PAEK/PAEK-g-PEG and isopropanol as the coagulant (nonsolvent) (Scheme 2). PAEK and PAEK-g-PEG polymers were dissolved in NMP (solvent) and the mixture was stirred until a homogeneous solution formed. The viscous solution was then casted onto a clean glass plate at a temperature and humidity of 20 °C and 60%, respectively, for 3 minutes. The glass plate was then immersed in isopropanol for 30 minutes. Microporous membranes were prepared after drying to a constant weight in an oven at 80 °C for 24 h (as shown in Fig. S3†). The weight ratio of the PAEK to PAEK-g-PEG in membranes was 10![[thin space (1/6-em)]](https://www.rsc.org/images/entities/char_2009.gif) :
:![[thin space (1/6-em)]](https://www.rsc.org/images/entities/char_2009.gif) 0, 9
0, 9![[thin space (1/6-em)]](https://www.rsc.org/images/entities/char_2009.gif) :
:![[thin space (1/6-em)]](https://www.rsc.org/images/entities/char_2009.gif) 1, 8
1, 8![[thin space (1/6-em)]](https://www.rsc.org/images/entities/char_2009.gif) :
:![[thin space (1/6-em)]](https://www.rsc.org/images/entities/char_2009.gif) 2, 7
2, 7![[thin space (1/6-em)]](https://www.rsc.org/images/entities/char_2009.gif) :
:![[thin space (1/6-em)]](https://www.rsc.org/images/entities/char_2009.gif) 3, and 6
3, and 6![[thin space (1/6-em)]](https://www.rsc.org/images/entities/char_2009.gif) :
:![[thin space (1/6-em)]](https://www.rsc.org/images/entities/char_2009.gif) 4 and then labeled S0, S1, S2, S3, and S4, respectively (Table 1).
4 and then labeled S0, S1, S2, S3, and S4, respectively (Table 1).
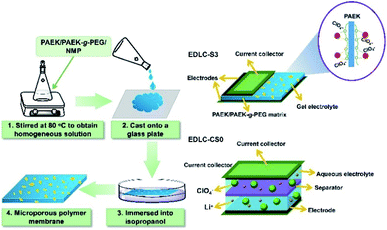 | ||
| Scheme 2 Preparation of PAEK/PAEK-g-PEG composite micro-porous membranes and schematic diagram of the EDLC-S3 formed using S3 as the MPE and that of the EDLC-CS0 using CS0 as the separator. | ||
A certain amount of carboxylated chitosan (mass fractions of carboxylated chitosan in LiClO4 aqueous solution were 0, 1, 2, and 4 wt%) was added to the prepared 1 M LiClO4 aqueous solution. The mixture was stirred continuously until the carboxylated chitosan dissolved completely. Microporous membranes were soaked in the LiClO4 electrolyte solution for 1 h to prepare MPEs, which were then labeled C0, C1, C2, and C4. The commercial separator (NKK-MPF30AC-100) was also immersed in the 1 M LiClO4 electrolyte without chitosan for comparison and then labeled CS0 (Table 2).
| Label | Membrane matrix | Carboxylated chitosan (wt%) |
|---|---|---|
| C0 | S3 | 0 |
| C1 | S3 | 1 |
| C2 | S3 | 2 |
| C4 | S3 | 4 |
| CS0 | NKK-MPF30AC-100 | 0 |
2.3 Characterization
The porosity (P%) of microporous membranes was calculated using the ethanol uptake test as follows:17
 | (1) |
The electrolyte absorption (W%) and leakage capacity (WL%) of membranes were determined as follows:44
 | (2) |
 | (3) |
2.4 Electrode preparation, symmetric EDLC assembly, and electrochemical characterization of MPEs
EDLC was assembled by sandwiching MPEs between activated carbon electrodes to evaluate its electrochemical performance with MPEs (as shown in Fig. S5b, S6a and b†). Activated carbon cathode was prepared using a mixture of activated carbon, acetylene black, and PTFE at a weight ratio of 8![[thin space (1/6-em)]](https://www.rsc.org/images/entities/char_2009.gif) :
:![[thin space (1/6-em)]](https://www.rsc.org/images/entities/char_2009.gif) 1
1![[thin space (1/6-em)]](https://www.rsc.org/images/entities/char_2009.gif) :
:![[thin space (1/6-em)]](https://www.rsc.org/images/entities/char_2009.gif) 1.
1.
The ionic conductivity of MPEs was measured via electrochemical impedance spectroscopy (EIS) measurements using a VMP3 electrochemical workstation with a voltage amplitude of 10 mV in the frequency range of 100 kHz to 1 Hz. Impedance spectra were obtained from 20 °C to 60 °C. The electrolyte membrane is sandwiched in two parallel stainless steel (as shown in Fig. S5a†). Ionic conductivity σ was calculated as follows:45
 | (4) |
Cyclic voltammetry (CV), galvanostatic charging/discharging (GCD) and electrochemical impedance spectroscopy (EIS) tests of EDLC were performed using a VMP3 electrochemical workstation. The cyclic voltammetry (CV) was measured at different scan rates (5–200 mV s−1) with a potential window of 0–1.5 V. The galvanostatic charge/discharge (GCD) test was recorded at various current densities (0.2, 0.5, 1, 2, and 5 A g−1) in a potential range of 0–1.5 V. EIS measurements were carried out in a frequency range of 0.01 Hz to 100 kHz with a potential amplitude of 10 mV. The specific capacitance (Cs, F g−1), energy density (Ecell, W h kg−1), and power density (Pcell, W kg−1) of the symmetrical electrode were calculated as follows:46
 | (5) |
 | (6) |
 | (7) |
3. Results and discussion
3.1 Analysis of chemical structures of polymers
1H NMR and FT-IR spectroscopies are performed to characterize polymers (PAEK, PAEK–COOH, and PAEK-g-PEG), as shown in Fig. S1 and S2,† respectively. Fig. S1a† show that proton signals at δ = 8.62, 7.96 ppm were assigned to H1, H2,3,4 of DHPZ while those at δ = 7.84, 7.69, 7.16, ppm were assigned to H9,10, H8 and H7 of DFBP. In Fig. S1b† peaks at 12.06, 2.35, 2.01, 1.58 were assignable to protons H15, H12, H13 and H14. Notably, new peaks in Fig. S1c† were observed at 3.63 and 3.37 ppm in the PAEK-g-PEG spectrum due to the grafted PEG segments. Structures of these copolymers were further confirmed via FT-IR spectroscopy (Fig. S2†). Absorption bands at 1103 and 2928 cm−1 were formed due to the respective stretching vibrations of –C–O–C– and –CH2 in grafted PEG segments. As expected, polymers PAEK, PAEK–COOH, and PAEK-g-PEG were successfully synthesized.3.2 Thermal characterization and morphologies of composite microporous membranes
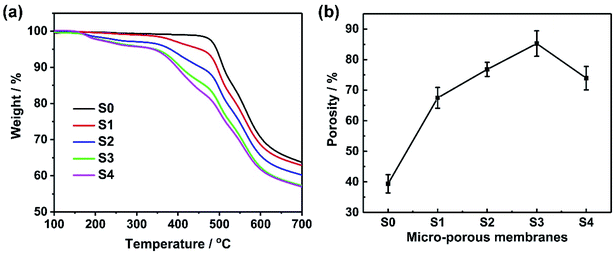
Thermal stabilities of MPEs were investigated via TGA. The results are shown in Fig. 1a. TGA curves of composite membranes indicated a two-step weight loss process, except for the pure PAEK membrane (S0). The weight loss in the first step occurred at 175 °C, which was considered the loss of grafted PEG pendants. The weight loss in the second step occurred at 375 °C, which was considered the loss of the PAEK polymer backbone. However, T5% of all membranes was higher than 220 °C. Therefore, the thermal stability of composite microporous polymer membranes can be used for the electrolyte membrane of supercapacitors.Fig. 2 and S4† show the SEM images of composite microporous membranes and commercial separator. The number of pores and pore diameter on the surface increased and reached the maximum when the PAEK-g-PEG content was approximately 30 wt%. The PAEK-g-PEG content further increased and the pore distribution became sparse. This is because the hydrophilic segment of PEG interacts properly with isopropanol through hydrogen bonds. Hence, isopropanol was evenly dispersed in the membrane during the solvent–nonsolvent exchange and the pore distribution was uniform and dense. The interaction resulted in the retardation of the solvent–nonsolvent exchange in the composite membrane and increase of pore size. However, the accumulation of isopropanol mainly in the PEG phase decreased the pore distribution when the PAEK-g-PEG content was 40%. The creation of ion transport channels in microporous membranes was presented in this work. The hydrophilic PEG segment moved to the isopropanol-rich phase and remained on the resulting pore surface in the process of pore formation.47,48 Therefore, this pore structure of composite microporous membranes was beneficial to the transport of lithium ions. The ionic conductivity of MPEs mainly depends on the liquid phase.44 Therefore, the porosity of composite microporous membranes is a significant factor, which was measured via the ethanol uptake test. The results are presented in Table 1 and Fig. 1b. The porosity of polymer membranes reach the maximum value (84.2%), which was significantly greater than that of the commercial separator (39.6%), when the ratio of PAEK to PAEK-g-PEG was 7![[thin space (1/6-em)]](https://www.rsc.org/images/entities/char_2009.gif) :
:![[thin space (1/6-em)]](https://www.rsc.org/images/entities/char_2009.gif) 3. Furthermore, the result was consistent with SEM images (Fig. 2).
3. Furthermore, the result was consistent with SEM images (Fig. 2).
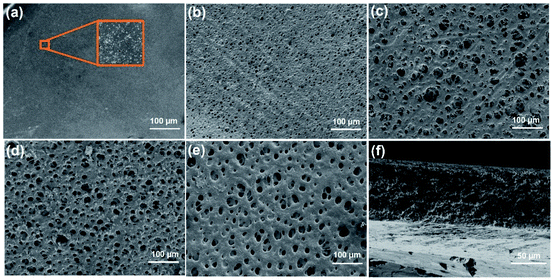 | ||
| Fig. 2 Surface morphologies of the fabricated micro-porous membranes (a) S0, (b) S1, (c) S2, (d) S3, and (e) S4 and (f) cross-section image of S3. | ||
Morphologies and porosities of composite microporous membranes demonstrated that S3 is the most suitable electrolyte membrane for supercapacitors.
3.3 Aqueous electrolyte absorption and leakage rates of MPEs
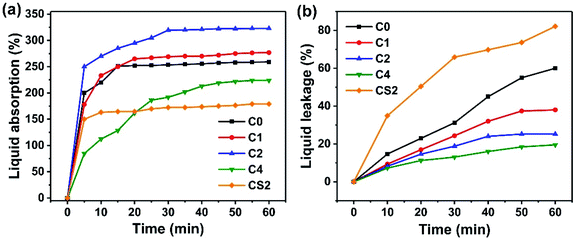
Ion transport mainly occurs in the liquid phase of microporous polymer membranes. Therefore, absorption and leakage rates of the aqueous electrolyte directly influence the transport of ions. Absorption and leakage rates of the microporous electrolyte membrane S3 and the commercial separator are shown in Fig. 3a and b, respectively.The liquid absorption of S3 first increased and then decreased when a certain amount of chitosan was added to the LiClO4 aqueous electrolyte and the liquid absorption rate reached the maximum when the chitosan content was 2% because carboxylated chitosan contains a lot of amino (–NH2), hydroxyl (–OH) and carboxyl groups (–COOH). Due to the presence of a large number of hydrophilic groups, it has a high degree of hydrophilicity, which helps to maintain a high moisture content in the polymer matrix, thus enhancing the ionic conductivity. However, the further increase in the concentration of chitosan in the liquid, the volume fraction of carboxylated chitosan increases more and the carboxylated chitosan in the porous membrane becomes the main component, while the water content is greatly reduced. In addition, the liquid absorption of the commercial separator immersed in the aqueous electrolyte containing 2% chitosan was not as high as that of any S3 membrane mainly due to the low porosity of the commercial separator. The electrolyte leakage rate of the microporous electrolyte membrane S3 and the commercial separator are illustrated in Fig. 3b. The introduction of chitosan reduced the electrolyte leakage. The high content of chitosan indicates the low electrolyte leakage for S3. The leakage rate of the commercial separator was significantly greater than that of S3 when the chitosan content was 2% likely due to the affinity of PEO and chitosan.36 In conclusion, the maximum positive effect of the chitosan content of 2% in the aqueous LiClO4 electrolyte on absorption and leakage rates of microporous polymer membrane S3 is suitable for solid-state EDLCs. Therefore, we used the S3 membrane with 1 M LiClO4 aqueous solution with 2% chitosan concentration for the following experiments.
3.4 Ionic conductivities of the polymer electrolyte S3 using the 1 M LiClO4 aqueous solution with 2% chitosan concentration
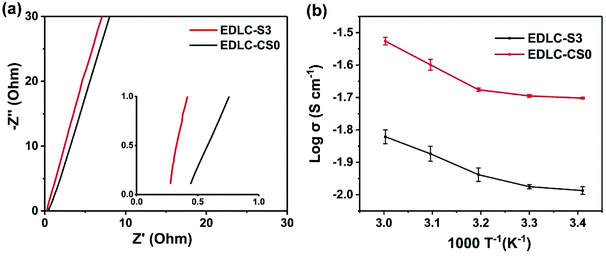
Ionic conductivity, a key parameter for electrolyte applications,19 was investigated at various temperatures (from 293 K to 333 K) for composite polymer electrolytes S3 and CS0. Fig. 4a and b present EIS Nyquist plot at 293 K and the temperature dependence of ionic conductivities in Arrhenius plots of CS0 and S3. The ionic conductivity of S3 and CS0 increased with increasing temperature. The thickness of S3 and commercial separator CS used in this test was approximately 105 and 92 μm, respectively. The results showed that the Li+ ion transport ability of S3 is nearly two times higher at 2 × 10⁻² S cm−1 at 293 K (as shown in Fig. 4a) and 2.98 × 10⁻² S cm−2 at 333 K compared with the ionic conductivity of CS0 at 1.03 × 10⁻² S cm−1 at 293 K. This finding exhibited that abundant pore structures allow the lithium ion to move freely while the affinity of the EO unit of the grafted PEG chain to Li+ ions further facilitates the transport of lithium ions.49,50 In addition, the ion transport of the composite microporous membrane is unhindered by the added carboxylated chitosan.3.5 Electrochemical performance of EDLC with MPE S3 and activated carbon electrodes
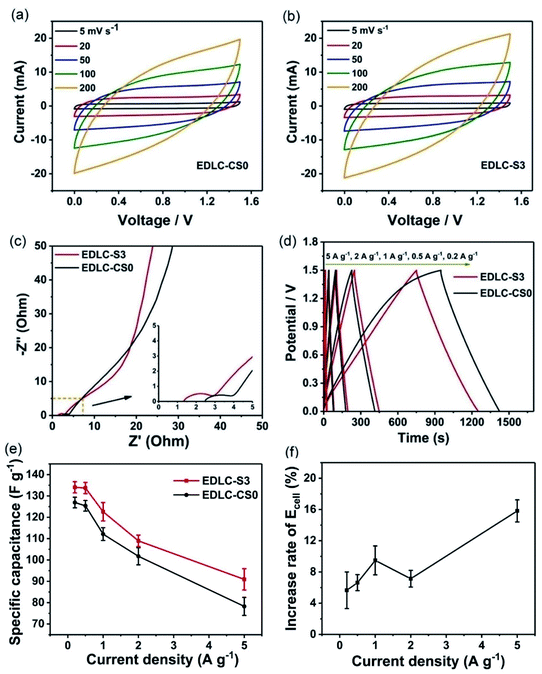
Two activated carbon (AC) electrodes with the same weight as working electrodes were assembled with S3 in the two-electrode system. The commercial separator with the 1 mol L−1 LiClO4 electrolyte without chitosan was assembled in the same way for comparison, as shown in Scheme 2. The two devices were labeled EDLC-S3 and EDLC-CS0. First, cyclic voltammograms of EDLC-S3 and EDLC-CS0 were obtained from 0.0 V to 1.5 V. Fig. 5a and b show that shapes of CV curves of EDLC-S3 and EDLC-CS0 were similar due to the excellent ionic conductivity. Quasi-rectangular shapes at scan rates of 5 and 100 mV s−1 indicated their ideal capacitive behavior and low contact resistance.12Electrochemical impedance spectroscopy (EIS) is commonly used to investigate the charge transfer in electrode, ion transport through electrolyte, and ion diffusion at the interface of electrolyte/electrode. We performed EIS measurements with frequencies from 0.01 Hz to 100 kHz for EDLC-S3 and EDLC-CS0, as shown in Fig. 5c. Nyquist plots of EDLC-S3 and EDLC-CS0 display a similar pattern. A linear part can be observed in the low-frequency region and a semicircle can be observed in the high-frequency region. A vertical line parallel to the imaginary axis (Z′′) was shown in the plots of both EDLC-S3 and EDLC-CS0 in the low-frequency region, thereby indicating the ideal capacitive behavior of EDLC-S3 and EDLC-CS0. Both EDLC-S3 and EDLC-CS0 showed semicircles at 1.53 and 1.35 Ω, respectively, in the high-frequency region, thereby indicating the slightly higher interface transfer resistance of S3 than CS0.51,52
The galvanostatic charge/discharge (GCD) curves for EDLC-S3 and EDLC-CS0 devices at various current densities (0.2–5 A g−1) in Fig. 6d exhibited a typical triangular shape that corresponds to ideal EDLC properties. The small voltage drop at the beginning of the discharging step for both of EDLC-S3 and EDLC-CS0 was associated with the overall resistance of the system.19,53 Notably, the discharge time of EDLC-S3 at 499 s was longer than that of EDLC-CS0 at 475 s under the same current density of 0.2 A g−1 and Cs values of EDLC-S3 and EDLC-CS0 were 134.38 and 126.92 F g−1, respectively. Hence, supercapacitors using S3 can obtain more specific capacitance than those with LiClO4 liquid electrolyte due to the same electrode materials of the two devices. Cs values at various current densities for EDLC-S3 and EDLC-CS0 are listed in Table S2.† Under all current densities, Cs values of EDLC-S3 were slightly higher than that of LiClO4 liquid electrolyte. The difference between EDLC-S3 and EDLC-CS0 is clearly illustrated in Fig. 5e. The Cs value decreased gradually with the increase of the current density due to the reduced ion diffusion into the electrode. Moreover, Ecell values of EDLC-S3 were also slightly higher than that of CS0 at different current densities. The energy density of the supercapacitor using S3 was 15.82% higher than that of the supercapacitor using CS0 under a current density of 5 A g−1 (Fig. 5f). These results can be attributed to the efficient ionic transport ability of S3.19 Li+ ions can diffuse into AC electrode pores more effectively, even at high current densities, due to the enhanced ionic transport ability of MPE S3 (Fig. 4), thereby enhancing Cs and Ecell values of supercapacitors.54,55
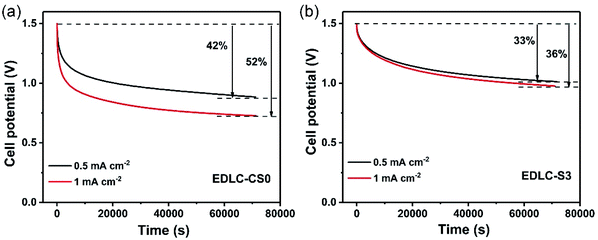 | ||
| Fig. 6 Open-circuit potential decays of (a) conventional liquid supercapacitor EDLC-CS0 and (b) solid-state supercapacitor EDLC-S3. | ||
Apart from the specific capacitance, energy density, and ionic conductivity, the rapid self-discharge phenomenon also severely limits the application of supercapacitors. Self-discharge tests for S3 and CS0 were performed. Fig. 6a and b show the decay of open-circuit potential after charging at different current densities (0.5 and 1 mA cm−2) for S3 and CS0, respectively. Compared with EDLC-CS0, EDLC-S3 displayed a lower self-discharge behavior of only 33% and 36% after charging current densities of 0.5 and 1 mA cm−2, respectively, within 70![[thin space (1/6-em)]](https://www.rsc.org/images/entities/char_2009.gif) 000 s. This finding is significantly better than that of conventional supercapacitors (42% and 52% after charging current densities of 0.5 and 1 mA cm−2, respectively, within 70
000 s. This finding is significantly better than that of conventional supercapacitors (42% and 52% after charging current densities of 0.5 and 1 mA cm−2, respectively, within 70![[thin space (1/6-em)]](https://www.rsc.org/images/entities/char_2009.gif) 000 s). Hence, S3 can restrain the self-discharge behavior of supercapacitors to a certain extent due to excellent electrical insulation characteristics of the electrolyte S3.56,57
000 s). Hence, S3 can restrain the self-discharge behavior of supercapacitors to a certain extent due to excellent electrical insulation characteristics of the electrolyte S3.56,57
The cycle stability of the EDLC-S3 device was also evaluated at a constant charging/discharging current density of 1 A g−1, as shown in Fig. 7. The capacitance retention value of EDLC-S3 remained nearly constant in over 5000 cycles due to the enhanced liquid retention ability of EDLC-S3. Owing to the flow and leakage of the aqueous electrolyte, the specific capacitance of the liquid supercapacitor EDLC-CS0 began to decay after 600 cycle. Therefore, excellent electrochemical characteristics of the composite microporous membrane achieved in this study indicate its suitability for use in practical EDLCs.
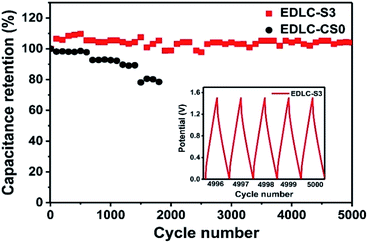 | ||
| Fig. 7 Capacitance retention of the solid-state supercapacitor EDLC-S3 and the liquid supercapacitor EDLC-CS0 at a charging/discharging current density of 1 A g−1. | ||
4. Conclusion
We successfully developed a novel PAEK/PAEK-g-PEG microporous electrolyte S3, which was formed using carboxylated chitosan with a concentration of 2%. The novel MPE demonstrated several advantages, such as high electrolyte absorption capacity, high thermal stability, and excellent ionic conductivity (2 × 10⁻² S cm−1 at room temperature). Symmetric solid-state EDLC that combines microporous electrolyte S3 with activated carbon electrodes exhibited high electrochemical performance conductivity. The high specific capacitance of solid-state EDLC-S3 reached 134.38 F g−1 with a potential window of 0–1.5 V and exhibited low internal resistance, improved cycling performance, and low self-discharge behavior. Thus, our study provides a promising and new direction for developing solid-state electrolytes in the field of solid-state electronics devices.Conflicts of interest
This authors declare no conflict of interest.Acknowledgements
The authors acknowledge the support from the National Key Research and Development Program (No. 2018YFB1107500), LiaoNing Revitalization Talents Program (No. XLYC1907144), the National Natural Science Foundation of China (No. 51503024), Dalian Youth Science and Technology Star Project Support Program (No. 2017RQ104).References
- J. S. M. Lee, M. E. Briggs, C. C. Hu and A. I. Cooper, Nano Energy, 2018, 46, 277–289 CrossRef CAS.
- J. Li, Y. Wang, W. Xu, Y. Wang, B. Zhang, S. Luo, X. Zhou, C. Zhang, X. Gu and C. Hu, Nano Energy, 2019, 57, 379–387 CrossRef CAS.
- Q. Meng, K. Cai, Y. Chen and L. Chen, Nano Energy, 2017, 36, 268–285 CrossRef CAS.
- N. L. W. Septiani, Y. V. Kaneti, K. B. Fathoni, J. Wang, Y. Ide, B. Yuliarto, Nugraha, H. K. Dipojono, A. K. Nanjundan, D. Golberg, Y. Bando and Y. Yamauchi, Nano Energy, 2020, 67, 104270 CrossRef.
- S. W. Zhang, B.-S. Yin, X. X. Liu, D. M. Gu, H. Gong and Z.-B. Wang, Nano Energy, 2019, 59, 41–49 CrossRef CAS.
- Y. Zhang, J. He, Z. Gao and X. Li, Nano Energy, 2019, 65, 41–49 CrossRef.
- L. L. Zhang and X. S. Zhao, Chem. Soc. Rev., 2009, 38, 2520–2531 RSC.
- Z. Yu, L. Tetard, L. Zhai and J. Thomas, Energy Environ. Sci., 2015, 8, 702–730 RSC.
- Y. Gao, Y. S. Zhou, M. Qian, X. N. He, J. Redepenning, P. Goodman, H. M. Li, L. Jiang and Y. F. Lu, Carbon, 2013, 51, 52–58 CrossRef CAS.
- F. Wang, X. Wu, X. Yuan, Z. Liu, Y. Zhang, L. Fu, Y. Zhu, Q. Zhou, Y. Wu and W. Huang, Chem. Soc. Rev., 2017, 46, 6816–6854 RSC.
- A. Borenstein, O. Hanna, R. Attias, S. Luski, T. Brousse and D. Aurbach, J. Mater. Chem. A, 2017, 5, 12653–12672 RSC.
- R. Na, G. Huo, S. Zhang, P. Huo, Y. Du, J. Luan, K. Zhu and G. Wang, J. Mater. Chem. A, 2016, 4, 18116–18127 RSC.
- X. Zhang, X. Wang, L. Jiang, H. Wu, C. Wu and J. Su, J. Power Sources, 2012, 216, 290–296 CrossRef CAS.
- C. M. Yang, Y. J. Kim, M. Endo, H. Kanoh, M. Yudasaka, S. Iijima and K. Kaneko, J. Am. Chem. Soc., 2007, 129, 20–21 CrossRef CAS PubMed.
- C. Wu, X. Wang, B. Ju, L. Jiang, H. Wu, Q. Zhao and L. Yi, J. Power Sources, 2013, 227, 1–7 CrossRef CAS.
- C. Meng, C. Liu, L. Chen, C. Hu and S. Fan, Nano Lett., 2010, 10, 4025–4031 CrossRef CAS PubMed.
- H. Liao, H. Hong, H. Zhang and Z. Li, J. Membr. Sci., 2016, 498, 147–157 CrossRef CAS.
- D. Kalpana, N. G. Renganathan and S. Pitchumani, J. Power Sources, 2006, 157, 621–623 CrossRef CAS.
- R. Na, Y. Liu, N. Lu, S. Zhang, F. Liu and G. Wang, Chem. Eng. J., 2019, 374, 738–747 CrossRef CAS.
- Y. Liu, T. Xiao, C. Bao, Y. Fu and X. Yang, J. Membr. Sci., 2018, 563, 298–308 CrossRef CAS.
- T. Xiao, P. Wang, X. Yang, X. Cai and J. Lu, J. Membr. Sci., 2015, 489, 160–174 CrossRef CAS.
- H. J. Zhu, W. Zhai, M. Yang, X.-m. Liu, Y. C. Chen, H. Yang and X. d. Shen, RSC Adv., 2014, 4, 25625–25632 RSC.
- W. Zhai, H. j. Zhu, L. Wang, X. m. Liu and H. Yang, Electrochim. Acta, 2014, 133, 623–630 CrossRef CAS.
- X. Zhang, L. Wang, J. Peng, P. Cao, X. Cai, J. Li and M. Zhai, Adv. Mater. Interfaces, 2015, 2, 1500267 CrossRef.
- J. Y. Song, Y. Y. Wang and C. C. Wan, J. Power Sources, 1999, 77, 183–197 CrossRef CAS.
- F. Croce, F. Gerace, G. Dautzemberg, S. Passerini, G. B. Appetecchi and B. Scrosati, Electrochim. Acta, 1994, 39, 2187–2194 CrossRef CAS.
- Y. Y. Lee and Y.-L. Liu, Electrochim. Acta, 2017, 258, 1329–1335 CrossRef CAS.
- K. Tsunemi, H. Ohno and E. Tsuchida, Electrochim. Acta, 1983, 28, 833–837 CrossRef CAS.
- T. P. Lodge, Science, 2008, 321, 50–51 CrossRef CAS PubMed.
- V. K. Thakur, G. Ding, J. Ma, P. S. Lee and X. Lu, Adv. Mater., 2012, 24, 4071–4096 CrossRef CAS PubMed.
- C. Y. Tsai, K. J. Peng, C.-F. Wang and Y. L. Liu, ACS Sustainable Chem. Eng., 2020, 8, 2138–2146 CrossRef CAS.
- I. Shin, J. Nam, K. Lee, E. Kim and T. H. Kim, Polym. J., 2018, 9, 42 Search PubMed.
- T. Dong, J. Hu, M. Ueda, Y. Wu, X. Zhang and L. Wang, J. Mater. Chem. A, 2016, 4, 2321–2331 RSC.
- T. Hamada, S. Hasegawa, H. Fukasawa, S. i. Sawada, H. Koshikawa, A. Miyashita and Y. Maekawa, J. Mater. Chem. A, 2015, 3, 20983–20991 RSC.
- K. Miyatake, Y. Chikashige, E. Higuchi and M. Watanabe, J. Am. Chem. Soc., 2007, 129, 3879–3887 CrossRef CAS PubMed.
- K. Yuan, C. Liu, J. Han, G. Yu, J. Wang, H. Duan, Z. Wang and X. Jian, RSC Adv., 2016, 6, 12009–12020 RSC.
- K. Yuan, C. Liu, L. Zong, G. Yu, S. Cheng, J. Wang, Z. Weng and X. Jian, ACS Appl. Mater. Interfaces, 2017, 9, 13201–13212 CrossRef CAS PubMed.
- L. Zong, C. Liu, Y. Guo, J. Wang and X. Jian, RSC Adv., 2015, 5, 77027–77036 RSC.
- L. Zong, C. Liu, R. Liu, J. Wang and X. Jian, Polym. Bull., 2014, 71, 2641–2660 CrossRef CAS.
- C. W. Huang, C.-A. Wu, S.-S. Hou, P. L. Kuo, C. T. Hsieh and H. Teng, Adv. Funct. Mater., 2012, 22, 4677–4685 CrossRef CAS.
- K. Prabakaran, S. Mohanty and S. K. Nayak, RSC Adv., 2015, 5, 40491–40504 RSC.
- Q. Sun, J. Wang, L. He, Y. Song and X. Jian, J. Appl. Polym. Sci., 2007, 104, 1744–1753 CrossRef CAS.
- Y. Du, K. Zhu, Y. Fang, S. Zhang, X. Zhang, Y. Lu, Y. Yang, Y. Song and G. Wang, RSC Adv., 2015, 5, 48311–48322 RSC.
- X. Wang, C. Gong, D. He, Z. Xue, C. Chen, Y. Liao and X. Xie, J. Membr. Sci., 2014, 454, 298–304 CrossRef CAS.
- R. Na, C. W. Su, Y. H. Su, Y. C. Chen, Y. M. Chen, G. Wang and H. Teng, J. Mater. Chem. A, 2017, 5, 19703–19713 RSC.
- F. Hu, T. Zhang, J. Wang, S. Li, C. Liu, C. Song, W. Shao, S. Liu and X. Jian, Nano Energy, 2020, 74, 104789 CrossRef CAS.
- M. M. Perez-Madrigal, F. Estrany, E. Armelin, D. Diaz Diaz and C. Aleman, J. Mater. Chem. A, 2016, 4, 1792–1805 RSC.
- B. Cheng, B. Pei, Z. Wang and Q. Hu, RSC Adv., 2017, 7, 42036–42046 RSC.
- C. Y. Tsai, K. J. Peng, C. F. Wang and Y. L. Liu, ACS Sustainable Chem. Eng., 2020, 8, 2138–2146 CrossRef CAS.
- W. Wang, S. Guan, M. Li, J. Zheng and C. Xu, Org. Electron., 2018, 56, 268–275 CrossRef CAS.
- Y. Sun, W. Zhang, D. Li, L. Gao, C. Hou, Y. Zhang and Y. Liu, Electrochim. Acta, 2015, 178, 823–828 CrossRef CAS.
- G. Guo, Y. Sun, Q. Fu, Y. Ma, Y. Zhou, Z. Xiong and Y. Liu, Int. J. Hydrogen Energy, 2019, 44, 6103–6115 CrossRef CAS.
- M. M. Perez-Madrigal, F. Estrany, E. Armelin, D. Diaz Diaz and C. Aleman, J. Mater. Chem. A, 2016, 4, 1792–1805 RSC.
- H. Huang, X. Zeng, W. Li, H. Wang, Q. Wang and Y. Yang, J. Mater. Chem. A, 2014, 2, 16516–16522 RSC.
- Y. E. Miao, W. Fan, D. Chen and T. Liu, ACS Appl. Mater. Interfaces, 2013, 5, 4423–4428 CrossRef CAS PubMed.
- Z. Wang, Z. Xu, H. Huang, X. Chu, Y. Xie, D. Xiong, C. Yan, H. Zhao, H. Zhang and W. Yang, ACS Nano, 2020, 14, 4916–4924 CrossRef CAS PubMed.
- Z. Wang, X. Chu, Z. Xu, H. Su, C. Yan, F. Liu, B. Gu, H. Huang, D. Xiong, H. Zhang, W. Deng, H. Zhang and W. Yang, J. Mater. Chem. A, 2019, 7, 8633–8640 RSC.
Footnote |
| † Electronic supplementary information (ESI) available. See DOI: 10.1039/d1ra01047f |
| This journal is © The Royal Society of Chemistry 2021 |

