 Open Access Article
Room temperature DMMP gas sensing based on cobalt phthalocyanine derivative/graphene quantum dot hybrid materials†
Wenkai Jianga,
Menglin Jiangb,
Tao Wanga,
Xinwei Chena,
Min Zenga,
Jianhua Yanga,
Zhihua Zhoua,
Nantao Hu a,
Yanjie Su
 a and
Zhi Yang
 *a
*a
aKey Laboratory of Thin Film and Microfabrication (Ministry of Education), Department of Micro/Nano Electronics, School of Electronic Information and Electrical Engineering, Shanghai Jiao Tong University, Shanghai 200240, P. R. China. E-mail: zhiyang@sjtu.edu.cn
bChinesisch-Deutsche Fakultät, Taizhou Vocational and Technical College, Taizhou 318000, P. R. China
First published on 21st April 2021
Abstract
In this study, two kinds of cobalt phthalocyanine (CoPc) derivatives containing hexafluoroisopropanol (HFIP) and hexafluorbisphenol A (6FBPA) substituents have been obtained. Graphene quantum dots (GQDs) were anchored to CoPc derivatives by π–π bonding, forming hybrid materials. They were employed to detect dimethyl methylphosphonate (DMMP) gas, an ideal simulant gas for sarin nerve gas, and achieved good gas response performance at room temperature. There are strong hydrogen bonds between the two functional group molecules (HFIP and 6FBPA) and the DMMP molecule, leading to their excellent response performance to DMMP molecules. GQDs can effectively increase the electrical conductivity of hybrid materials by π–π bonding with CoPc derivatives. Therefore, the response speed of the hybrid materials to DMMP gas has been significantly improved, and the minimum detection limit is 500 ppb, while maintaining excellent repeatability, stability and selectivity. Laser-assisted irradiation was used to solve the problem of the slow recovery of CoPc derivatives. This result demonstrates that these CoPc derivative/GQD hybrid materials are expected to be the raw materials of the sarin gas sensor.
Introduction
Chemical warfare agents (CWAs) are synthetic chemicals, which are extremely destructive to the human body, often dispersed in the environment as gases, liquids, or aerosols or adsorbed on microscopic particles.1 There are some kinds of CWAs that have been used in wars and terrorist attacks.2–4 Sarin gas is one of the most deadly and well-known CWAs, having been used in an attack on the Tokyo subway in 1995 that killed 13 people and poisoned thousands of people. Therefore, timely detection of CAWs such as sarin is a very important issue in the public safety and military fields.5Due to the strong toxicity, scientists cannot directly use sarin as a chemical detection object in the gas sensor experimental test. Dimethyl methylphosphonate (DMMP) is an ideal simulant gas for sarin in the experiments owing to its nontoxicity, the similarity in molecular structure (molecular formula of DMMP is C4H10FO2P, and sarin is C3H9O3P) and functional groups (P![[double bond, length as m-dash]](https://www.rsc.org/images/entities/char_e001.gif) O, P–CH3 and P–OCH3).3,4 Several types of materials have been reported for DMMP detection, including carbon nanomaterials, polymers, metal oxides, and their complexes.6–12 However, there are always some issues that have not been completely solved such as low response, high operation temperature, and long recovery time.13,14
O, P–CH3 and P–OCH3).3,4 Several types of materials have been reported for DMMP detection, including carbon nanomaterials, polymers, metal oxides, and their complexes.6–12 However, there are always some issues that have not been completely solved such as low response, high operation temperature, and long recovery time.13,14
Metal phthalocyanine (MPc) is a kind of organic semiconductor material with excellent performance due to its unique macrocyclic conjugated structure, so it can be used as sensitive material to prepare organic gas sensors.15–18 Compared with traditional metal oxide semiconductor sensors and solid electrolyte sensors, MPc gas sensors have the advantages of abundant raw materials, low cost, simple membrane making process, easy compatibility with other technologies, and working at room temperature.19 More importantly, MPc molecules are structurally tunable and can be controlled to regulate functional groups, thus providing the possibility for MPc molecules to have high detection sensitivity and good selectivity for specific gas molecules at room temperature.20,21 However, they were not widely used because of their long response and recovery time. The main ideas to solve these problems is to replace the surrounding functional groups or combine with some materials with excellent conductivity.22–24
For the detection of DMMP, functional groups that can form strong hydrogen-bonding interaction with DMMP are necessary, and such functional groups should be able to replace the original functional groups of MPc. Hexafluoroisopropanol (HFIP) and hexafluorbisphenol A (6FBPA) have a strong selective response to DMMP.25,26 They can combine with MPc to form new MPc derivatives.
In order to improve the conductivity of MPc, the hybridizations of carbon nanomaterials and MPc have previously been reported.22–27 The rapid transfer of electrons between carbon nanomaterials and MPc enables the composites to have excellent gas-sensitive properties to gas molecules.28–30 Nevertheless, due to the defects of large size and easy stacking for the above carbon materials, the modified MPc-based gas sensors have not been used in practice.24,25 Graphene quantum dots (GQDs) not only inherit the ultra-high conductivity of graphene, but also have nanometer-size comparable to MPc.31 GQDs can be anchored onto the surface of MPc through π–π bonding, and form new nanofiber hybrid materials with both response properties and response speed.32–35 In this work, CoPc derivative/GQD hybrid materials will be prepared for the detection of DMMP. The application of this hybrid material as a DMMP detection sensor has not been reported as far as we know. This work will provide valuable ideas and methods for CWAs detection.
Experimental section
Sensor fabrication
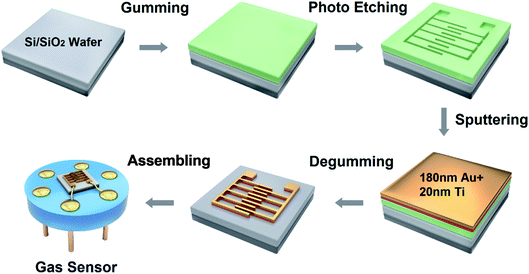
A lift-off processing technology was used to obtain the interdigitated electrodes for sensor signal acquisition, as shown in Fig. 1, which was an improvement based on our previous work.36 The electrodes were made by sputtering 180 nm Au and 20 nm Ti on a Si/SiO2 wafer which was patterned using a photoresist mold. The wafer was immersed in acetone overnight to degum the redundant photoresist, and the interdigitated electrode finger with metal layer was retained by ultrasonic. The wafer was attached to the sensor base to form the gas sensor for the following experiment. The interdigitated electrode was connected to the electrode of the sensor base by an aluminum wire, which guided the signal of the materials out.Synthesis of CoPc–HFIP
For CoPc–HFIP synthesis, P-aminophenyl hexafluoroisopropanol (HFIP) needed to be synthesized first for subsequent condensation reactions.25 The synthetic path of HFIP is described as below, and is shown in Fig. S1.† 0.93 g (10 mmol) Aniline and 0.1 g p-toluenesulfonic acid were dissolved in xylene and heated to 100 °C under the protection of argon. 2.2 g (10 mmol) hexafluoroacetone solution was added. The reaction was carried out at 110 °C for 2 days in reflux and magnetic agitation. At the end of the reaction, the solids were cooled, filtered, and recrystallized, and the pink product HFIP was obtained.747.49 mg (1 mmol) CoPc–COOH, 258.16 mg (1 mmol) HFIP, and 210 mg (1 mmol) N,N′-dicyclohexylcarbodiimide (DCC) were added into N,N-dimethylformamide (DMF). The reaction was operated at 65 °C for 24 h with magnetic stirring and argon gas protection. The reaction solvent was removed by vacuum distillation. The solid powder was dispersed in tetrahydrofuran (THF) by ultrasound. Then, it was filtered and cleaned with ether. The solids were cooled, filtered, and recrystallized, and the pink product CoPc–HFIP was obtained. The product CoPc–HFIP was dried by vacuum. The outline of the synthesis of CoPc–HFIP is shown in Fig. S2.†
Synthesis of CoPc–6FBPA
2,9,16,23-Tetra acylchloride cobalt phthalocyanine (CoPc–COCl) as an intermediate for CoPc–6FBPA synthesis, should be preferentially prepared.26 The synthetic path of CoPc–COCl is described as below. 3 g CoPc–COOH was added to a 10 mL mixture of DMF and benzene, and 3 mL dichlorosulfoxide was added by drop. The reaction was carried out under refluxed and stirred for 12 h at 80 °C. The unreacted precursor was removed by vacuum distillation. Dichloromethane was added to the product before the ultrasonic treatment. The solution was filtered and the solids were washed. After that, the washed product was vacuum-dried and the amaranth CoPc–COCl was obtained.821.29 mg (1.0 mmol) CoPc–COCl, 258.16 mg (1.0 mmol) 6FBPA, and 1 mL pyridine were added into 30 mL DMF. The reaction was carried out at 65 °C for 24 h with magnetic stirring and argon gas protection. The reaction solvent was removed by vacuum distillation. The solid powder was dispersed in 20 mL THF by ultrasound. The solution was filtered and the solids were washed with diethyl ether. The washed product was vacuum-dried and the amaranth CoPc–6FBPA was obtained. The outline of the synthesis of CoPc–6FBPA is shown in Fig. S3.†
Synthesis of GQDs
GO sheets were prepared by the previously reported modified Hummers method.37 100 mg GO sheets and 100 μL hydrazine were added to 100 mL deionized (DI) water for ultrasonic agitation. GO was heated to 100 °C for 3 hours and reduced by hydrazine 50 mg reduced GO (rGO) sheets were reacted in concentrated 10 mL H2SO4 and 30 mL HNO3 in the ultrasonic treatment for 12 h.38,39 At the end of the reaction, the remaining acids were removed through dilution with DI water and filtration with a microporous membrane. The rGO sheets were re-dispersed in DI water, and the pH was tuned to 8. The rGO sheets were heated in a Teflon-lined autoclave at 200 °C for 10 h. In this reaction, GQDs were obtained by cutting rGO sheets. The GQDs contain rich oxide groups and were heated in a tube furnace at 500 °C for 6 h in a nitrogen atmosphere.Fabrication of CoPc–GQD hybrid sensing devices
CoPc derivatives (CoPc–HFIP and CoPc–6FBPA) were soluble in DMF, and GQDs were soluble in DI water. The concentration of the above solutions was 1 mg mL−1. The CoPc–HFIP solution or CoPc–6FBPA solution was slowly dropped into GQD solution in different volume proportions (19![[thin space (1/6-em)]](https://www.rsc.org/images/entities/char_2009.gif) :
:![[thin space (1/6-em)]](https://www.rsc.org/images/entities/char_2009.gif) 1, 9
1, 9![[thin space (1/6-em)]](https://www.rsc.org/images/entities/char_2009.gif) :
:![[thin space (1/6-em)]](https://www.rsc.org/images/entities/char_2009.gif) 1, 4
1, 4![[thin space (1/6-em)]](https://www.rsc.org/images/entities/char_2009.gif) :
:![[thin space (1/6-em)]](https://www.rsc.org/images/entities/char_2009.gif) 1, 1
1, 1![[thin space (1/6-em)]](https://www.rsc.org/images/entities/char_2009.gif) :
:![[thin space (1/6-em)]](https://www.rsc.org/images/entities/char_2009.gif) 1, 1
1, 1![[thin space (1/6-em)]](https://www.rsc.org/images/entities/char_2009.gif) :
:![[thin space (1/6-em)]](https://www.rsc.org/images/entities/char_2009.gif) 4, 1
4, 1![[thin space (1/6-em)]](https://www.rsc.org/images/entities/char_2009.gif) :
:![[thin space (1/6-em)]](https://www.rsc.org/images/entities/char_2009.gif) 9). The devices based on CoPc–HFIP/GQD hybrid materials with a 9
9). The devices based on CoPc–HFIP/GQD hybrid materials with a 9![[thin space (1/6-em)]](https://www.rsc.org/images/entities/char_2009.gif) :
:![[thin space (1/6-em)]](https://www.rsc.org/images/entities/char_2009.gif) 1 ratio are denoted as CoPc–HFIP–GQD. Besides, we denoted the devices based on CoPc–6FBPA/GQD hybrid materials with a 9
1 ratio are denoted as CoPc–HFIP–GQD. Besides, we denoted the devices based on CoPc–6FBPA/GQD hybrid materials with a 9![[thin space (1/6-em)]](https://www.rsc.org/images/entities/char_2009.gif) :
:![[thin space (1/6-em)]](https://www.rsc.org/images/entities/char_2009.gif) 1 ratio as CoPc–6FBPA–GQD. This is because the hybrid materials combined with a 9
1 ratio as CoPc–6FBPA–GQD. This is because the hybrid materials combined with a 9![[thin space (1/6-em)]](https://www.rsc.org/images/entities/char_2009.gif) :
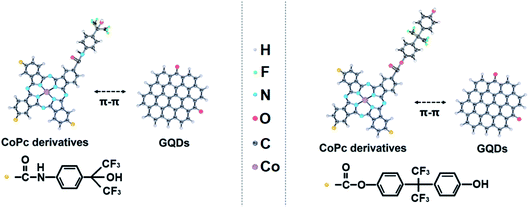
:![[thin space (1/6-em)]](https://www.rsc.org/images/entities/char_2009.gif) 1 ratio have the best gas sensitivity, which will be further explained in the “Results and discussion” section. The above synthetic pathway of hybrid materials was shown in Fig. 2.
1 ratio have the best gas sensitivity, which will be further explained in the “Results and discussion” section. The above synthetic pathway of hybrid materials was shown in Fig. 2.
Gas sensing measurement
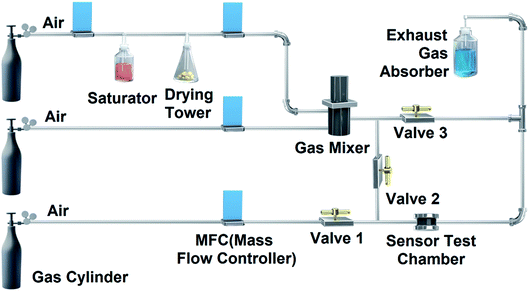
The gas sensing measurements were carried out by a homemade gas detection system, modified from previous report,40 as illustrated in Fig. 3. The saturated DMMP vapors were generated by bubbling dry compressed air through a saturator containing DMMP solvent. Next, the DMMP vapors passed through a drying tower to remove the water vapor. Different concentrations of DMMP vapors were controlled by dry compressed air and the DMMP vapors, mixed in a gas mixer. DMMP vapors with a certain concentration were continuously introduced into the test chamber for gas sensing measurement (valves 2 open, valves 1 and 3 closed). The recovery of electrical performances of the gas sensor in the test chamber relied on the dry compressed air (valves 2 closed, valves 1 and 3 open). Other organic vapors were tested in the same manner as above. The tested gas and redundant gas entered the exhaust gas absorber to avoid air pollution.The response values (R) of the gas sensor upon exposure to DMMP vapor or other organic vapors were defined as R (%) = (Rg − Ra/Ra) × 100%, where Ra was the resistance of the devices in air, and Rg was the resistance of the devices in the target gas.
Characterization
The morphologies of the products were characterized using an Ultra Plus Field Emission Scanning Electron Microscope (FE-SEM, Carl Zeiss, Germany) and transmission electron microscopy (TEM, JEM-2100, JEOL, Japan). Fourier transform infrared spectroscopy (FTIR) spectra were obtained at a resolution of 1 cm−1 and a spectral range of 4000–400 cm−1 (VERTEC 70 instrument, Bruker, Germany). The ultraviolet-visible (UV-Vis) absorption spectra were recorded by a UV-Vis-NIR spectrophotometer (Lambda 950, PerkinElmer, USA). Material surface elements and their chemical state were characterized by an X-ray photoelectron spectrometer (XPS) with a 1486.6 eV Al Kα light source (UltraDLD, Kratos Axis, UK). Raman spectroscopy represented the vibrational properties of samples were obtained by Raman microspectrometer with a 514 nm laser source (InVia, Renishaw, UK).Results and discussion
Structure and morphology
The material composition and chemical structure of GQDs are characterized as shown in Fig. S4.† The UV-Vis absorption spectrum of GQDs is shown in Fig. S4a.† An absorption peak below 300 nm is observed, which is assigned to the π–π* transition of aromatic sp2 domains.41 The high graphitization is shown in the Raman spectrum (Fig. S4b†). D band at 1372 cm−1 is stronger than G band at 1582 cm−1 with an intensity ratio of 1.2527.42 Fig. S4c† shows the FT-IR spectrum of GQDs. A strong vibration at 1590 cm−1 is ascribed to the C![[double bond, length as m-dash]](https://www.rsc.org/images/entities/char_e001.gif) C bonds. A rather broad vibration at 3400 cm−1 is attributed to the O–H bonds, mainly due to the attachment of water molecules to the material.43 The vibration band of epoxy groups at 1052 cm−1 and the vibrational absorption band of C–O/COOH at 1720 cm−1 are almost invisible, indicating that there are very few oxygen-containing functional groups around GQDs.44 The survey XPS spectrum (Fig. S4d†) shows strong signals of C 1s at 284.8 eV and weak O 1s at 531.4 eV.45 The characterizations above indicate that GQDs are effectively synthesized and contain few other functional groups.
C bonds. A rather broad vibration at 3400 cm−1 is attributed to the O–H bonds, mainly due to the attachment of water molecules to the material.43 The vibration band of epoxy groups at 1052 cm−1 and the vibrational absorption band of C–O/COOH at 1720 cm−1 are almost invisible, indicating that there are very few oxygen-containing functional groups around GQDs.44 The survey XPS spectrum (Fig. S4d†) shows strong signals of C 1s at 284.8 eV and weak O 1s at 531.4 eV.45 The characterizations above indicate that GQDs are effectively synthesized and contain few other functional groups.
The UV-Vis absorption spectra and the FT-IR spectra of CoPc–HFIP, CoPc–HFIP–GQD, CoPc–6FBPA and CoPc–6FBPA–GQD are shown in Fig. 4. Either CoPc–HFIP in Fig. 4a or CoPc–6FBPA in Fig. 4b, there are two characteristic absorption peaks in the spectra corresponding to two main absorption bands (Q band located at 600–700 nm and B band located at 300–400 nm) of CoPc.46 In the curves of CoPc–HFIP–GQD and CoPc–6FBPA–GQD, Q band and B band were significantly weakened or disappeared. Because of the interaction between CoPc derivatives and GQDs, ΔE (energy level difference between the HOMO and LUMO) are reduced, resulting in the absorption wavelength redshift.47,48 The FTIR spectra of the materials are given in Fig. 4c and d. The broad band around 3405 cm−1 is ascribed to the O–H stretching vibration of the carboxyl group (–COOH) at the edge of GQDs and adsorbed water molecules. The cobalt metal vibration absorption peak appears near 950 cm−1. The characteristic absorption peaks at 3419 cm−1, 1520 cm−1 and 1451 cm−1 are amide bonds. The characteristic peak of C–F are located at 1320 cm−1. Because GQDs bring more C![[double bond, length as m-dash]](https://www.rsc.org/images/entities/char_e001.gif) C bonds and C–OH groups, the band at 1590 cm−1 and 3405 cm−1 are stronger in the curves of CoPc–HFIP–GQD and CoPc–6FBPA–GQD compared to CoPc–HFIP and CoPc–6FBPA.
C bonds and C–OH groups, the band at 1590 cm−1 and 3405 cm−1 are stronger in the curves of CoPc–HFIP–GQD and CoPc–6FBPA–GQD compared to CoPc–HFIP and CoPc–6FBPA.
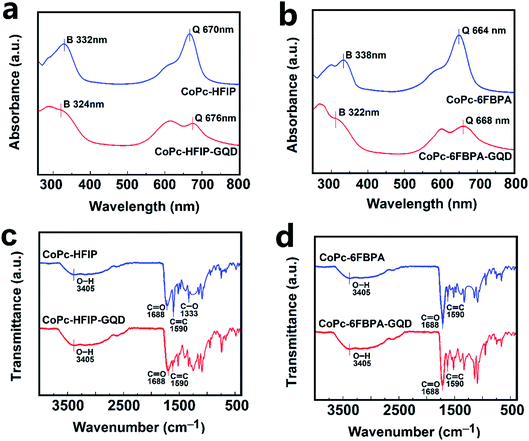 | ||
| Fig. 4 UV-Vis absorption spectra of (a) CoPc–HFIP/CoPc–HFIP–GQD and (b) CoPc–6FBPA/CoPc–6FBPA–GQD. FTIR spectra of (c) CoPc–HFIP/CoPc–HFIP–GQD and (d) CoPc–6FBPA/CoPc–6FBPA–GQD. | ||
As can be seen from Fig. 5a, the GO has an ultrathin structure. The size of GO sheet varies from 500 nm to 5 μm. TEM image of GQDs is shown in Fig. 5b. Each quantum dot consists of dozens to hundreds of hexagonal cells. The size of GODs is between 1–3 nm, and the atomic spacing is 0.143 nm consistent with the theoretical value. As shown in Fig. S5,† the morphology of CoPc–HFIP and CoPc–6FBPA are fibrous consist of smaller particles. The morphology of CoPc–HFIP–GQD (Fig. 5c) and CoPc–6FBPA–GQD (Fig. 5d) change very little. This may be due to the small proportion of GQDs in the hybrid material, and the small effect of GQDs on the morphology of phthalocyanine.
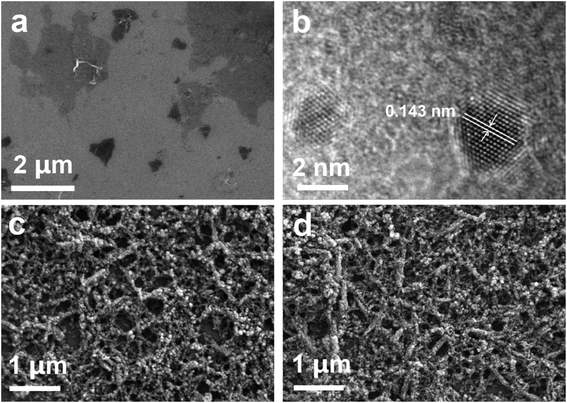 | ||
| Fig. 5 (a) SEM images of GO sheets. (b) TEM images of GQDs. SEM images of (c) CoPc–HFIP–GQD and (d) CoPc–6FBPA–GQD. | ||
Evaluation of gas sensing devices
Fig. S6† shows the comparison of response curves of hybrid materials of cobalt phthalocyanine derivatives (CoPc–HFIP and CoPc–6FBPA) mixed with GQDs in different proportions to 20 ppm DMMP gas at room temperature. It can be seen from Fig. S6a† that the CoPc–HFIP/GQD ratio of 9![[thin space (1/6-em)]](https://www.rsc.org/images/entities/char_2009.gif) :
:![[thin space (1/6-em)]](https://www.rsc.org/images/entities/char_2009.gif) 1 is optimal. Similarly, a 9
1 is optimal. Similarly, a 9![[thin space (1/6-em)]](https://www.rsc.org/images/entities/char_2009.gif) :
:![[thin space (1/6-em)]](https://www.rsc.org/images/entities/char_2009.gif) 1 ratio of CoPc–6FBPA to GQDs is also the best ratio, and the response value of the hybrid to DMMP can reach the maximum, as shown in Fig. S6b.† So, the 9
1 ratio of CoPc–6FBPA to GQDs is also the best ratio, and the response value of the hybrid to DMMP can reach the maximum, as shown in Fig. S6b.† So, the 9![[thin space (1/6-em)]](https://www.rsc.org/images/entities/char_2009.gif) :
:![[thin space (1/6-em)]](https://www.rsc.org/images/entities/char_2009.gif) 1 ratio hybrids are used as the follow-up study objects. Fig. S7† displays the response curve of GQDs towards 20 ppm DMMP gas. The response of GQDs to DMMP is very weak, reaching only 0.5% in 100 minutes. GQDs act mainly as electron conductors in the hybrids, rather than as reactants.
1 ratio hybrids are used as the follow-up study objects. Fig. S7† displays the response curve of GQDs towards 20 ppm DMMP gas. The response of GQDs to DMMP is very weak, reaching only 0.5% in 100 minutes. GQDs act mainly as electron conductors in the hybrids, rather than as reactants.
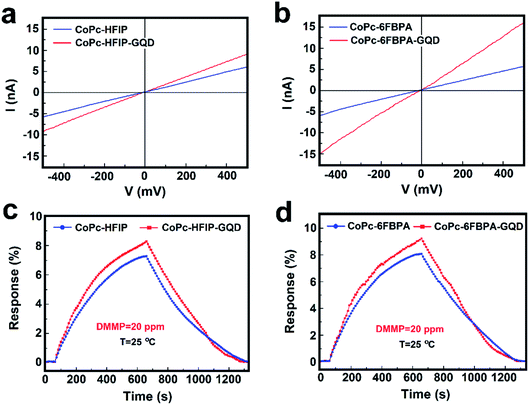
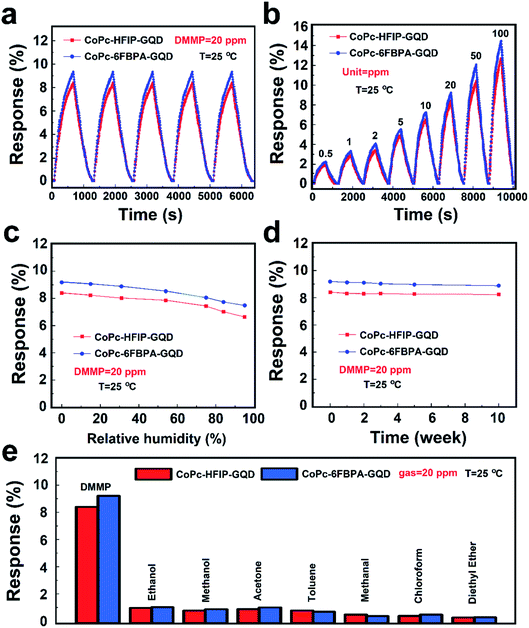
Fig. 6a and b exhibit the voltage–current tests of CoPc–HFIP/CoPc–HFIP–GQD and CoPc–6FBPA/CoPc–6FBPA–GQD sensors, respectively. At a voltage of 500 millivolts, the currents of the four samples (CoPc–HFIP, CoPc–HFIP–GQD, CoPc–6FBPA, and CoPc–6FBPA–GQD) are 5.5, 8.9, 5.8 and 15.1 nA respectively. The corresponding resistance values are 90.9, 56.2, 86.2 and 33.1 MΩ approximately. The curves of the primary resistance data of these samples are shown in Fig. S9.† The results fully demonstrate that GQDs can effectively improve the electrical conductivity of hybrid materials. Among them, the electrical conductivity and response value of CoPc–6FBPA–GQD to DMMP are the best. Fig. S8† shows the response and recovery curves of CoPc–6FBPA–GQD to 20 ppm DMMP gas at room temperature with different recovery methods. Since it takes a long time for the hybrid material to reach the saturation state (see Fig. S6†), a suitable response time of 600 s was chosen as the test time. When the test gas is stopped, the response value of the sensor naturally recovers very slowly. However, with 405 nm laser or IR lamp assisted recovery, the response values can be returned to the baseline relatively quickly. Although the effect of IR lamp is better, its power reaches 250 W, which is not desirable in practical applications. Its power consumption is too large and it is easy to cause damage to other components of gas monitoring equipment. The commercial blue-purple laser, with a wavelength of 405 ± 10 nm and a power of less than 50 mW, can speed up the material's recovery rate without causing unnecessary damage to the equipment. Therefore, the response of CoPc–HFIP/CoPc–HFIP–GQD and CoPc–6FBPA/CoPc–6FBPA–GQD sensors to 20 ppm DMMP gas are detected using laser-assisted recovery at room temperature, as shown in Fig. 6c and d. It can be seen from the figures that the addition of GQDs effectively improves the response performance of the hybrid materials, and the recovery ability is also improved with the assistance of a laser.
The gas sensitivities of the two phthalocyanine derivatives (CoPc–HFIP, and CoPc–6FBPA) combined with GQDs are compared, as shown in Fig. 7. Fig. 7a shows the reversibility for CoPc–HFIP–GQD and CoPc–6FBPA–GQD to 20 ppm DMMP gas over 5 cycles with laser-assisted recovery. Moreover, the response performance of CoPc–6FBPA–GQD is better than that of CoPc–HFIP–GQD in the same response time (600 s). The response of the sensing devices based on CoPc–HFIP–GQD and CoPc–6FBPA–GQD towards different concentrations of DMMP gas ranging from 0.5 to 100 ppm are also studied, as shown in Fig. 7b. The results show that the two devices have excellent response and recovery performance under laser irradiation to different DMMP concentrations. In addition, the detection limit reached 500 ppb, which is an excellent level for similar studies in the past. Fig. 7c shows the influence of humidity on gas sensing performance of CoPc–HFIP–GQD and CoPc–6FBPA–GQD. It can be seen from the response results that the humidity has a negligible effect on gas sensing performance for the two devices. At normal humidity levels (30–60% RH),49 the response values of each device change less than 10%. Fig. 7d exhibits the stability of CoPc–HFIP–GQD and CoPc–6FBPA–GQD, which have been measured at 1st, 2nd, 3rd, 5th and 10th week. Compared with the initial response values, the response values of the two devices after 10 weeks change very little, indicating that they have good long-term stability for practical application. The selectivities of CoPc–HFIP–GQD and CoPc–6FBPA–GQD towards 20 ppm DMMP gas compared to other 20 ppm analytes are shown in Fig. 7e. The response values of these two devices to these main organic volatile gases (ethanol, methanol, acetone and toluene, etc.) in life and production are not high (below 2%), which indicates that the materials are not susceptible to interference from other gases.
Table 1 lists the comparisons of CoPc–HFIP–GQD and CoPc–6FBPA–GQD with previously reported DMMP sensors. As can be seen from the table, sensors based on carbon materials can generally realize sensing at room temperature, with gas-sensitive response values of the same order of magnitude. Among them, CoPc–6FBPA–GQD synthesized in this study can achieve a relatively excellent performance. In terms of recovery, IR lamp illumination was usually used in past studies, while laser irradiation was used in this study, and both of them achieved good results. In contrast, the laser irradiation recovery mode has more advantages in energy saving and safety.
| Materials | T (°C) | Conc. (ppm) | R | τres/τrec (s) | Ref. |
|---|---|---|---|---|---|
| a T (°C): temperature. R: response value (Rg − Ra/Ra) × 100%, where Ra and Rg were the resistance of the devices in air and the target gas, respectively. τres: response time. τrec: recovery time. Ref.: references. RT: room temperature (25 °C).b IR lamp illumination.c Laser exposure. | |||||
| Porous graphene multilayer | RT | 50 | 8.95% | 240/180b | 6 |
| P-Phenylenediamine reduced graphene oxide | RT | 20 | 8.0% | 1080/360b | 7 |
| Single-walled carbon nanotube (SWNT) | RT | 10 | 2.15% | 900/300b | 10 |
| 6FBPA modified CNTs | RT | 20 | 5.1% | 960/720b | 26 |
| CoPc–HFIP–GQD | RT | 20 | 8.4% | 600/640c | This work |
| CoPc–6FBPA–GQD | RT | 20 | 9.3% | 600/620c | This work |
Gas sensing mechanisms
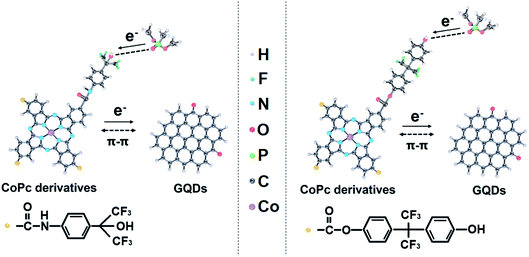
Phthalocyanine derivatives are p-type semiconductors, so the holes are their main carrier.37 When sensors are exposed to DMMP gas, the phthalocyanine derivatives are electron acceptors and DMMP gases are electron donors, this results in a decrease of the hole concentration in the p-type phthalocyanine derivatives. The response mechanisms of DMMP molecules on CoPc–HFIP and CoPc–6FBPA combining GQDs are shown in Fig. 8. There are strong hydrogen bonds between the two functional group molecules (HFIP and 6FBPA) and DMMP molecule, so the two phthalocyanine derivatives show excellent response performance to DMMP molecule.50 According to the data in Fig. 6 and 7, the response performance of CoPc–6FBPA–GQD is slightly better than that of CoPc–HFIP–GQD. The reason lies in the difference of hydrogen bond energy (HBE) in hydrogen bond complex systems. The HBE of 6FBPA–DMMP (7.8 kcal mol−1) is higher than that of HFIP–DMMP (7.7 kcal mol−1), which has been calculated by density functional theory (DFT) in the related studies.25,26 The responses of phthalocyanine derivatives combined with GQDs are improving, as shown in Fig. 6c and d, because GQDs provide good electron channels. GQDs can be anchored onto the surface of phthalocyanine derivatives through π–π bonding.51,52 Because the GQDs inherit the excellent electrical conductivity of graphene, electrons can quickly migrate from the phthalocyanine derivatives to GQDs, thus achieving the output of electrical signals.Conclusions
In summary, we have prepared two cobalt phthalocyanine derivatives containing HFIP and 6FBPA substituents, respectively, which were then combined with GQDs through π–π bonding. The new hybrid materials show good gas response performance at room temperature. The reproducibility, stability and selectivity of the hybrid materials are excellent, and the minimum response concentration to DMMP can reach 500 ppb. The reasons for such performance are mainly from two aspects: the first is the strong hydrogen bond between the two functional group molecules (HFIP and 6FBPA) and DMMP molecule, the second is the introduction of GQDs greatly increases the conductivity of phthalocyanine derivatives. Besides, laser irradiation has been used to facilitate recovery with good results.Conflicts of interest
There are no conflicts to declare.Acknowledgements
The authors gratefully acknowledge financial supports by the National Natural Science Foundation of China (61971284), the Oceanic Interdisciplinary Program of Shanghai Jiao Tong University (SL2020ZD203 and SL2020MS031) and Scientific Research Fund of Second Institute of Oceanography, Ministry of Natural Resources of P. R. China (SL2003), and Startup Fund for Youngman Research at SJTU. We also acknowledge analysis support from the Instrumental Analysis Center of Shanghai Jiao Tong University and the Center for Advanced Electronic Materials and Devices of Shanghai Jiao Tong University.References
- B. Li, X. Chen, C. Su, Y. Han, H. Wang, M. Zeng, Y. Wang, T. Liang, Z. Yang and L. Xu, Analyst, 2020, 145, 8059–8067 RSC.
- M. Lafuente, I. Pellejero, V. Sebastián, M. A. Urbiztondo, R. Mallada, M. P. Pina and J. Santamaria, Sens. Actuators, B, 2018, 267, 457–466 CrossRef CAS.
- K. T. Alali, J. Liu, R. Chen, Q. Liu and J. Wang, Chem.–Eur. J., 2019, 25, 11892–11902 CrossRef PubMed.
- L. Szinicz, Toxicology, 2005, 214, 167–181 CrossRef CAS PubMed.
- N. Yanagisawa, H. Morita and T. Nakajima, J. Neurol. Sci., 2006, 249, 76–85 CrossRef CAS PubMed.
- Y. Wang, M. Yang, W. Liu, L. Dong, D. Chen and C. Peng, J. Mater. Chem. C, 2019, 7, 9248–9256 RSC.
- N. Hu, Y. Wang, J. Chai, R. Gao, Z. Yang, S. W. Kong and Y. Zhang, Sens. Actuators, B, 2012, 163, 107–114 CrossRef CAS.
- T. Alizadeh and L. H. Soltani, Sens. Actuators, B, 2016, 234, 361–370 CrossRef CAS.
- Y. T. Kim, S. Lee, S. Park and C. Y. Lee, RSC Adv., 2019, 9, 33976–33980 RSC.
- Y. Wang, Z. Zhou, Z. Yang, X. Chen, D. Xu and Y. Zhang, Nanotechnology, 2009, 20, 345502–345510 CrossRef PubMed.
- S. C. Lee, H. Y. Choi, S. J. Lee, W. S. Lee, J. S. Huh, D. D. Lee and J. C. Kim, Sens. Actuators, B, 2009, 137, 239–245 CrossRef.
- D. Kumar, P. Jha, A. Chouksey, J. S. B. S. Rawat, R. P. Tandon and P. K. Chaudhury, Mater. Chem. Phys., 2016, 181, 487–494 CrossRef CAS.
- R. Yoo, S. Yoo, D. Lee, J. Kim, S. Cho and W. Lee, Sens. Actuators, B, 2017, 240, 1099–1105 CrossRef CAS.
- S. Ramesh, Y. J. Lee, S. Msolli, J. G. Kim, H. S. Kim and J. H. Kim, RSC Adv., 2017, 7, 50912–50919 RSC.
- T. Ikeuchi, H. Nomoto, N. Masaki, M. J. Griffith, S. Mori and M. Kimura, Chem. Commun., 2014, 50, 1941–1943 RSC.
- A. A. Esenpınar, M. Durmuş and M. Bulut, J. Photochem. Photobiol., A, 2010, 213, 171–179 CrossRef.
- F. I. Bohrer, C. N. Colesniuc, J. Park, M. E. Ruidiaz, I. K. Schuller, A. C. Kummel and W. C. Trogler, J. Am. Chem. Soc., 2009, 131, 478–485 CrossRef CAS PubMed.
- X. Zhang, Z. Wu, X. Zhang, L. Li, Y. Li, H. Xu, X. Li, X. Yu, Z. Zhang, Y. Liang and H. Wang, Nat. Commun., 2017, 8, 14675–14682 CrossRef PubMed.
- Y. L. Lee and C. H. Chang, Sens. Actuators, B, 2006, 119, 174–179 CrossRef CAS.
- N. Kılınç, S. Öztürk, D. Atilla, A. G. Gürek, V. Ahsen and Z. Z. Öztürk, Sens. Actuators, B, 2012, 173, 203–210 CrossRef.
- J. Shi, L. Luan, W. Fang, T. Zhao, W. Liu and D. Cui, Sens. Actuators, B, 2014, 204, 218–223 CrossRef CAS.
- G. Bottari, O. Trukhina, M. Ince and T. Torres, Coord. Chem. Rev., 2012, 256, 2453–2477 CrossRef CAS.
- X. Zhou, X. Wang, B. Wang, Z. Chen, C. He and Y. Wu, Sens. Actuators, B, 2014, 193, 340–348 CrossRef CAS.
- X. Liang, Z. Chen, H. Wu, L. Guo, C. He, B. Wang and Y. Wu, Carbon, 2014, 80, 268–278 CrossRef CAS.
- Y. Wang, N. Hu, Z. Zhou, D. Xu, Z. Wang, Z. Yang, H. Wei, E. S. Kong and Y. Zhang, J. Mater. Chem., 2011, 21, 3779–3787 RSC.
- Y. Wang, Z. Wang, N. Hu, L. Wei, D. Xu, H. Wei, E. S. Kong and Y. Zhang, J. Nanosci. Nanotechnol., 2011, 11, 4874–4881 CrossRef CAS PubMed.
- W. Jiang, T. Wang, X. Chen, B. Li, M. Zeng, N. Hu, Y. Su, Z. Zhou, Y. Zhang and Z. Yang, Phys. Chem. Chem. Phys., 2020, 22, 18499–18506 RSC.
- J. Shen, Y. Zhu, X. Yang and C. Li, Chem. Commun., 2012, 48, 3686–3699 RSC.
- Y. Li, Y. Zhao, H. Cheng, Y. Hu, G. Shi, L. Dai and L. Qu, J. Am. Chem. Soc., 2012, 134, 15–18 CrossRef CAS PubMed.
- W. Liu, X. Yan, J. Chen, Y. Feng and Q. Xue, Nanoscale, 2013, 5, 6053–6062 RSC.
- M. Xie, Y. Su, X. Lu, Y. Zhang, Z. Yang and Y. Zhang, Mater. Lett., 2013, 93, 161–164 CrossRef CAS.
- W. Yuan and G. Shi, J. Mater. Chem. A, 2013, 1, 10078–10091 RSC.
- T. S. Sreeprasad, A. A. Rodriguez, J. Colston, A. Graham, E. Shishkin, V. Pallem and V. Berry, Nano Lett., 2013, 13, 1757–1763 CrossRef CAS PubMed.
- L. Tang, R. Ji, X. Li, G. Bai, C. P. Liu, J. Hao, J. Lin, H. Jiang, K. S. Teng, Z. Yang and S. P. Lau, ACS Nano, 2014, 8, 6312–6320 CrossRef CAS PubMed.
- X. Li, M. Rui, J. Song, Z. Shen and H. Zeng, Adv. Funct. Mater., 2015, 25, 4929–4947 CrossRef CAS.
- J. Hu, C. Zou, Y. Su, M. Li, N. Hu, H. Ni, Z. Yang and Y. Zhang, J. Mater. Chem. C, 2017, 5, 6862–6871 RSC.
- D. Huang, Z. Yang, X. Li, L. Zhang, J. Hu, Y. Su, N. Hu, G. Yin, D. He and Y. Zhang, Nanoscale, 2017, 9, 109–118 RSC.
- D. Pan, J. Zhang, Z. Li and M. Wu, Adv. Mater., 2010, 22, 734–738 CrossRef CAS PubMed.
- W. Jiang, X. Chen, T. Wang, B. Li, M. Zeng, J. Yang, N. Hu, Y. Su, Z. Zhou and Z. Yang, RSC Adv., 2021, 11, 5618–5628 RSC.
- D. Huang, X. Li, S. Wang, G. He, W. Jiang, J. Hu, Y. Wang, N. Hu, Y. Zhang and Z. Yang, Sens. Actuators, B, 2017, 252, 956–964 CrossRef CAS.
- T. Alizadeh and M. Shokri, Sens. Actuators, B, 2016, 222, 728–734 CrossRef CAS.
- G. He, D. Huang, Z. Yang, Y. Han, J. Hu, N. Hu, Y. Su, Z. Zhou, Y. Zhang and Y. Zhang, Phys. Chem. Chem. Phys., 2018, 20, 4083–4091 RSC.
- T. Wang, D. Huang, Z. Yang, S. Xu, G. He, X. Li, N. Hu, G. Yin, D. He and L. Zhang, Nano-Micro Lett., 2016, 8, 95–119 CrossRef PubMed.
- X. Huang, N. Hu, R. Gao, Y. Yu, Y. Wang, Z. Yang, E. S. Kong, H. Wei and Y. Zhang, J. Mater. Chem., 2012, 22, 22488–22495 RSC.
- J. Li, Y. Lu, Q. Ye, M. Cinke, J. Han and M. Meyyappan, Nano Lett., 2003, 3, 929–933 CrossRef CAS.
- Z. Yang, H. Pu and J. Yuan, Chem. Phys. Lett., 2008, 465, 73–77 CrossRef CAS.
- T. Mugadza and T. Nyokong, Electrochim. Acta, 2010, 55, 6049–6057 CrossRef CAS.
- X. Wang, Y. Liu and W. Qiu, J. Mater. Chem., 2002, 12, 1636–1639 RSC.
- S. Wang, D. Huang, S. Xu, W. Jiang, T. Wang, J. Hu, N. Hu, Y. Su, Y. Zhang and Z. Yang, Phys. Chem. Chem. Phys., 2017, 19, 19043–19049 RSC.
- L. Kong, J. Wang, T. Luo, F. Meng, X. Chen, M. Li and J. Liu, Analyst, 2010, 135, 368–374 RSC.
- L. Cao, H. Chen and H. Zhou, Adv. Mater., 2003, 15, 909–913 CrossRef CAS.
- L. Wibmer, A. Leandro, M. O. Lourenço, A. Roth, G. Katsukis, M. G. P. M. S. Neves, J. A. S. Cavaleiro, J. P. C. Tomé, T. Torres and D. M. Guldi, Nanoscale, 2015, 7, 5674–5682 RSC.
Footnote |
| † Electronic supplementary information (ESI) available. See DOI: 10.1039/d1ra01975a |
| This journal is © The Royal Society of Chemistry 2021 |

