 Open Access Article
A selective and sensitive near-infrared fluorescent probe for real-time detection of Cu(I)†
Yiqing Liu‡
 a,
Ting Kang‡b,
Qian He‡c,
Yuefu Hua,
Zeping Zuob,
Zhihua Caob,
Bowen Ke
 b,
Weiyi Zhang*b and
Qingrong Qi*a
aKey Laboratory of Drug-Targeting and Drug Delivery System of the Education Ministry, Sichuan Engineering Laboratory for Plant-Sourced Drug, SichuanResearch Center for Drug Precision Industrial Technology, West China School of Pharmacy Sichuan University, Chengdu, 610041, P. R. China. E-mail: qiqinrong@scu.edu.cn
bDepartment of Anaesthesiology, West China Hospital, Sichuan University, China. E-mail: Zhangweyi@xchscu.cn
cDepartment of Emergency, West China Hospital, Sichuan University, Chengdu 610000, Sichuan, China
First published on 21st April 2021
Abstract
The disruption of copper homeostasis (Cu+/Cu2+) may cause neurodegenerative disorders. Thus, the need for understanding the role of Cu+ in physiological and pathological processes prompted the development of improved methods of Cu+ analysis. Herein, a new near-infrared (NIR) fluorescent turn-on probe (NPCu) for the detection of Cu+ was developed based on a Cu+-mediated benzylic ether bond cleavage mechanism. The probe showed high selectivity and sensitivity toward Cu+, and was successfully applied for bioimaging of Cu+ in living cells.
Introduction
As an essential trace transition metal element, found in both the oxidized Cu2+ and reduced Cu+ states in living organisms, copper is considered a vital redox-active cofactor for various cytosolic, mitochondrial and vesicular oxygen-processing enzymes, including cytochrome-c-oxidase,1,2 copper/zinc superoxide dismutase3 and metallothionein.4 The disproportionation of Cu+ in cells could produce reactive oxygen species (ROS), leading to oxidative damage of proteins, nucleic acids and lipids.5–7 There is a growing body of evidence to suggest that the imbalance of Cu+ may cause neurodegenerative disorders, such as prion, Parkinson's, Alzheimer's, Menkes, and Wilson's diseases and amyotrophic lateral sclerosis.8–11 In addition, copper was also demonstrated to play a critical role in other diseases including urinary tract infection12 and infertility.13 It is of significance, therefore, to establish an effective and reliable strategy to monitor Cu+ in complex environmental settings and biological systems. The involvement of Cu+ in physiological and pathological processes promoted the development of methods in Cu+ analysis. There are existing techniques such as electrochemistry,14–17 chromatography,18–21 pulse polarography,22 voltammetry23 and atomic absorption spectrophotometry (AAS),24,25 but these generally require sophisticated procedures and expensive instrumentation. More importantly, these methods cannot provide the real-time visualization of labile Cu+ in situ. Optical imaging techniques are non-invasive, highly sensitive, easily handled, and suitable for detecting analytes in biological system. In the past decade, a number of fluorescent probes have been designed for copper detection.26–30 Among this collection, NIR fluorescent probes stand out due to their unique properties of high penetration through tissues,31–34 low auto-fluorescence and less photodamage.35,36 T. Govindarajua et al. reported on the development of a NIR fluorescent probe with a tripicolylamine (N4) functionality for the detection of intracellular Cu+.37 B. R. Cho et al. and W. Wan et al. developed probes with the recognition group being bis(2-((2-(ethylthio)ethyl)-thio)ethyl)amine (BETA) containing electron rich S atoms.38,39 Although these probes offer a promising strategy for intravital non-invasive quantitative imaging, they cannot completely discriminate Cu+ from other interfering cations, such as Cu2+, Co2+ or Hg2+. Developing a highly selective tool to detect Cu+, especially to visualize dynamic process of Cu+ in living system, is a challenging endeavour.Herein, we developed a new near-infrared (NIR) fluorescent turn-on probe (NPCu) for the detection of Cu+, based on the mechanism of a Cu(I)-mediated benzylic ether bond cleavage. Our results demonstrate that the NPCu probe can effectively distinguish Cu+ from most interfering cations in vitro and in vivo.
Experimental
Materials and instruments
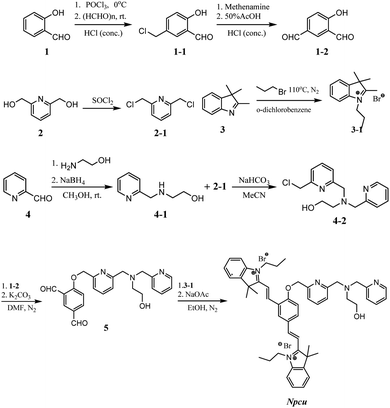
All reagents were purchased from commercial suppliers and used without further purification (Adamas-beta® or Lab Network), unless otherwise noted. All chemicals and solvents were used without purification unless otherwise noted. Column chromatography was carried out on silica gel (200–300 mesh) using an eluent of ethyl acetate and cyclohexane, dichloromethane/methanol, or ethyl acetate/methanol. TLC analyses were conducted on silica gel plates and visualized using UV (ZF-2 UV254). Mass spectrometry analyses were performed on an API 4000 (ESI-HRMS). NMR spectra were recorded at 1H (400 MHz or 600 MHz) and 13C (100 MHz) on a Bruker instrument. Chemical shifts (δ values) and coupling constants (J values) are given in ppm and hertz respectively. Melting points were determined on a Mel-Temp apparatus and were not corrected. UV/vis spectra were recorded on a UV-1800 (240V) spectrophotometer and fluorescence spectra were recorded on a FL3C-iHR320 spectrofluorometer (HORIBA Instrument Inc.) Absorption and emission were measured using a 1 cm path length quartz cells. Fluorescence imaging was carried out with Nikon Ti-E laser scanning microscope that excitation at 560 nm under a 40× objective.Water used for this study was purified with a Milli-Q filtration system (Scheme 1).Synthesis of the NPCu probe
To a mixture of compound 5 (297.5 mg, 0.7 mmol) and 3-1 (517.7 mg, 1.8 mmol) in 4 mL of anhydrous ethanol was added sodium acetate (119.6 mg, 1.46 mmol) in 2 mL of ethanol under a nitrogen atmosphere. The reaction mixture was refluxed at 80 °C for 1 h under N2 protection. When completed, the solvent was removed under reduced pressure and the residue was purified by silica gel column chromatography (MeOH/DCM from 0 to 10%) to yield a deep yellow solid, NPCu (150.0 mg, 21.9% yield). 1H NMR (600 MHz, DMSO-d6) δ: 9.41 (s, 1H), 8.62 (dd, J = 16.4, 8.5 Hz, 2H), 8.59–8.54 (m, 1H), 8.46 (d, J = 5.2 Hz, 1H), 8.15 (d, J = 16.4 Hz, 1H), 8.04–7.97 (m, 2H), 7.93 (dd, J = 9.2, 5.6 Hz, 3H), 7.90–7.86 (m, 1H), 7.78–7.72 (m, 1H), 7.70–7.62 (m, 5H), 7.62 (d, J = 8.8 Hz, 1H), 7.56 (d, J = 7.6 Hz, 2H), 7.23 (t, J = 5.6 Hz, 1H), 5.55 (s, 2H), 4.83 (t, J = 7.2 Hz, 2H), 4.75 (t, J = 7.2 Hz, 2H), 4.58 (s, 1H), 3.87 (s, 2H), 3.81 (s, 2H), 3.54 (d, J = 6.0 Hz, 2H), 2.61 (t, J = 6.4 Hz, 2H), 1.95–1.82 (m, 10H), 1.75 (s, 6H), 1.05 (t, J = 7.2 Hz, 3H), 0.97 (t, J = 7.2 Hz, 3H).13C NMR (100 MHz, DMSO-d6) δ: 182.51, 182.36, 162.29, 160.47, 159.96, 154.79, 153.02, 149.17, 147.45, 144.40, 144.22, 141.29, 141.27, 138.12, 137.84, 136.99, 134.02, 130.24, 129.93, 129.75, 129.62, 128.51, 124.09, 123.61, 123.58, 123.06, 122.68, 122.58, 121.18, 116.17, 115.87, 115.08, 114.99, 112.56, 72.39, 63.25, 60.64, 59.59, 56.62, 52.77, 52.75, 48.80, 48.34, 26.56, 26.37, 22.41, 22.36, 11.26, 11.23. HRMS (ESI) m/z: calcd for [C51H59N5O]2+ [M]2+: 386.7335; found 386.6984.Measurement of absorption and fluorescence
For UV/vis and fluorescence titrations stock solution of NPCu probe were prepared (c = 10 mM) in 25 mM PBS buffer (pH = 7.2). The solutions of cations were freshly prepared in PBS buffer solution. Working solutions of the probe and metal ions were prepared from the stock solutions. Excitation and emission spectra were carried out at 560 nm and 710 nm for NPCu with 4 nm slit widths. All buffers for pH titration were prepared in deionized water and adjusted to a suitable pH with HCl or NaOH aqueous solutions.Selectivity of probes to Cu(I)
Each metal cation was diluted with PBS buffer solution to a 1 mM working solution for use, and mixed with 2 mL of NPCu solution (100 μM) in equal volume; in experiment 2, each metal cation was mixed with Cu(I), and each was configured. A mixed solution of 1 mM ion concentration was mixed with 2 mL of NPCu solution (50 μM) in equal volume. The samples from both experiments were incubated for 1 hour in a dark shaker under a 37 °C constant temperature shaker to determine the fluorescence intensity of each ion solution at an excitation wavelength of 560 nm and an emission wavelength of 710 nm. The molar absorption coefficients of probe NPCu without Cu+ was calculated as ε = 1.76 × 10⁴ M−1 cm−1 while with Cu+ was 0.76 × 10⁴ M−1 cm−1. NPCu after Cu+ treatment exhibited a high quantum yield (Φ = 0.39). The quantum yields of NPCu was 0.024 in aqueous medium when excited at the λmax (560 nm, ε = 0.76 × 10⁴ M−1 cm−1).Cell cytotoxicity and imaging
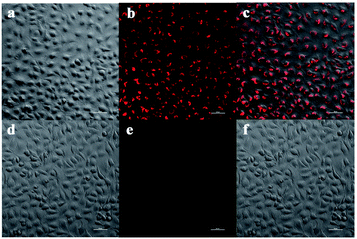
Human alveolar epithelial A549 cells were grown in RPMI-1640 medium, containing 10% fetal bovine serum (FBS) and 1% penicillin-streptomycin, at 37 °C in a humidified incubator with an atmosphere of 5% CO2/95% air. One day before the experiment, a 6-well culture plate was inoculated with logarithmic growth phase cells. The cells in the experimental group were incubated with Cu+ (50 μM) for 6 h. In the control group, only medium was added. After that, cells were incubated with NPCu (10 μm) at 37 °C for 1 h. Finally, an inverted microscope was used to observe the cells with DIC and Cy-3 fluorescence filters.Results and discussion
Sensitivity research
We first evaluated its spectral properties and determined its responsiveness towards Cu(I). As shown in Fig. 1, the absorbance, extraction and emission spectra of NPCu peaked at 415 nm, 430 nm, and 560 nm respectively in 25 mM PBS (pH 7.2) containing 2 mM glutathione (GSH). The addition of Cu+ (10 eq.) induced significant signal changes in the optical properties of NPCu solutions. As shown in Fig. 1A, a marked redshift (∼150 nm) was noted in absorption. Meanwhile, in the emission spectra, a turn-on response from 560 nm to 710 nm was noted upon introduction of Cu+ to the probe. After the incubation with Cu+, large Stokes shifts (>150 nm) both in the excitation and emission spectra were observed (Fig. 1B and C). This is considered a highly desirable feature as it increases the signal-to-noise ratio.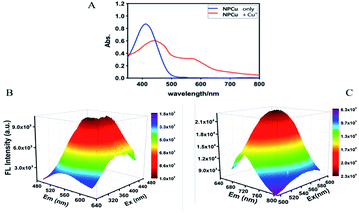 | ||
| Fig. 1 UV-vis absorption spectra (A) and 3D fluorescence spectra (B and C) of NPCu (50 μM) incubated without or with Cu+ (500 μM) in 25 mM PBS buffer (pH 7.2) containing 2 mM GSH. | ||
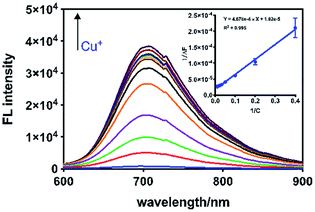
To investigate whether NPCu had the sensitivity to measure small fluctuations in Cu+ level in aqueous solutions, the probe (50 μM) was exposed to a range of Cu+ concentrations. The fluorescence intensity at 710 nm was plotted and exhibited good linear correlation (R2 = 0.995) with Cu(I) levels from 0 to 1000 μM. A typical calibration curve is shown in Fig. 2 (inset). The detection limit for Cu+ was 9.1 × 10⁻⁵ M (S/N = 3). It was shown that the fluorescence intensity of the probe progressively increased with increasing cocentration of Cu+.
Fluorescence intensity changes of NPCu with time
To 2 mL of NPCu solution (50 μM) was added the same volume of Cu+ (10 eq.) in 25 mM PBS buffer (pH 7.2) containing 2 mM GSH and incubated at 37 °C for different lengths of time. The fluorescence intensity was measured at 1, 5, 10, 15, 20, 25, 30, 40, 50, 60, 90, 120, 180, and 240 min (Fig. 1). The correlation between NPCu responsiveness and different concentrations of Cu+ was determined in 25 mM PBS (pH 7.2) containing 2 mM GSH. To the EP tubes (1.5 mL), each containing 500 μL of Cu+ solution at various concentrations from 0 to 1 mM, was added the same volume of NPCu (250 μM) and incubated at 37 °C for 1 hour. It was found that the colour of the reaction mixture deepened with increasing Cu+ concentration (Fig. S1†) (Fig. 3).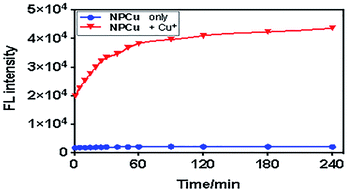 | ||
| Fig. 3 Change of fluorescent intensity: NPCu (50 μM) reacted with Cu+ (1000 μM) at various time points. λex/λem = 560/710 nm, 25 mM PBS (pH 7.2) containing 2 mM GSH. | ||
Selectivity research
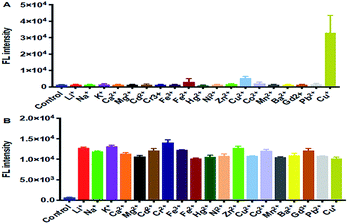
NPCu can be conveniently used as a ‘switch-on’ probe for the detection of Cu+ without interference from pH-related effects in physiological environments. As shown in Fig. 4, the specificity of NPCu ion detection was tested with various metal ions including Cu2+, Co2+, Hg2+, and Fe3+. NPCu exhibited a remarkable 30-fold enhancement in the NIR region (λex = 560 nm) upon addition of Cu+ (10 eq.) after 2 h, whereas the responses toward other ions were negligible. The NPCu exhibited high selectivity for Cu+ over other biologically relevant interfering metals, including redox-active copper and cobalt transition metals.Fluorimetric pH titration of NPCu
We further assessed the probe's capability of detecting Cu+ at different pH's.The pH was adjusted between 4.0 and 10.0 by adding 1 M HCl, and the fluorescence titration was performed in a quartz colorimetric dish with a path length of 1 cm (constant temperature set to 25 °C). The absorption spectra (Fig. S2†) were collected from 200–410 nm and the fluorescence intensity was measured at 710 nm with excitation at 560 nm. In the absence of Cu+, there was almost no change fluorescence intensity in the pH range of 4–10, which suggested this probe has considerable stability. Under neutral to mildly alkaline conditions, NPCu can maintain high responsiveness to Cu+.Sensing mechanisms
According to the structural characteristics of NPCu and literature reports,40,41 we speculate a new approach for the detection of Cu+ in live cells through the development of a NIR probe (NPCu), which is comprised of two discrete elements: a NIR core (Fig. 5, black), a Cu+ reactive moiety (Fig. 5, red). NPCu with a tetradentate ligand N3O moiety, which is first employed as a highly selective trigger for the detection of Cu+. Upon binding to Cu+, the benzylic ether bond (C–O) of NPCu was cleaved, and cyanine-quinone dye was released from NPCu, leading to a robust NIR fluorescence enhancement. This mechanism was confirmed by mass spectrometry (Fig. S4†).We also used orbital theory to better verify our hypothesis. LUMO and HOMO levels of NPCu in the absence or presence of Cu+ all have obvious delocalization effect on the entire molecular skeleton. As shown in Fig. 6, HOMO and LUMO energies of NPCu were calculated to be −3.55 eV and −1.91 eV while the energies of NPCu + Cu+ were −3.37 eV and −1.02 eV. The energy gaps (LUMO–HOMO) of NPCu and NPCu + Cu+ are 2.45 eV and 1.64 eV, respectively. It is worth noting that after reacting with Cu+, the UV absorption peak of NPCu was observed to have red-shifted. Theoretical predictions were consistent with the spectroscopy experimental data, indicating that the proposed reaction mechanisms were reasonable.
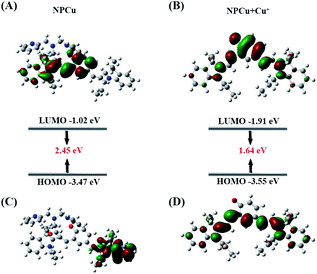 | ||
| Fig. 6 The HOMO and LUMO of NPCu and NPCu + Cu+. Red, blue, grey and white balls represent O, N, C, and H atoms, respectively. | ||
Cytotoxicity and cell imaging
The cytotoxicity of NPCu was evaluated using the methylthiazolyldiphenyltetrazolium (MTT) viability assay. As indicated in Fig. S4,† A549 cells incubated with NPCu showed little decrease in cell viability. Viability was >70% at 30 μM NPCu, which indicates that NPCu is suitable for bioimaging applications at 10 μM. Next, we tested the utility of this probe for detecting Cu+ in cultured A549 cells by confocal microscopy. The results clearly demonstrate that NPCu is permeable to membrane, and can react with intracellular Cu+ to release near infrared fluorescent Cy-quinone dye in living cells (Fig. 7).Conclusions
In summary, we have developed a new NIR fluorescent turn-on Cu+ probe based on the cyanine-quinone fluorophore and novel Cu+ receptor N3O-ol skeleton. The probe NPCu exhibited high sensitivity, good selectivity, and considerable stability at physiological pH. More importantly, NPCu showed excellent biocompatibility and high permeability for penetrating cell membrane and tracking intracellular Cu+. NPCu shows promising properties for non-invasive imaging of Cu+ in living cells and provides a useful tool to better understand the contribution of Cu+ in living systems.Conflicts of interest
There are no conflicts to declare.Acknowledgements
This work was supported by the National Natural Science Foundation of China (No. 81773685), the 1.3.5 Project for Disciplines of Excellence, West China Hospital, Sichuan University (No. ZYJC18032, and No. ZY2016101), Sichuan Science and Technology Program (No. 2019JDJQ0004), the Innovation spark project, Sichuan University (No. 2082604401004/056), the Fundamental Research Funds for the Central Universities, Sichuan university.References
- A. Boulet, K. E. Vest and M. K. Maynard, et al., J. Biol. Chem., 2018, 293, 1887–1896 CrossRef CAS PubMed.
- L. Cerqua, V. Morbidoni and M. A. Desbats, et al., Biochim. Biophys. Acta, Bioenerg., 2018, 1859, 244–252 CrossRef PubMed.
- E. S. Kim, C. S. Lim and H. J. Chun, et al., J. Clin. Pathol., 2012, 65, 882–887 CrossRef CAS PubMed.
- E. A. Ostrakhovitch, Y. P. Song and M. G. Cherian, J. Trace Elem. Med. Biol., 2016, 35, 18–29 CrossRef CAS PubMed.
- H. Kozlowski, A. Janicka-Klos and J. Brasun, et al., Coord. Chem. Rev., 2009, 253, 2665–2685 CrossRef CAS.
- M. L. Giuffrida, E. Rizzarelli and G. A. Tomaselli, et al., Chem. Commun., 2014, 50, 9835 RSC.
- L. Zhang, J. C. Er and H. Jiang, et al., Chem. Commun., 2016, 52, 9093–9096 RSC.
- A. Langley and C. T. Dameron, Anesthesiol. Res. Pract., 2013, 2013, 1–10 CrossRef PubMed.
- X. Wang, Q. Miao and T. Song, et al., The Analyst, 2014, 139, 3360–3364 RSC.
- B. Sullivan, G. Robison and J. Osborn, et al., Redox Biol., 2016, 11, 231–239 CrossRef PubMed.
- M. C. Heffern, H. M. Park and H. Y. Au-Yeung, et al., Proc. Natl. Acad. Sci. U. S. A., 2016, 113, 14219–14224 CrossRef CAS PubMed.
- A. N. Hyre, K. Kavanagh and N. D. Kock, et al., Infect. Immun., 2016, 8, e01041-16 Search PubMed.
- E. Tvrda, R. Peer and S. C. Sikka, et al., J. Assist. Reprod. Genet., 2015, 32, 3–16 CrossRef PubMed.
- B. K. Jena and C. R. Raj, Anal. Chem., 2008, 80, 4836 CrossRef CAS PubMed.
- M. Verma, A. F. Chaudhry and M. T. Morgan, et al., Org. Biomol. Chem., 2010, 8, 363–370 RSC.
- X. Shao, H. Gu and Z. Wang, et al., Anal. Chem., 2012, 85, 418–425 CrossRef PubMed.
- J.-H. Luo, D. Cheng and P.-X. Li, et al., Chem. Commun., 2018, 54, 2777–2780 RSC.
- T. Gunnlaugsson, J. P. Leonard and N. S. Murray, Org. Lett., 2004, 6, 1557 CrossRef CAS PubMed.
- R. Sheng, P. Wang and Y. Gao, et al., Org. Lett., 2008, 10, 5015 CrossRef CAS PubMed.
- G. C. Bandara, C. A. Heist and V. T. Remcho, Anal. Chem., 2018, 90, 2594–2600 CrossRef CAS PubMed.
- Y. Shi, R. Wang and W. Yuan, et al., ACS Appl. Mater. Interfaces, 2018, 10(24), 20377–20386 CrossRef CAS PubMed.
- S. Kocak, O. Tokusoglu and S. Aycan, J. Agric. Food Chem., 2005, 4, 871–878 Search PubMed.
- P. Salaün and V. D. B. Cm, Anal. Chem., 2006, 78, 5052 CrossRef PubMed.
- J. Chen and K. C. Teo, Anal. Chim. Acta, 2001, 450, 215–222 CrossRef CAS.
- G. Doner and A. Ege, Anal. Chim. Acta, 2005, 547, 14–17 CrossRef CAS.
- A. F. Chaudhry, M. Verma and M. T. Morgan, et al., J. Am. Chem. Soc., 2010, 132, 737–747 CrossRef CAS PubMed.
- A. F. Chaudhry, S. Mandal and K. I. Hardcastle, et al., Chem. Sci., 2011, 2, 1016–1024 RSC.
- M. T. Morgan, A. McCallum and C. J. Fahrni, Chem. Sci., 2016, 7, 1468–1473 RSC.
- S. Wang, C. Liu and G. Li, et al., ACS Sensors, 2017, 2, 364–370 CrossRef CAS PubMed.
- Y. Ma, Y. Cen and M. Sohail, et al., ACS Appl. Mater. Interfaces, 2017, 9(38), 33011–33019 CrossRef CAS PubMed.
- J. Tang, X. Yang and F. Zhao, et al., Sens. Actuators, B, 2021, 330, 129283 CrossRef CAS.
- X. Han, X. Yang and Y. Zhang, et al., Sens. Actuators, B, 2020, 321, 128510 CrossRef CAS.
- J. Tang, Q. Li and Z. Guo, et al., Org. Biomol. Chem., 2019, 17(7), 1875–1880 RSC.
- Z. Yang, X. Fan and X. Liu, et al., Chem. Commun., 2021, 57, 3099–3102 RSC.
- Y. Shiraishi, K. Tanaka and T. Hirai, ACS Appl. Mater. Interfaces, 2013, 5, 3456–3463 CrossRef CAS PubMed.
- C. Tang, Y. Du and Q. Liang, et al., Mol. Pharm., 2018, 15, 4702–4709 CrossRef CAS PubMed.
- D. Maity, A. Raj and D. Karthigeyan, et al., Supramol. Chem., 2015, 27, 589–594 CrossRef CAS.
- C. S. Lim, J. H. Han and C. W. Kim, et al., Chem. Commun., 2011, 47, 7146–7148 RSC.
- X. Cao, W. Lin and W. Wan, Chem. Commun., 2012, 48, 6247–6249 RSC.
- N. Karton-Lifshin, E. Segal and L. Omer, et al., J. Am. Chem. Soc., 2011, 133, 10960–10965 CrossRef CAS PubMed.
- D. Maity, V. Kumar and T. Govindaraju, Org. Lett., 2012, 14, 6008–6011 CrossRef CAS PubMed.
Footnotes |
| † Electronic supplementary information (ESI) available: Detailed synthesis, characterization (NMR, MS, etc.) of the probes. See DOI: 10.1039/d1ra00725d |
| ‡ These authors contributed equally. |
| This journal is © The Royal Society of Chemistry 2021 |

