 Open Access Article
Selective fluorescent sensing of LMOFs constructed from tri(4-pyridylphenyl)amine ligand†
Jian-Ling Ni,
Yu Liang,
Juan-Juan Shao,
Jun-Feng Li,
Ze-Yu Zhou,
Fang-Ming Wang * and
Li-Zhuang Chen
 *
*
School of Environmental and Chemical Engineering, Jiangsu University of Science and Technology, Zhenjiang, Jiangsu 212003, China. E-mail: wangfmzj@just.edu.cn; clz1977@sina.com
First published on 7th May 2021
Abstract
Three new luminescent metal–organic frameworks (LMOFs), [Zn(tppa)(ndc)]n (1), [Cd(tppa)(oba)]n (2), [Zn2(tppa)(bpdc)2]n (3) (tppa = tri(4-pyridylphenyl)amine, ndc = 1,4-naphthalenedicarboxylic acid, oba = 4,4′-oxydibenzoic acid, bpdc = 4,4′-biphenyldicarboxylic acid) have been synthesized by solvothermal method. Complexes 1 and 2 are 2-D two-fold interpenetrating structures, aligning into a 3-D structure through C–H⋯π stacking interactions, while 3 is a 5-fold interpenetrating three-dimensional structure. The internal quantum yields (IQYs) of complexes 1–3 are 32.7%, 45.7% and 24.0% (λex = 365 nm), separately. Furthermore, all the complexes show different luminescence signal changes towards aromatic volatile organic compounds (AVOCs). Complex 1 exhibits a high sensitivity in the detection of both Fe3+ and Cr3+ with large quenching coefficients of Ksv 2.57 × 10⁴ M−1 and 2.96 × 10⁴ M−1, respectively. All these results demonstrated potential applications in chemical sensing.
1. Introduction
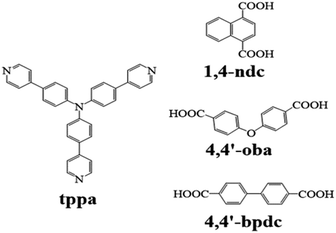
In the past few decades, water pollution has been considered as one of the highest life-threatening activities with numerous adverse effects.1–4 Among a range of water pollutants, nitro-organics, volatile organic compounds (VOCs), and ionic species from different chemicals are of major concern because of their high level of toxicity.5–7 Therefore, to ensure toxic free water sources, the development of novel sensor materials with convenient and efficient strategies for the identification of such toxic species even at their trace level is inevitable. In recent years, fluorescence sensors have attracted extensive research interest because of their high sensitivity, fast responsive speed and flexible operation.8,9 The perturbation of the adsorbed analyte can change the photoemission spectrum of luminescent MOFs (LMOFs), making them excellent candidates for chemical sensors.10 A tripod rigid multidentate ligand is prominent for constructing porous MOFs with an aesthetic topology structure,11 such as a 54-fold interpenetrating network,12 and interesting optical properties.13,14 To obtain a luminescent triangular ligand, we connected pyridine rings to triphenylamine to construct a tri(4-pyridylphenyl)amine (tppa) ligand. Numerous unique coordination polymers have been reported based on tppa.15,16 In our previous work, our approach was to use tppa as a luminescent chromophores organic linker with metal ions or clusters to construct LMOFs, and had obtained two yellow phosphors of MOFs with good luminescence properties.17Herein, we have prepared three new LMOFs under solvothermal conditions, namely [Zn(tppa)(ndc)]n (1, or JUST-9), [Cd(tppa)(oba)]n (2, or JUST-10), [Zn2(tppa)(bpdc)2]n (3, or JUST-11), based on the tppa and other auxiliary ligand (Chart 1). All the complexes 1–3 were characterized by using the X-ray powder diffraction experiment, thermogravimetric analysis, X-ray crystallography and elemental analysis. Importantly, the luminescent properties of 1–3 and the influence of various aromatic volatile organic compounds (AVOCs) were studied and discussed. In addition, we investigated the sensing properties of complex 1 for metal ions.
2. Experimental section
2.1 Materials and measurements
All reagents and solvents except for tppa ligand were commercially available. Tppa ligand was prepared by previous report.13 Elemental analyses were taken on a PerkinElmer 240C elemental analyzer. Thermogravimetric analyses (TGA) were recorded on a Netzsch TGA 209 F3 thermo gravimeter from room temperature to 800 °C. Powder X-ray diffraction (PXRD) patterns were performed with an Ultima IV with Cu Kα (1.5406 Å). Luminescent emission and excitation spectra were recorded on a Spectrofluorometer FS5 at room temperature. A Hamamatsu C9920-03 absolute quantum yield measurement system was used to collect Internal Quantum Yields (IQYs) at room temperature.2.2 Synthesis of [Zn(tppa)(ndc)]n (1)
A mixture of Zn(NO3)2·6H2O (0.02 mmol, 0.0059 g), tppa (0.02 mmol, 0.0095 g), ndc (0.02 mmol, 0.0043 g), DMA (2.0 mL), C2H5OH (1.0 mL), and H2O (1.0 mL) were added in a 20 mL glass vial and then heated to 85 °C for 72 h. Colorless bulk crystals were obtained, washed with DMA, and dried in air. Yield 51% (based on tppa ligand). Anal. calcd (%) for C44H29N4O4Zn: C, 71.12; H, 3.93; N, 7.54. As made: C, 70.69; H, 4.21; N, 6.98. Degassed: C, 71.23; H, 4.13; N, 7.35.2.3 Synthesis of [Cd(tppa)(oba)]n (2)
A mixture of Cd(NO3)2·4H2O (0.02 mmol, 0.0062 g), tppa (0.02 mmol, 0.0095 g), oba (0.02 mmol, 0.0054 g), DMF (2.0 mL) and H2O (1.0 mL) were added in a 20 mL glass vial and then heated to 85 °C for 72 h. Light green bulk crystals were obtained, washed with DMF, and dried in air. Yield 48% (based on tppa ligand). Anal. calcd (%) for C47H32N4O5Cd: C, 66.79; H, 3.82; N, 6.63. As made: C, 67.09; H, 3.61; N, 6.54. Degassed: C, 66.95; H, 3.71; N, 6.44.2.4 Synthesis of [Zn2(tppa)(bpdc)2]n (3)
A mixture of Zn(NO3)2·6H2O (0.02 mmol, 0.0059 g), tppa (0.02 mmol, 0.0095 g), bpdc (0.02 mmol, 0.0048 g), DMA (2.0 mL), MeCN (1.0 mL), and H2O (1.0 mL) were added in a 20 mL glass vial and then heated to 85 °C for 72 h. Light green bulk crystals were obtained, washed with DMA, and dried in air. Yield 46% (based on tppa ligand). Anal. calcd (%) for C61H40N4O8Zn2: C, 67.36; H, 3.71; N, 5.15. As made: C, 68.05; H, 3.75; N, 5.37. Degassed: C, 67.95; H, 3.61; N, 5.44.2.5 X-ray crystallography
The single crystal data of complex 1–3 were collected on a Bruker SMART APEX-II CCD diffractometer with a graphite-monochromatic Mo-Kα radiation (λ = 0.71073 Å) at room temperature. Absorption corrections were applied by using the multi-scan method. The structures were solved by direct methods and refined by full-matrix least-squares technique with SHELXS-2016 program. Disordered solvent molecules were processed by SQUEEZE with PLATON program. All hydrogen atoms were added theoretically, riding on the relational other atoms and refined with fixed thermal parameters. Detailed data collection and refinement of complexes 1–3 are listed in Table 1. CCDC numbers: 1856573–1856575.| Complexes | 1 | 2 | 3 |
| Empirical formula | C44H29N4O4Zn | C47H32N4O5Cd | C61H40N4O8Zn2 |
| Formula weight | 743.08 | 845.16 | 1087.71 |
| Temperature (K) | 143 K | 296 K | 296 K |
| Wavelength (Å) | 0.71073 | 0.71073 | 0.71073 |
| Crystal system | Monoclinic | Triclinic | Monoclinic |
| Space group | P2/c | P21/c | P21/c |
| a (Å) | 14.366(2) | 11.885(3) | 8.040(5) |
| b (Å) | 24.779(4) | 32.905(8) | 27.239(17) |
| c (Å) | 11.229(19) | 10.927(3) | 25.707(16) |
| α (°) | 90 | 90 | 90 |
| β (°) | 90.011(2) | 98.710(3) | 97.818(8) |
| γ (°) | 90 | 90 | 90 |
| Z | 4 | 4 | 4 |
| F(000) | 1532 | 1720 | 2232 |
| ρcalcd/g cm−3 | 1.235 | 1.329 | 1.295 |
| μ (mm−1) | 0.660 | 0.566 | 0.917 |
| θ range [°] | 0.822 to 24.999 | 2.665 to 24.711 | 1.696 to 27.455 |
| Collected reflections | 6961 | 7050 | 12![[thin space (1/6-em)]](https://www.rsc.org/images/entities/char_2009.gif) 649 649 |
| Unique reflections | 4453 | 5517 | 9851 |
| R1, wR2 [I > 2σ(I)] | 0.0949 to 0.2634 | 0.0878 to 0.2247 | 0.0677 to 0.1597 |
| R1, wR2 [all data] | 0.1413 to 0.3028 | 0.1099 to 0.2391 | 0.0910 to 0.1700 |
| GOF | 1.037 | 1.081 | 1.122 |
3. Results and discussion
3.1 The structure of 1
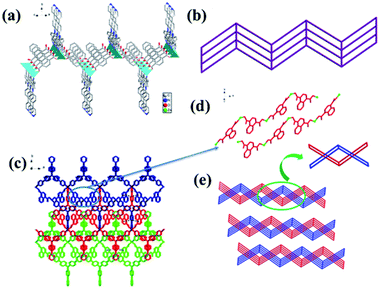
Complex 1 crystallizes in the monoclinic crystal system, space group P2/c. As shown in Fig. S1a,† Zn is in a distorted tetrahedral geometry coordination environment, four-coordinated by two N atoms from two tppa and two O atoms from two deprotonated ndc. Each Zn atom is connected to two ndc and each ndc is connected to two Zn atoms, building up a zigzag 1D chain (Fig. 1d). The 1D chain can be regarded as an infinite SBU (secondary building unit). Each tppa links to two adjacent 1D chains to form a 2-fold interpenetrating two-dimensional (2D) network (Fig. 1a and b). Furthermore, a 3D framework was formed through the C–H⋯π stacking interactions of the 2D layers (Fig. 1c), the distance of the H atom of phenyl ring from tppa to the center point of adjacent phenyl ring from the ndc is 2.8632(3) Å. Noticeably, there are uncoordinated pyridine groups in tppa ligands of complex 1. According to a calculation by PLATON, complex 1 shows a porosity of 15.1% (604.6 Å3 of 3997.2 Å3 unit cell volume). The Schläfli symbol for this uninodal net is {44·62}, and the topology type of this net is 4-c (Fig. 1e).3.2 The structure of 2
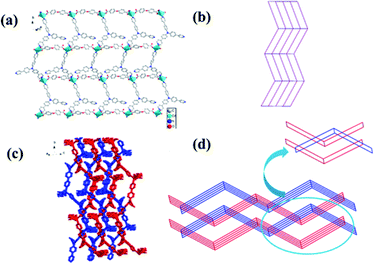
Complex 2 crystalizes in the monoclinic crystal system, space group P21/c. As depicted in Fig. S1b,† Cd is in a distorted pentahedral geometry coordination environment, five-coordinated by two N atoms from two tppa and three O atoms from two distinct deprotonated oba; thus, Cd atoms can play the role of 4-connecting nodes. The two carboxylate groups from deprotonated oba have two different coordination modes in 2: monodentate (O4) and chelate (O1, O2), compare with the carboxylate groups play the same role in 1. Oba ligand connected with adjacent Cd2+ to generate 1D chains, the 1D chains are further connected with tppa ligand to form a 2D simple sql (square layer) network (Fig. 2a and b). The dimensions of 18.9 × 14.8 Å can be observed from a large window in the sheet (Fig. 2a and b). The polycatenated network are easily generated from large square windows of the sheets. As shown in Fig. 2c, such 2D layers interpenetrate to produce the overall 3D framework by the C–H⋯π stacking interactions. According to a calculation by PLATON, complex 2 shows a porosity of 12.3% (519.4 Å3 of 4224.0 Å3 unit cell volume). The Schläfli symbol for this uninodal net is {44·62}, and the topology type of this net is 4-c (Fig. 2d).3.3 The structure of 3
Complex 3 crystalizes in the monoclinic crystal system, space group P21/c. As shown in Fig. S1c,† the framework is based on two different building units: a primary building unit (PBU) and a paddle-wheel-based secondary building unit (SBU). The PBU (Fig. 3c) is composed of a tetrahedrally coordinated Zn, linked to two nitrogen atoms (from two different tppa ligand) and two oxygen atoms (from two different bpdc ligand). Additionally, there are two distances of Zn to the uncoordinated oxygen atoms at 2.8 Å and 2.6 Å, which is too long when considered with normal Zn–O bond length. However, the normal bond length is about 2 Å.18,19 In SBUs (Fig. 3d), each of the two Zn atoms bonds to four oxygen atoms in double carboxylate bridges from four different bpdc ligands and two N atoms from two tppa ligands. In contrast to complex 1, there are no uncoordinated pyridine groups in tppa ligands. The two different units are connected by bpdc ligands to form 3D nets, and five identical nets interpenetrate to give rise to the overall 3D framework. Complex 3 has a 5-fold interpenetrating 3D framework (Fig. 3f), calculation of PLATON displays that porosity in complex 3 is 19.5% (1087.5 Å3 of 5577.0 Å3 unit cell volume). The Schläfli symbol for this 3-nodal net is {53}2{54·62}2{56·64·72·93}, and the new topology type of this net is (3-c)2(4-c)2(6-c) (Fig. 3f).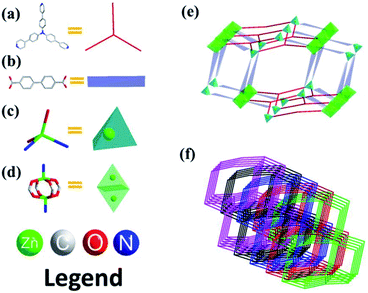 | ||
| Fig. 3 (a) Tppa; (b) 4,4′-bpdc; (c) primary building unit of 3; (d) secondary building unit of 3; (e) polyhedron drawing illustrating overall connectivity of 3; (f) topological nets of 3. | ||
3.4 Luminescent properties
Two of the phenomena that controls the luminescence of most transition metal based MOFs are, the linker centered emission and the metal–linker based mechanism as a results of charge transfer. Usually, emissions from paramagnetic transition metals are weak and this may be attributed to quenching through reabsorption because of ligand-field transitions (d–d) and electron or energy transfer through the partially filled d-orbitals. However, MOFs with transition-metal ions without unpaired electrons, especially those having d10 configurations, can yield linker-based highly emissive materials.20 Complex 1–3 are insoluble in common organic solvents, hence we investigated photoluminescence properties of 1–3 and free tppa in the solid state at room temperature (Fig. 4). Compared to the free tppa ligand (λem = 545 nm), emissions of complex 1–3 are blue-shifted for 53 nm (λem = 492 nm), 29 nm (λem = 516 nm), 39 nm (λem = 506 nm), which may presumably be ascribed to the ligand-to-metal charge-transfer (LMCT).21 In addition, the Commission International de I'Eclairage (CIE) coordinates of 1–3 are (0.25, 0.47), (0.25, 0.39) and (0.25, 0.49), which all located in blue-green region. The IQYs of complex 1–3 are 32.7%, 45.7% and 24.0% (λex = 365 nm). Emission energies, Internal Quantum Yields (IQYs) and CIE coordinates of complex 1–3 were summarized in Table 2.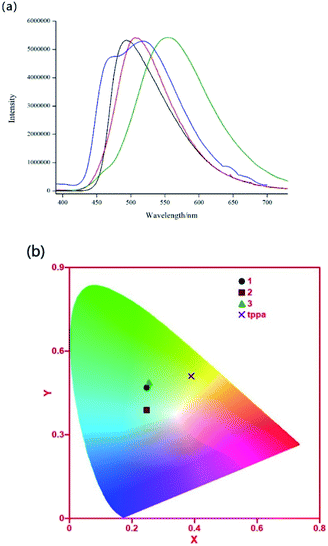 | ||
| Fig. 4 (a) Emission spectra of 1 (black), 2 (blue), 3 (red) and tppa (olive). (b) CIE coordinates of 1 (circle), 2 (square), 3 (triangle) and tppa (cross) (λex = 365 nm). | ||
| Compounds | λem (nm) | QYs (%) | CIE | |
|---|---|---|---|---|
| λex = 365 nm | λex = 365 nm | λex = 455 nm | λex = 365 nm | |
| 1 | 492 | 32.7 | 32.8 | (0.25, 0.47) |
| 2 | 471, 516 | 45.7 | 30.8 | (0.25, 0.39) |
| 3 | 506 | 24.0 | 40.5 | (0.25, 0.49) |
3.5 Solvent exchange
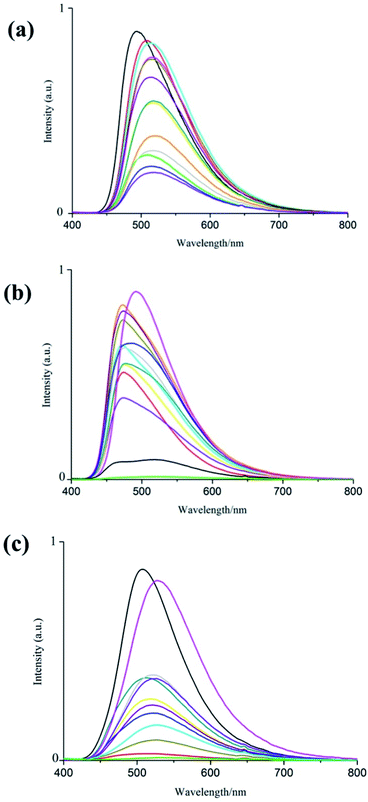
The PXRD and TGA data clearly suggested that complex 1–3 still features excellent stability, after removing all the solvent in the hole (Fig. S2–S7†). Solvent exchange of 1–3 was carried out at room temperature. By soaking degassed samples (soaking freshly as-made samples in methanol and evaporated in vacuum at 65 °C) in various AVOCs for 24 hours. Interestingly, the fluorescence responses of these three complexes to AVOCs are very different.We could observe different shifted emission wavelengths and varying intensities from photoluminescence emission spectra of the exchanged samples (Fig. 5). For complex 1, the synthesized sample has the strongest fluorescence, and other aromatic solvents reduced its fluorescence intensity. Among them, the chlorobenzene fluorescence quenching degree was the most obvious.
However, compared to the as-made sample of complex 2, most aromatic solvents except for nitrobenzene, its fluorescence intensity is enhanced, which may be attributed to nitro-group a typical electron deficient substituent that conjugates to stabilize the lowest unoccupied molecular orbital of aromatic analyte. The substituent-dependent effect of the aromatic complex indicates that nitrobenzene quenches the luminescence of complex 2 with a donor–receptor electron transfer mechanism.22,23 Related reports and mechanisms have been presented in many articles.24–27
In terms of complex 3, the selected solvents weakened its fluorescence intensity, the most obvious of which is nitrobenzene.
Additionally, there was an observable shift in the emission wavelength of the complexes. For instance, the emission wavelength difference between the synthesized sample and the chlorobenzene-exchanged sample is up to 28 nm, accompanied with a color change from green-blue to green-yellow (Table S1†). Distinctly, their selectivity for different aromatic volatile organic compounds indicates their potential for applying to AVOCs sensors.
3.6 Sensing of metal ions
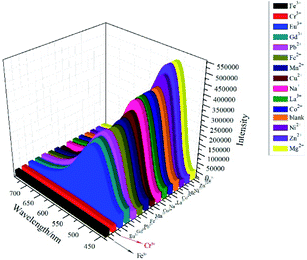
Considering that the tppa ligands in complex 1 possess uncoordinated pyridine groups, which can serve as potential ligands for metal ions, we investigated the sensing properties of complex 1 for metal ions. In this process, the suspensions of 1 (3 mg) dispersed in aqueous solutions (4 mL) individually containing 1.0 × 10⁻² M of M(NO3)x (M = Cr3+, Fe3+, Eu3+, Gd3+, Pb2+, Fe2+, Mn2+, Cu2+, Na+, La3+, Co2+, Ni2+, Zn2+, and Mg2+) for sensing studies. As illustrated in Fig. 6, different metal ions have markedly different effects on the luminescence properties of complex 1. Among them, Fe3+ is the most efficient quencher followed by Cr3+ ion.To further examine the fluorescent sensitivity of 1 toward Fe3+ and Cr3+ ions, different concentrations of Fe3+ were dropped into of complex 1. As shown in Fig. 7, the emission intensities declined gradually along with the increased concentrations of Fe3+. This quenching effect can be interpreted by Stern–Volmer equation: I0/I = Ksv[M] + 1,28 where I0 is the original fluorescence intensity and I is the fluorescence intensity upon addition of metal ions, Ksv is the Stern–Volmer quenching constant, and [M] is the molar concentration (mol L−1) of metal ions. As depicted in Fig. S9,† the SV plot for Fe3+ is nearly linear with a correlation coefficient of 0.999 and the slope of Ksv was calculated to be 2.57 × 10⁴ M−1, which is comparably better than that of the previously reported well-designed compounds.29–32 The result shows that complex 1 may act as a promising selective fluorescent sensor for Fe3+ ions.
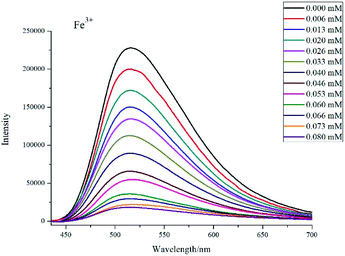 | ||
| Fig. 7 The luminescent spectra of 1 in water upon addition of Fe3+ ions in different concentrations. | ||
The similar experiment was carried out with Cr3+. As shown in Fig. 8, the fluorescence intensity gradually weakened with the increase of the Cr3+ concentration. Fig. S10† shows the Ksv value of Cr3+ is 2.96 × 10⁴ M−1 and the fit coefficient is 0.993, which is better than the reported values for some other compounds.33–36 Experimental result indicates that complex 1 shows high sensitivity for Cr3+.
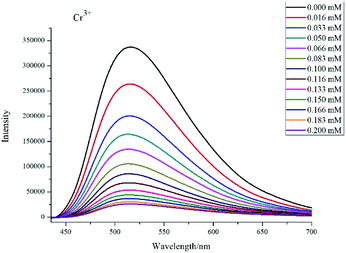 | ||
| Fig. 8 The luminescent spectra of 1 in water upon addition of Cr3+ ions in different concentrations. | ||
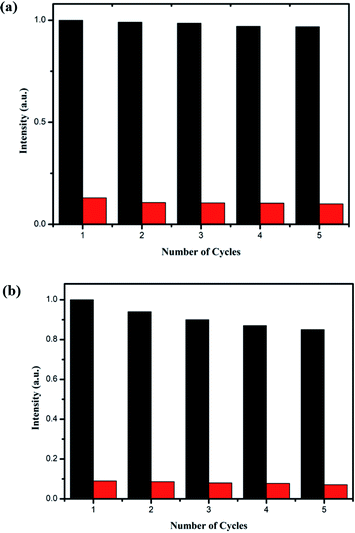
In order to study the recoverability and stability of compound 1, the quenching and recovery experiment of Fe3+/Cr3+ was carried out. The used samples can be regenerated and reused by simple centrifugation and washing with water or three times. The experimental results show that after 5 cycles, the detection effect of compound 1 remains basically unchanged, proving that it has good detection recyclability and stability (Fig. 9 and S14†).
4. Conclusions
In summary, three new porous and flexible LMOF structure 1–3 were synthesized under solvothermal reactions and structurally characterized by single crystal X-ray diffraction method. The changes in emissions energy and intensity imply that complex 1–3 may be useful for detection of AVOCs. Especially for 1, it shows a high sensitivity in detecting Fe3+ and Cr3+ due to the uncoordinated pyridine group within its framework, which can act as a potential ligand for metal ions. The observable interactive ability of 1 may make it a promising material for detecting these ions. This study provides an easy method to design and prepare MOF-based sensor for practical application.Conflicts of interest
There are no conflicts to declare.Acknowledgements
The JUST team would like to thank the support from National Natural Science Foundation of China (Grant No. 21671084).Notes and references
- Q. Gao, J. Xu and X. H. Bu, Coord. Chem. Rev., 2019, 378, 17–31 CrossRef CAS.
- P. A. Kobielska, A. J. Howarth, O. K. Farha and S. Nayak, Coord. Chem. Rev., 2018, 358, 92–107 CrossRef CAS.
- P. Samanta, A. V. Desai, S. Let and S. K. Ghosh, ACS Sustainable Chem. Eng., 2019, 7, 7456–7478 CrossRef CAS.
- X. D. Zhu, K. Zhang, Y. Wang, W. W. Long, R. J. Sa, T. F. Liu and J. Lu, Inorg. Chem., 2018, 57, 1060–1065 CrossRef CAS PubMed.
- F. Wang, W. Liu, S. J. Teat, F. Xu, H. Wang, X. Wang, L. An and J. Li, Chem. Commun., 2016, 52, 10249–10252 RSC.
- X. D. Zhu, K. Zhang, Y. Wang, W. W. Long, R. J. Sa, T. F. Liu and J. Lu, Inorg. Chem., 2018, 57, 1060–1065 CrossRef CAS PubMed.
- L. Z. Chen, Q. J. Pan, X. X. Cao and F. M. Wang, CrystEngComm, 2016, 18, 1944–1952 RSC.
- J. Zhang, S. Ren, H. Xia, W. Jia and C. Zhang, J. Mater. Chem. C, 2020, 8, 1427–1432 RSC.
- B. Parmar, K. K. Bisht, Y. Rachuri and E. Suresh, Inorg. Chem. Front., 2020, 7, 1082–1107 RSC.
- Z. Hu, B. J. Deibert and J. Li, Chem. Soc. Rev., 2014, 43, 5815–5840 RSC.
- M. Dinca, A. Dailly, Y. Liu, C. M. Brown, D. A. Neumann and J. R. Long, J. Am. Chem. Soc., 2006, 128, 16876–16883 CrossRef CAS.
- H. Wu, J. Yang, Z. M. Su, S. R. Batten and J. F. Ma, J. Am. Chem. Soc., 2011, 133, 11406–11409 CrossRef CAS PubMed.
- M. D. Zhang, C. M. Di, L. Qin, X. Q. Yao, Y. Z. Li, Z. J. Guo and H. G. Zheng, Cryst. Growth Des., 2012, 12, 3957–3963 CrossRef CAS.
- F. Meng, M. Zhang, K. Shen, Y. Li and H. Zheng, Dalton Trans., 2015, 44, 1412–1419 RSC.
- C. Hua, P. Turner and D. M. D'Alessandro, Dalton Trans., 2015, 44, 15297–15303 RSC.
- M.-D. Zhang, Y. Jiao, J. Li and M. D. Chen, Mendeleev Commun., 2015, 25, 65–66 CrossRef CAS.
- F. M. Wang, Z. Zhou, W. Liu, L. Zhou, L. Chen and J. Li, Dalton Trans., 2017, 46, 956–961 RSC.
- X. Zhang, Y. Gao, H. Liu and Z. Liu, CrystEngComm, 2015, 17, 6037–6043 RSC.
- X.-L. Qu, X.-L. Zheng and X. Li, RSC Adv., 2016, 6, 69007–69015 RSC.
- M. D. Allendorf, C. A. Bauer, R. K. Bhakta and R. J. Houk, Chem. Soc. Rev., 2009, 38, 1330–1352 RSC.
- W. P. Lustig, S. Mukherjee, N. D. Rudd, A. V. Desai, J. Li and S. K. Ghosh, Chem. Soc. Rev., 2017, 46, 3242–3285 RSC.
- G. Y. Wang, L. L. Yang, Y. Li, H. Song, W. J. Ruan, Z. Chang and X. H. Bu, Dalton Trans., 2013, 42, 12865–12868 RSC.
- B. Gole, A. K. Bar and P. S. Mukherjee, Chem. Commun., 2011, 47, 12137–12139 RSC.
- J. L. Du, J. P. Gao, C. P. Li, X. Y. Zhang, J. X. Hou, X. Jing, Y. J. Mu and L. J. Li, RSC Adv., 2017, 7, 49618–49625 RSC.
- Y. J. Yang, M. J. Wang and K. L. Zhang, J. Mater. Chem. C, 2016, 4, 11404–11418 RSC.
- Y. T. Yan, J. Liu, G. P. Yang, F. Zhang, Y. K. Fan, W. Y. Zhang and Y. Y. Wang, CrystEngComm, 2018, 20, 477–486 RSC.
- A. N. Dou, L. B. Yang, X. D. Fang, Q. Yin, M. D. Li, J. Li, M. Y. Wang, A. X. Zhu and Q. Q. Xu, CrystEngComm, 2018, 20, 3609–3619 RSC.
- Z. Hu, W. P. Lustig, J. Zhang, C. Zheng, H. Wang, S. J. Teat, Q. Gong, N. D. Rudd and J. Li, J. Am. Chem. Soc., 2015, 137, 16209–16215 CrossRef CAS PubMed.
- J. Wang, M. Jiang, L. Yan, R. Peng, M. Huangfu, X. Guo, Y. Li and P. Wu, Inorg. Chem., 2016, 55, 12660–12668 CrossRef CAS PubMed.
- B. Xing, H. Y. Li, Y. Y. Zhu, Z. Zhao, Z. G. Sun, D. Yang and J. Li, RSC Adv., 2016, 6, 110255–110265 RSC.
- Y. Wu, G. P. Yang, Y. Zhang, N. Shi, J. Han and Y. Y. Wang, RSC Adv., 2015, 5, 90772–90777 RSC.
- L. Li, Q. Chen, Z. Niu, X. Zhou, T. Yang and W. Huang, J. Mater. Chem. C, 2016, 4, 1900–1905 RSC.
- X. Y. Guo, F. Zhao, J. J. Liu, Z. L. Liu and Y. Q. Wang, J. Mater. Chem. A, 2017, 5, 20035–20043 RSC.
- H. Li, Y. Han, Z. Shao, N. Li, C. Huang and H. Hou, Dalton Trans., 2017, 46, 12201–12208 RSC.
- X. Meng, M. J. Wei, H. N. Wang, H. Y. Zang and Z. Y. Zhou, Dalton Trans., 2018, 47, 1383–1387 RSC.
- R. Minmini, S. Naha and S. Velmathi, Sens. Actuators, B, 2017, 251, 644–649 CrossRef CAS.
Footnote |
| † Electronic supplementary information (ESI) available: Experimental details, syntheses, PXRD, TGA, and PL spectra, etc. CCDC 1856573–1856575. For ESI and crystallographic data in CIF or other electronic format see DOI: 10.1039/d1ra00726b |
| This journal is © The Royal Society of Chemistry 2021 |

