
 Open Access Article
 This Open Access Article is licensed under a Creative Commons Attribution-Non Commercial 3.0 Unported Licence
Deposition behavior of lignin on solid surfaces assessed by stagnation point adsorption reflectometry†
Niloofar Alipoormazandarania,
Remco Fokkinkb and
Pedram Fatehi *a
*a
aChemical Engineering Department, Lakehead University, Thunder Bay, Canada. E-mail: pfatehi@lakeheadu.ca
bLaboratory of Physical Chemistry and Soft Matter, Wageningen University & Research, The Netherlands
First published on 7th May 2021
Abstract
The deposition behavior of lignin on a solid surface was studied using stagnation point adsorption reflectometry (SPAR) comprehensively. In this study, the light absorption coefficient of lignin (τ = 20![[thin space (1/6-em)]](https://www.rsc.org/images/entities/char_2009.gif) 476 m−1) at 633 nm wavelength was considered to define a new imaginary refractive index (k) used in the SPAR technique for adsorption analysis. The inclusion of k in the adsorption model yielded an adsorbed amount (Γ) of 1.11 mg m−2, leading to the quality factor (Qf) of 31.71 mg m−2. At a lower concentration, the deposition of lignin on the surface was increased, and it generated a maximum sticking coefficient of β = 0.71 at 25 mg L−1 on the surface. At the concentration range of 35 and 45 mg L−1, lignin formed clusters and its deposition dropped. The use of Quartz crystal microbalance (QCM) and SPAR techniques also confirmed that the proportion of water in the deposited lignin adlayer was greater when a lower concentration (5–25 mg L−1) of lignin solution was used for adsorption. The findings of this study revealed the potential use of the SPAR technique for evaluating the deposition performance of lignin-based materials on varied surfaces, which would facilitate the development of coating and composite applications for lignin.
476 m−1) at 633 nm wavelength was considered to define a new imaginary refractive index (k) used in the SPAR technique for adsorption analysis. The inclusion of k in the adsorption model yielded an adsorbed amount (Γ) of 1.11 mg m−2, leading to the quality factor (Qf) of 31.71 mg m−2. At a lower concentration, the deposition of lignin on the surface was increased, and it generated a maximum sticking coefficient of β = 0.71 at 25 mg L−1 on the surface. At the concentration range of 35 and 45 mg L−1, lignin formed clusters and its deposition dropped. The use of Quartz crystal microbalance (QCM) and SPAR techniques also confirmed that the proportion of water in the deposited lignin adlayer was greater when a lower concentration (5–25 mg L−1) of lignin solution was used for adsorption. The findings of this study revealed the potential use of the SPAR technique for evaluating the deposition performance of lignin-based materials on varied surfaces, which would facilitate the development of coating and composite applications for lignin.
1. Introduction
In the design of green soft surfaces, the fabrication of biological micromodules, e.g., lignin,1 cellulose,2,3 and xylan4 have attracted attention in recent years. In particular, lignin-derived surfaces offer opportunities for the development of novel lignin nano chemicals relevant to biomaterial and biofuel production. For example, by taking advantage of lignin's unique properties and structure, researchers studied the interaction of lignin with other materials for developing smart surfaces applied in composite and nanofiber production.5–8Monitoring the adsorption of biomaterials on surfaces plays a crucial role in generating novel functionalized bioproducts. There are different methods to study the deposition of molecules (e.g., lignin) on various surfaces. In one method, the adsorption of lignin derivatives on surfaces can be studied by a Quartz crystal microbalance with dissipation (QCM-D). In this method, the interaction of lignin with polyelectrolyte,9 protein,10 and other green materials, such as cellulose,11 was extensively studied by QCM-D. Yet, the QCM-D analysis provides information on the wet bulky adsorbed mass due to the inevitable association of water in the hydrated adlayer film.12 In addition, this technique is solely suitable for liquid-phase applications with low conductivity.13 Thus, QCM-D studies are limited to adsorption analysis mainly in water or humid environment.14 Alternatively, the use of ellipsometry to measure the dry adsorbed mass of polymers, proteins, or surfactants on various substrates has been practiced.15 However, the widespread utilization of this technique has been limited due to its sensitivity to the transparency of the films, unreflective substrate,16 and high adsorption requirement (with adsorbed thickness >10 nm).17
On the other hand, a simple reflectometric technique was developed to study the adsorption properties of materials using a stagnation point flow reflectometry (SPAR). In this method, the deposition process is directly observed in the hydrodynamic condition in a flow cell.18 This technique accurately describes the adsorption kinetics and hydrodynamics of the mass flux at the stagnation point.19 In addition, the main advantage of performing adsorption at the stagnation point is that the effect of transportation of the molecules from the bulk to the surface is taken into account, and the influence of hydrodynamic disturbances on the flow near the stagnation point is eliminated. This reflectometry process facilitates the exclusion of the adsorbed water content from adsorption analysis. However, the use of this method has been limited to the cases where the optical contrast between adsorbate and solution is rather low to minimize the changes in the reflectivity of the surface.20
It is known that the surface of lignin carries a large number of hydroxy groups and can carry other new functionalities introduced via different reactions to lignin.21 Thus, lignin has the potential for adsorbing water while deposited on different surfaces. Research has been undertaken to determine the deposition of lignin on different surfaces in a multilayer assembly,22,23 but the presence of adsorbed water may introduce undesired uncertainty to the analysis. By evaluating the use of SPAR upon developing a new theoretical model, the possibilities for studying the deposition kinetics of lignin (excluding the entrapped water) can be assessed. This assessment will ultimately facilitate the development of lignin-based multilayer films relevant to the food, medicine, and cosmetic industries. The main objective of this research is to verify a qualitative model to evaluate the validity and accuracy of SPAR to predict the deposition of lignin-based compounds on solid surfaces. Considering that previous theories of SPAR were limited to describing colorless particle–surface interactions, this analysis is expected to extend the use of SPAR in evaluating the deposition of lignin derivatives (i.e., non-transparent polymers) on solid surfaces without the impact of adsorbed water.
In addition, this study determines the impact of lignin concentration on the adsorption behavior of lignin experimentally, which is essential for developing an application for lignin in coating formulations. To understand the deposition pattern of lignin, its physicochemical properties are thoroughly investigated by aid of hydrodynamic size, zeta potential, and SEM analyses. The deposition performance of lignin was determined using QCM-D, and the results were compared with those generated from SPAR, to determine the water content of lignin adlayer adsorbed on the solid surface. The main novelties of this research were (1) the introduction of the SPAR instrument as a reliable technique for studying lignin adsorption, and (2) the fundamental assessment of the lignin deposition on the solid surface at different lignin concentrations.
2. Methods
2.1. Lignin solution and analysis
Softwood kraft lignin was provided by FPInnovations' plant in Thunder Bay, Ontario, Canada. Lignin was isolated from black liquor of the kraft pulping process via LignoForce technology. Sodium nitrate (NaNo3), ethanol, sodium chloride (NaCl), hydrochloric acid (HCl), sodium dodecyl sulfate, polydiallyldimethylammonium chloride (PDADMAC), and sodium hydroxide (NaOH) were purchased from Sigma-Aldrich company. The zeta potential of lignin solution was measured using a NanoBrook Zeta PALS (Brookhaven Instruments Corp, USA). In this experiment, solutions (25 mg L−1) were prepared at a pH range of 3–10 with 0.1 M HCl or NaOH, or at different sodium chloride concentrations of 0–1000 mM and incubated at 30 °C, 150 rpm, and 2 hours prior to testing. The analysis was performed at a constant electric field (8.4 V cm−1) three times and the average values were presented. Dynamic light scattering, DLS, analyzer (BI-200SM Brookhaven Instruments Corp., USA) with the specifications of 35 mW power and 637 nm wavelength was employed to monitor the hydrodynamic diameter and diffusion coefficient of lignin according to Stoke's law in the solution at the light scattered angle of 90° and temperature of 25 °C.24 The lignin solutions were well stirred and maintained undisturbed for 24 h. The refractive index increment (dn/dc) of lignin in 0.1 M NaOH solution at 0.1–1 mg mL−1 concentrations was determined by a differential refractometer, Brookhaven BI-DNDC, USA, according to Gidh et al.25 and reported to be dn/dc = 0.150 mL g−1. Also, lignin's absorbance at 633 nm was measured by a UV-vis spectrophotometer (Genesys 10S UV-Vis) in solution at different concentrations ranging 0.1–1 mg mL−1 using a standard UV Quartz spectrometer cuvette cell (1 cm path length, 3.5 mL volume).2.2. Silica surface preparation
To prepare the silica surface, silicon wafers (Wafernet Inc., USA) were oxidized at 1000 °C for 1 h that resulted in an oxide layer of 80 ± 3 nm measured by null ellipsometry (model 43702-200E from Rudolph Research, Flanders, NJ, US). The wafers were cut into strips of approximately 10 × 50 mm for use as reflectometry substrates. The oxidized wafers were washed with a sequence of water, ethanol, and water, dried with nitrogen gas, and cleaned with UV/ozone cleaner (PSD Series, digital UV ozone system, NOVASCAN) for 200 s.2.3. Adsorption analysis using SPAR
 .
.
 | ||
| Fig. 1 Schematic illustration of the SPAR experimental set-up. | ||
Fig. 2a illustrates the required optical properties of each layer in the adsorption model. In this study, imaginary refractive index (k), thickness (d), refractive index (n), and refractive index increment (dn/dc) are considered to determine the final Qf. To determine Qf (quality factor, defined to relate Γ and ΔS/S0), one should use the optical model to calculate the value of R0 for the bare surface (according to Abeles matrix26 and Fresnel27 equations as described in the ESI†). Next, an estimation for the adsorbed amount Γest and the thickness da should be used to calculate na for such an assumed layer. Then, this layer should be added to the stack (see Fig. 2b), and the optical model should be used to find R for this layer. The da of 5 nm in the case of small polymers (like lignin) is assumed,28 and the correlation of na and R in the optical model is thoroughly discussed in the ESI.† Now, one should calculate ΔR/R0 such that, if Γest is assumed correctly, this value will be equal to the measured value of ΔS/S0. If that is not the case, one should change Γest and reiterate this so that ΔR/R0 = ΔS/S0. This Γest is then used for calculating Qf. The fundamentals associated with the conversion of the signal to adsorbed mass and calculation of Qf or R are thoroughly explained in the ESI.†
 | ||
| Fig. 2 Overview of parameters in the multilayer optical model describing the reflection interface. | ||
Previous SPAR studies used polymers that do not absorb light. In this work, hypothetical parameters related to the light absorbance properties of lignin, i.e., absorption coefficient (ε), extinction coefficient (τ), and imaginary refractive index (k), are considered to study the adsorption model of lignin on the silica sensor for the first time. Based on these parameters, the final Qf of lignin on the silica surface is determined.
Generally, the response of materials to electromagnetic fields is important in optical analysis. In the case of lignin with light absorption capacity, the optical response is described with the imaginary refractive index k. In order to determine this index, the absorption coefficient τ and extinction coefficient ε are initially determined. The decrease in the intensity I of light absorbed per unit of length l in non-transparent lignin is proportional to actual I according to eqn (1):
| dI(l)/dl=−τI(l) | (1) |
| I(l) = I0e−τl | (2) |
where
 | (3) |
| τ = εc/log(e) with e the natural number 2.7182… | (4) |
Now, the imaginary refractive index, k, can be calculated using eqn (5):
 | (5) |
| Ñ = na − k | (6) |
In the case of lignin, one should use this complex refractive index Ñ instead of na in the optical model described above to calculate new R, Γ, and Qf.
The adsorption was repeated with lignin solutions with predetermined concentrations of 25 mg L−1 at pH 7 and the final adsorbed mass was calculated based on the final ΔS/S0 with and without considering the light absorbency of lignin.
2.4. Adsorption analysis using QCM-D
A Quartz crystal microbalance with dissipation (QCM-D 401, E1, Qsense Inc. Gothenborg, Sweden) instrument was employed to simultaneously monitor the frequency and dissipation changes upon adsorption of lignin on silica-coated sensors as explained previously.9 Data fitting and time monitoring were conducted using Q-Tools software (Q-Sense, Gothenburg, Sweden). The sensors were treated with a 2 wt% solution of fresh Mili-Q water/sodium dodecyl sulfate for 30 min. Then, the sensors were dried with nitrogen gas and placed in the UV/ozone oxidation cleaner (PSD Series, digital UV ozone system, NOVASCAN) for 10 min prior to use. Lignin solution was prepared with the HPLC grade Mili-Q water at pH 7 and stirred overnight to ensure that the full dissolution was achieved. The same water sample was used throughout the QCM experiment. Solutions were pumped by a peristaltic pump through the chamber of the QCM-D instrument at the flow rate of 0.15 mL min−1 and 20 ± 2 °C.By combining results obtained from QCM-D and reflectometry, it is possible to calculate the water content of the adsorbed lignin layer according to:
 | (7) |
2.5. Scanning electron microscopy (SEM)
The QCM sensors after lignin adsorption in the concentration range of 5 and 45 mg L−1 on the QCM-D experiment were collected to investigate the morphology of adsorbed lignin on the surface. SEM images were obtained using a Hitachi SU-70 field emission SEM along with energy dispersive X-ray spectroscopy in a 5 kV voltage at 2000× magnifications.For a better understanding of the results, analysis was conducted at 9 different concentrations of lignin within 5–45 mg L−1 (increment of 5 mg L−1). However, for simplification and better visualization of plots, SPAR ΔS/S0, SEM, and QCM dissipation/frequency results are shown at 5 different concentrations (increment of 10 mg L−1).
3. Results and discussion
3.1. Evaluation of SPAR technique for lignin adsorption
| Γest, mg m−2 | Γ/da lignin, g mL−1 | na | R0 | R | ΔR/R0 |
|---|---|---|---|---|---|
| 1.09 | 0.218 | 1.3654 | 6.9359 × 10⁻² | 7.1731 × 10⁻² | 0.0342 |
| 1.10 | 0.220 | 1.3657 | 6.9359 × 10⁻² | 7.1752 × 10⁻² | 0.0345 |
| 1.11 | 0.222 | 1.3660 | 6.9359 × 10⁻² | 7.1773 × 10⁻² | 0.0348 |
| 1.12 | 0.224 | 1.3663 | 6.9359 × 10⁻² | 7.1794 × 10⁻² | 0.0351 |
| 1.13 | 0.226 | 1.3666 | 6.9359 × 10⁻² | 7.1815 × 10⁻² | 0.0354 |
700 mL g−1 m−1 and the adsorbed layer concentration of c = 0.224 g mL−1 are measured, which yields τ = 20476 m−1 following eqn (4). Now, by using eqn (5), one can find k = 0.001031. By considering the new complex refractive index by combining the actual refractive index (na = 1.3663) and the imaginary refractive index of lignin (k = 0.001031) (eqn (6)), as the third stacking layer in Fig. 2b, the R can be determined as explained above. The procedure to relate Γest and R is explained in the ESI.† By repeating the calculation with a few values of Γest (Table 2), the new theoretical value of R = 7.1786 × 10⁻² yields ΔR/R0 = 0.0350, which meets the ultimate goal of ΔR/R0 = ΔS/S0 precisely. The quality factor response of Qf = 31.71 mg m−2 and adsorbed mass of Γ = 1.11 mg m−2 are generated, which are very close to the values obtained following the first approach without considering the k value (Γ = 1.12 mg m−2 and Qf = 31.89 mg m−2 in Section 4.1.1).
| Γest, mg m−2 | Γ/da lignin, g mL−1 | na | k | R0 | R | ΔR/R0 |
|---|---|---|---|---|---|---|
| 1.09 | 0.218 | 1.3654 | 0.001004 | 6.9359 × 10⁻² | 7.1744 × 10⁻² | 0.0344 |
| 1.10 | 0.220 | 1.3657 | 0.001013 | 6.9359 × 10⁻² | 7.1765 × 10⁻² | 0.0347 |
| 1.11 | 0.222 | 1.3660 | 0.001022 | 6.9359 × 10⁻² | 7.1786 × 10⁻² | 0.0350 |
| 1.12 | 0.224 | 1.3663 | 0.001031 | 6.9359 × 10⁻² | 7.1808 × 10⁻² | 0.0353 |
| 1.13 | 0.226 | 1.3666 | 0.001040 | 6.9359 × 10⁻² | 7.1829 × 10⁻² | 0.0356 |
To further investigate the effect of light absorption, the calculation in this approach was repeated for the high values of ε to check what would be the effect, if the molecules had their light absorption peak around 633 nm (i.e., the wavelength of the laser used). For this calculation, we used a value of ε = 4.80 mL mg−1.cm (lignin absorption peak at 400 nm). The results were Γ = 1.04 mg m−2 and Qf = 29.98 mg m−2. In this “worst-case scenario”, the error in the calculation of adsorbed mass and quality factor was about 6%, which would still be acceptable. Thus, SPAR can be used for the adsorption analysis of lignin on surfaces. This implies that the correction made by the assumption that lignin might absorb light in the SPAR analysis is insignificantly important, and it can simply be neglected using SPAR for studying the adsorption characteristics of lignin on surfaces.
3.2. Adsorption at different concentrations
The formation, behavior, and mechanism of lignin adsorption on silica surfaces at different concentrations were assessed by SPAR. The physicochemical properties of lignin i.e., zeta potential and hydrodynamic size at different pH, ionic strength, and concentrations are shown in Fig. 3. It is known that the properties of charged polymers in solutions are predominantly affected by their charge interactions. As shown in Fig. 3a, the highest zeta potential of lignin solution was obtained at pH ≤ 7, validating the great association of charged groups, i.e., phenolic and carboxylic acid groups of lignin, in generating electrostatic repulsion between the lignin segments. Similarly, the particle size of lignin was relatively stable in the pH range of 5–10 due to a high surface charge (with a corresponding particle size of 200–320 nm), while a significant size increment was observed at pH < 5 (with a corresponding particle size of 400–2800 nm). The aggregation of particles at lower pH reflects the major role of the electrostatic repulsion forces in this system. This is in agreement with previous reports on lignin solution behavior.32 In addition, the effect of ionic strength (NaCl, mM) on the zeta potential and particle size of lignin was evaluated, and the results are presented in Fig. 3b. By increasing the NaCl concentration, the zeta potential of the solution changed from −22 mV to −2 mV due to the screening of lignin charges by Na+Cl−. There was also a rapid increase in the particle size at a higher NaCl concentration due to the higher association of particles in a charge-free system with no electrostatic repulsion that causes agglomeration. The hydrodynamic size analysis of lignin at pH 7 at various concentrations (Fig. 3c) indicated the association of electrostatic repulsion forces at the lower concentration of 5–25 mg L−1, resulting in a well-dispersed solution with a rather stable particle size of 200–240 nm. In contrast, by populating the number of particles in the solution at 35–45 mg L−1 concentration, the importance of electrostatic repulsion force diminished, and particle size increased to 300–440 nm.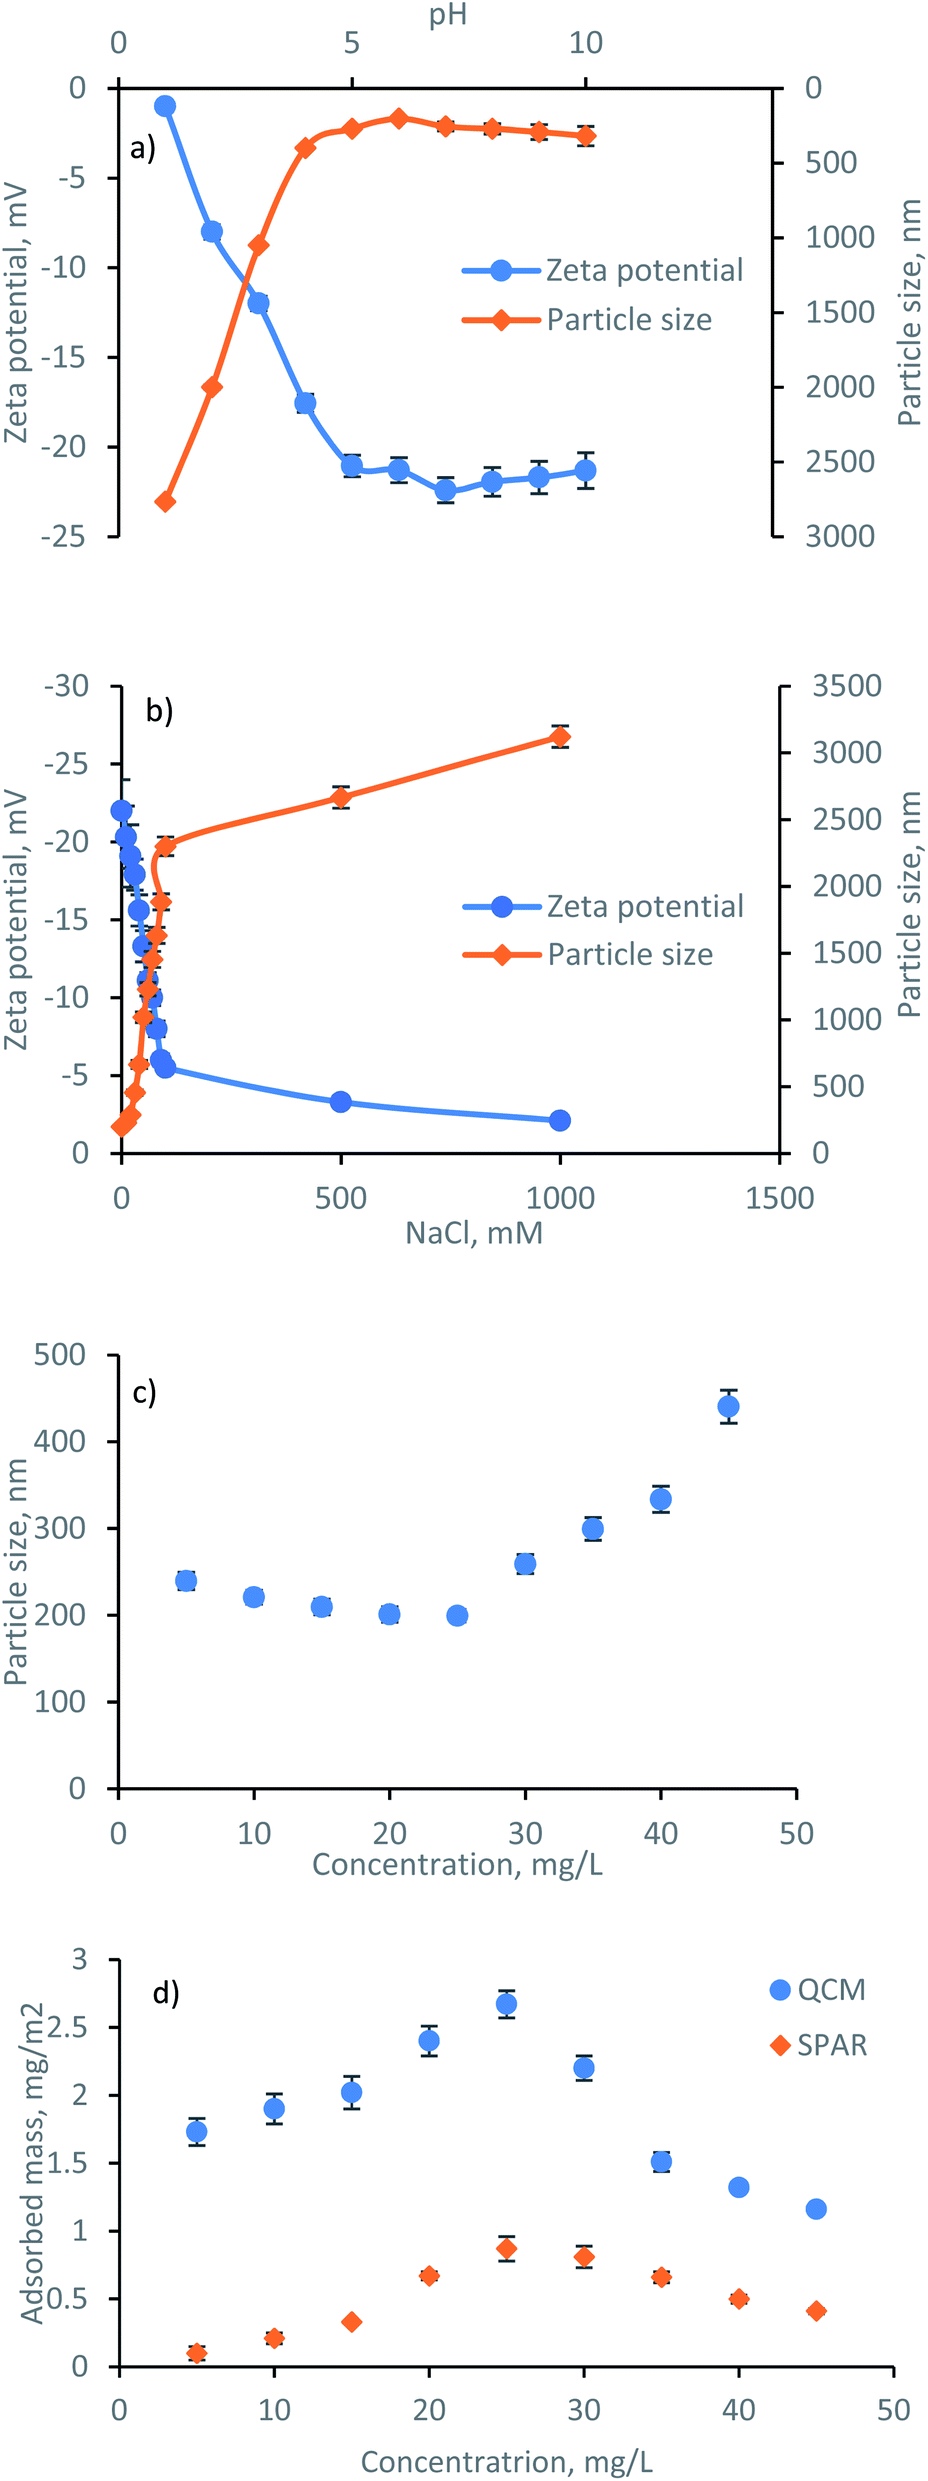 | ||
| Fig. 3 (a) pH effect on the zeta potential and size of lignin, (b) NaCl effect on the zeta potential and size of lignin, (c) concentration effect of lignin solution on the size of lignin, and (d) adsorbed mass determined by SPAR and QCM. | ||
To understand the impact of lignin concentration on its adsorption behavior, the adsorbed mass of lignin is also plotted in Fig. 3d. Silica surface includes the occasional existence of silanol groups Si–O–H.33 It was observed that by increasing the lignin concentration to 25 mg L−1, the adsorbed mass reached the maximum Γ value. At this concentration, a greater number of smaller lignin molecules approached the silica surface. Thus, the collision rate between the lignin and surface was higher through the association of intermolecular hydrogen bonding among OH of silica and oxygen of carboxylate and hydroxyl group of lignin. In contrast, subsequent exposure to the higher concentration of lignin (35–45 mg L−1) induced a smaller Γ, possibly related to the less significant interactions between the large lignin particles and silica substrate. Likewise, an excessive number of larger lignin particles approaching the silica surface at 35–45 mg L−1 concentration caused a strong repulsion force between the slightly negative lignin and negative silica, thus, limited the adsorbed mass. In conclusion, the collision rate, number of available lignin molecules, the affinity of particles to form molecular bonding, and size of particles are determining factors in their adsorbed mass herein.
3.3. Adsorption rate and sticking coefficient
Charge density (−0.7 meq g−1), phenolic-OH (3.1 mmol g−1), carboxyl group (0.6 mmol g−1), and polydispersity index (Mw/Mn = 1.82) of lignin was measured (explained in the lignin characterization section of ESI†). The adsorbed mass increased in a linear fashion with time in the reflectometry technique (shown from the signal changes with time in Fig. 4a). The slope of the adsorbed mass versus time is correlated to the initial experimental adsorption rate, as shown by the first order rate law in eqn (8):34
 | (8) |
 | ||
| Fig. 4 (a) Signal changes upon the adsorption of lignin in SPAR at various concentrations, (b) sticking coefficient as a function of lignin concentration in SPAR measurements on a silica surface. | ||
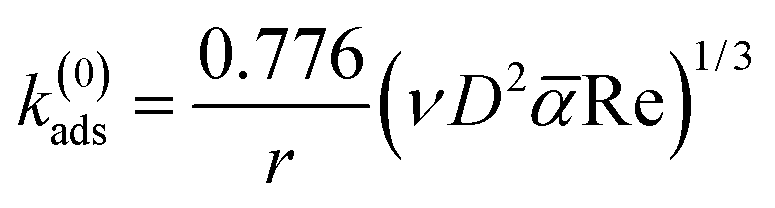
Assuming a perfect sink condition at the surface in the stagnation point flow geometry, the initial theoretical adsorption rate coefficient can be estimated from the steady-state flux based on eqn (9):34
 | (9) |
![[small alpha, Greek, macron]](https://www.rsc.org/images/entities/i_char_e0c2.gif) is the dimensionless flow intensity parameter. The mean flow velocity of the fluid in the tube of the SPAR analysis (u) is determined from the volumetric flow rate. The dimensionless flow intensity parameter was calculated based on the work of Dabros and van de Ven.35 For a volumetric flow rate of 1 mL min−1, Re ≈ 10.39 and the flow intensity parameter of ≈ 5.95 were obtained. The final value k(0)ads is reported in Fig. S3b† for the solutions of lignin with different concentrations.
is the dimensionless flow intensity parameter. The mean flow velocity of the fluid in the tube of the SPAR analysis (u) is determined from the volumetric flow rate. The dimensionless flow intensity parameter was calculated based on the work of Dabros and van de Ven.35 For a volumetric flow rate of 1 mL min−1, Re ≈ 10.39 and the flow intensity parameter of ≈ 5.95 were obtained. The final value k(0)ads is reported in Fig. S3b† for the solutions of lignin with different concentrations.
By comparing the kads experimental adsorption rate to the k(0)ads theoretical adsorption rate, the sticking coefficient β is defined as the ratio between the experimentally and theoretical adsorption rates according to eqn (10):36
 | (10) |
The value of β = 1 is expected for a transport-controlled process, i.e., where the adsorbent transports towards the surface. However, lower β values indicate that the adsorption of a fraction of the arriving lignin molecules to the surface is prevented.37 The sticking coefficient of the lignin solution is displayed in Fig. 4b. The highest dimensionless sticking coefficient value of β = 0.71 was obtained at the lignin concentration of 25 mg L−1, which indicated the greatest affinity of lignin particles for adsorbing on the silica surface.36,37 However, further concentrating the lignin solution to 35–45 mg L−1 reduced the sticking coefficient (the lowest of β = 0.20), inferring that the binding of lignin particles to the surface was hampered. In this case, increasing the concentration of lignin from 25 mg L−1 to 45 mg L−1 facilitated the collision of the slightly negative lignin chains and thus the agglomeration of lignin particles in the solution (as evident by the particle size growth in Fig. 3c). Agglomerated chains would not readily adsorb to the stagnant layer, leading to a lower flux to the surface and a smaller adsorption rate (kads and k(0)ads).
In conclusion, the results at the concentration range of 5–25 mg L−1 showed that the adsorbed mass and concentration were proportionally correlated. In contrast, any changes in the concentration beyond 25 mg L−1 adversely affected the adsorption.
The SEM images of the lignin films were made at different concentrations in Fig. 5a–e. The progressive increase in the surface coverage is observed by concentrating the lignin solution in the 5–25 mg L−1 concentration range, while the formation of aggregates with a lower surface coverage is observed at a higher lignin concentration of 35–45 mg L−1. This finding is in line with the particle size growth and adsorbed mass shown in Fig. 3. Thus, the attachment of lignin solution with different concentrations on the interface can be interpreted as the different populations of lignin particles with different affinities and conformation to adsorb on the silica surface.
 | ||
| Fig. 5 Morphology of adsorbed lignin on silica surface after the QCM adsorption at different concentrations of (a) 5 mg L−1, (b) 15 mg L−1, (c) 25 mg L−1, (d) 35 mg L−1, and (e) 45 mg L−1. | ||
3.4. Water content of adsorbed adlayer
The comparison of QCM-D (frequency versus dissipation shown in Fig. 6) and SPAR adsorbed mass shown in Fig. 3d also demonstrated that silica–lignin interaction significantly influenced the water content of the adlayer. The amount of water calculated using eqn (7) was 94–67% in 5–25 mg L−1 concentration and 49–64% in 35–45 mg L−1 concentration. Thus, the higher the adsorbed mass, the higher the water content in the adsorbed layer. This is in line with previous studies reported by Liu et al.38 The water content of the adlayer is also correlated to the dissipation changes measured by QCM-D. When the smaller lignin chains at the lower concentration of 5–25 mg L−1 reach the silica surface, they deposit with higher structural flexibility (ΔD = 1–1.4 × 10⁻⁶); however, when the large lignin particles at a higher concentration of 35–45 mg L−1 reach the silica surface, they deposit in a denser structure with a lower ΔD = 0.9 × 10⁻⁶. | ||
| Fig. 6 QCM-D adsorption of lignin on silica surface at different concentrations of 5–45 mg L−1. | ||
3.5. Significance and novelty
In this study, the deposition of lignin with well-defined particle size, zeta potential, and morphology was studied comprehensively using a SPAR technique for the first time. Compared to the previous materials with limited light absorbency (cellulose and polyelectrolytes) studied by the SPAR technique, we theoretically demonstrated that the possible light absorbance of non-transparent lignin would not have a significant effect on the adsorption characteristics of lignin. The assessment of lignin adsorption with the SPAR technique may extend the application of lignin in packaging, coating, and composite industries. The experimental studies conducted in this work illustrated that the water content of lignin-based adsorbed multilayer systems can be identified using SPAR and QCM techniques.4. Conclusions
An extended mathematical method for the deposition of lignin on the silica surface was verified by considering the light absorbance properties of lignin (i.e., ε, τ, and k values). Implementing the k value in the optical model yielded Γ of 1.11 mg m−2 and Qf of 31.71 mg m−2, similar to those reported upon excluding k. The theoretical modeling confirmed that SPAR can be used for assessing the deposition of lignin on the silica surface. Moreover, experimental results showed that lignin has different adsorption behavior on the silica surface at 5–45 mg L−1 concentrations. At a lower concentration of 5–25 mg L−1, its adsorption increased with the sticking coefficient of 0.71. At a higher concentration of 35–45 mg L−1, lignin's hydrodynamic size increased implying its agglomeration, which reduced its adsorption on the silica surface. Furthermore, the SPAR and QCM-D studies revealed that the water content of the adsorbed adlayer was higher (94–67 wt% of the adlayer) at the higher adsorbed mass of lignin, and its water content was reduced when lignin adsorption dropped. This study offers novel opportunities in understanding the adsorption behavior of lignin on solid surfaces, which in turn extends the application of lignin in various fields where surface functionalization and adsorption (e.g., biomedical, coating formulas, Pickering emulsions, pulp, and paper) play crucial roles.Author contributions
Niloofar Alipoormazandarani (E-mail: nalipoor@lakeheadu.ca; ): methodology, original draft. Remco Fokkink (remco.fokkink@wur.nl): Data curation, validation. Pedram Fatehi supervision, review & editing.Conflicts of interest
The authors declare that they have no known competing financial interests or personal relationships that could have appeared to influence the work reported in this paper.Acknowledgements
The authors would like to acknowledge NSERC, Canada Foundation for Innovation, Canada Research Chairs, Northern Ontario Heritage Fund Corporation, and Ontario Research Fund programs for supporting this research.References
- S. F. Sun, H. Y. Yang, J. Yang, Z. J. Shi and J. Deng, Int. J. Biol. Macromol., 2021, 178, 373 CrossRef CAS PubMed
.
- X. Liu, H. Zhang, J. Shen, B. Li and S. Fu, Int. J. Biol. Macromol., 2021, 178, 527 CrossRef CAS PubMed
- H. Shaghaleh, X. Xu and S. Wang, RSC Adv., 2018, 8, 825 RSC
- G. Q. Fu, S. C. Zhang, G. G. Chen, X. Hao, J. Bian and F. Peng, Int. J. Biol. Macromol., 2020, 158, 244 CrossRef CAS PubMed
- T. Ju, Z. Zhang, Y. Li, X. Miao and J. Ji, RSC Adv., 2019, 9, 24915–24921 RSC
- X. Wang, Z. Zhou, X. Guo, Q. He, C. Hao and C. Ge, RSC Adv., 2016, 6, 35550 RSC
- N. Alipoormazandarani and P. Fatehi, J. Phys. Chem. B, 2020, 124, 8678 CrossRef CAS PubMed
- H. Zhao, Q. Wang, Y. Deng, Q. Shi, Y. Qian, B. Wang, L. L. ü and X. Qiu, RSC Adv., 2016, 6, 77143 RSC
- N. Alipoormazandarani and P. Fatehi, Langmuir, 2018, 34, 15293 CrossRef CAS PubMed
- C. Salas, O. J. Rojas, L. A. Lucia, M. A. Hubbe and J. Genzer, ACS Appl. Mater. Interfaces, 2013, 5, 199 CrossRef CAS PubMed
- H. Lou, M. Wang, H. Lai, X. Lin, M. Zhou, D. Yang and X. Qiu, Bioresour. Technol., 2013, 146, 478 CrossRef CAS PubMed
- Z. Yang, S. Si, X. Zeng, C. Zhang and H. Dai, Acta Biomater., 2008, 4, 560 CrossRef CAS PubMed
- A. Alassi, M. Benammar and D. Brett, Sensors, 2017, 17, 2799 CrossRef PubMed
- Y. Yao, H. Zhang, J. Sun, W. Ma, L. Li, W. Li and J. Du, Sens. Actuators, B, 2017, 244, 259 CrossRef CAS
- R. M. Azzam, N. M. Bashara and S. S. Ballard, Phys. Today, 1978, 31, 72 CrossRef
- R. Pascu and M. Dinescu, Rom. Rep. Phys., 2012, 64, 135 CAS
- H. Fujiwara, Spectroscopic ellipsometry: principles and applications, John Wiley & Sons, 2007 Search PubMed
- J. Dijt, M. C. Stuart and G. Fleer, Adv. Colloid Interface Sci., 1994, 50, 79 CrossRef CAS
- M. F. Mora, M. R. Nejadnik, J. L. Baylon-Cardiel, C. E. Giacomelli and C. D. Garcia, J. Colloid Interface Sci., 2010, 346, 208 CrossRef CAS PubMed
- J. Dijt, M. C. Stuart, J. Hofman and G. Fleer, Colloids Surf., 1990, 51, 141 CrossRef CAS
- T. Aro and P. Fatehi, ChemSusChem, 2017, 10, 1861 CrossRef CAS PubMed
- Y. Deng, T. Wang, Y. Guo, X. Qiu and Y. Qian, ACS Sustainable Chem. Eng., 2015, 3, 1215 CrossRef CAS
- L. G. Paterno, C. J. Constantino, O. N. Oliveira Jr and L. H. Mattoso, Colloids Surf., B, 2002, 23, 257 CrossRef CAS
- W. Li, S. W. Cui and Q. Wang, Biomacromolecules, 2006, 7, 446 CrossRef CAS PubMed
- A. V. Gidh, S. R. Decker, C. H. See, M. E. Himmel and C. W. Williford, Anal. Chim. Acta, 2006, 555, 250 CrossRef CAS
- M. R. Böhmer, E. A. van der Zeeuw and G. J. Koper, J. Colloid Interface Sci., 1998, 197, 242 CrossRef PubMed
- D. Yevick, T. Friese and F. Schmidt, J. Comput. Phys., 2001, 168, 433 CrossRef
- T. Benselfelt, T. Pettersson and L. Wågberg, Langmuir, 2017, 33, 968 CrossRef CAS PubMed
- H. Rose, Nature, 1952, 169, 287 CrossRef CAS
- J. Geist, A. R. Schaefer, J. Song, Y. H. Wang and E. F. Zalewski, J. Res. Natl. Inst. Stand. Technol., 1990, 95, 549 CrossRef CAS PubMed
- L. Enarsson and L. Wågberg, Biomacromolecules, 2009, 10, 134 CrossRef CAS PubMed
- Q. Ma, L. Chen, R. Wang, R. Yang and J. Y. Zhu, Holzforschung, 2018, 72, 933 CrossRef CAS
- I. Popa, B. P. Cahill, P. Maroni, G. Papastavrou and M. Borkovec, J. Colloid Interface Sci., 2007, 309, 28 CrossRef CAS PubMed
- E. S. Kooij, E. A. M. Brouwer, H. Wormeester and B. Poelsema, Colloids Surf., A, 2003, 222, 103 CrossRef CAS
- T. Dabroś and T. G. van de Ven, Colloid Polym. Sci., 1983, 261, 694 CrossRef
- M. Jiang, I. Popa, P. Maroni and M. Borkovec, Colloids Surf., A, 2010, 360, 20 CrossRef CAS
- L. E. Valenti, P. A. Fiorito, C. D. García and C. E. Giacomelli, J. Colloid Interface Sci., 2007, 307, 349 CrossRef CAS PubMed
- X. Liu, A. Dedinaite, T. Nylander, A. P. Dabkowska, N. Skoda, R. Makuska and P. M. Claesson, J. Colloid Interface Sci., 2015, 440, 245 CrossRef CAS PubMed
Footnote |
| † Electronic supplementary information (ESI) available. See DOI: 10.1039/d1ra02248b |
| This journal is © The Royal Society of Chemistry 2021 |