 Open Access Article
Large magnetodielectric response of PST/LSMO/LCMO film over a wide temperature range
Ying Chen abc,
Fen Xuec,
Zhengyang Zhouc,
Genshui Wangc,
Wensheng Wang
 c,
Xianlin Dongc,
Liangcai Wu*a and
Zhitang Song*a
aState Key Laboratory of Functional Materials for Informatics, Laboratory of Nanotechnology, Shanghai Institute of Micro-system and Information Technology, Chinese Academy of Sciences, 865 Changning Road, Shanghai 200050, People's Republic of China. E-mail: lcwu@dhu.edu.cn
bUniversity of Chinese Academy of Sciences, 19 A Yuquan Rd, Shijingshan District, Beijing 100049, People's Republic of China
cShanghai Institute of Ceramics, Chinese Academy of Sciences, 1295 Dingxi Road, Shanghai 200050, People's Republic of China
First published on 7th April 2021
Abstract
Pb0.6Sr0.4TiO3/La0.7Sr0.3MnO3/La0.7Ca0.3MnO3 (PST/LSMO/LCMO) film is grown on Si substrate by chemical solution deposition method. The film crystallizes perfectly into perovskite phases with a random crystalline orientation. The La0.7Sr0.3MnO3/La0.7Ca0.3MnO3/Si layer exhibits low resistivity and obvious negative magnetoresistivity (MR); the PST/LSMO/LCMO film shows notable magnetocapacitance (MC) above 350 K, from 102.9% to 29.5%. Near room temperature, there is no distinguished magnetoelectric coupling; the MC is 34.3% @ 250 K, 29.5% @ 300 K and 32.8% @ 350 K respectively. The mechanism can be explained in light of the Maxwell–Wagner (MW) model and the enhanced MR origin from the successive mixed manganite phases and spin dependent tunneling across the junctions of PST/LSMO/LCMO. This work provides a new approach for designing and developing novel composites with promising MC.
Introduction
Magnetodielectric compounds with magnetocapacitance (MC) over a wide temperature range near room temperature have attracted much attention due to possibility of designing next generation multifunctional devices such as magnetic field sensors, multistate memory elements, actuators, transducers, electro-optic system, filters and phase shifters.1–5 The MC is defined as (CH − C0)/C0 × 100%, where CH and C0 present capacitance with and without a magnetic field respectively. However, such materials are rare, since the electronic origins of spontaneous magnetic and electric dipolar orderings are generally mutually exclusive.2,6,7 Since Catalan putted forward that MC responses can exist in materials that are not necessarily multiferroic, it is accepted that Maxwell–Wagner (MW) space charge polarization combined with magnetoresistivity (MR) extrinsically contribute to the MC in heterogeneous structure materials,8 MC response aroused from MW and MR mutually has been found in varieties of transition metal oxides and their composites,9–15 such as SrxLa1−xTiO3/LaxSr1−xMnO3,16 La0.7Ca0.3MnO3/SrTiO3 (ref. 17) BaxSr1−xTiO3/LaxSr1−xMnO3,18,19 and PbxSr1−xTiO3/LaxSr1−xMnO3 (ref. 12) etc. The MR is defined as (RH − R0)/R0 × 100%, where RH and R0 are the resistances with and without magnetic field respectively. It is shown the positive MC is a typical feature of Catalan type contribution. Among them, SrxLa1−xTiO3/LaxSr1−xMnO3 give a massive MC up to 200% near 140 K, La0.7Ca0.3MnO3/SrTiO3 shows relatively large MC ∼20% near 225 K, BaxSr1−xTiO3/LaxSr1−xMnO3 and PbxSr1−xTiO3/LaxSr1−xMnO3 films have a little evident MC ∼ 5% near room temperature. The low values of MC near room temperature undoubtedly restrict the practical applications.Considering Catalan type contribution, large MC near room temperature can be achieved by obtaining large MR near room temperature. Enhanced MR over a wide temperature range have been found in La1−xAxMnO3 and their composites due to a close interplay among the spin, charge, and orbital (lattice) which have important and prominent intrinsic inhomogeneities.20–25 The polycrystalline La1−xAxMnO3 films have wider temperature range MR compared with those in epitaxial films for the existence of boundary effects and separated phases.21,23–26
In this paper, Pb0.6Sr0.4TiO3/La0.7Sr0.3MnO3/La0.7Ca0.3MnO3 (PST/LSMO/LCMO) polycrystalline film was grown on (100) Si substrate by chemical solution deposition (CSD) method to obtain large MC response over a wide temperature range. The PbxSr1−xTiO3/LaxSr1−xMnO3/LaxCa1−xMnO3 thin film was not discussed in the literature so far. Here, La0.7Sr0.3MnO3/La0.7Ca0.3MnO3 (LSMO/LCMO) was chosen as MR and electrode layer. LSMO and LCMO are ferromagnetic and present intrinsic MR around the Curie temperature Tc. The Tc of bulk LCMO (Tc ∼ 250 K) is much lower than that of bulk LSMO (Tc ∼ 360 K).23 LCMO bulk has very strong MR response and LSMO bulk has very low resistivity (ρ). Therefore, in LSMO/LCMO, there exist mixed phases of paramagnetic and insulator LCMO phase and ferromagnetic and metallic LSMO phase over a rather broad temperature range near room temperature. In LSMO/LCMO structure, the LCMO phase can work as the spacer of tunnel junction. Moreover, LSMO and LCMO have very similar lattice parameters, making them very attractive to make heterogeneous systems with interfaces of good quality. Assembling LSMO and LCMO together is expected to obtain large MR and low ρ over a wider temperature range near room temperature. Pb0.6Sr0.4TiO3 (PST) was chosen as dielectric layer for its excellent dielectric properties, whose lattice structure is simple and has only one phase transition, that is the ferroelectric–paraelectric phase transition, and the Tc is far above 400 K.27–29 Compared with pulsed laser deposition and sputtering, CSD has the advantages of excellent chemical homogeneity, easy control of stoichiometry, and suitable for large area.30–32 Si wafer was chosen as substrate because the Si wafer is one of the main micro-electronic materials, which is essential for future commercial applications.
Experimental
The films of PST/LSMO/LCMO, LSMO/LCMO, LSMO, LCMO were prepared on (100) Si substrate by CSD. The precursors were prepared by using (CH3COO)3La·1.5H2O, (CH3COO)2Sr·12H2O, (CH3COO)2Mn·4H2O, (CH3COO)2Ca·H2O, (CH3COO)2Pb·3H2O, (C4H6O)4Ti as starting materials, acetic and deionized water as solvent. The Si substrate was coated with LCMO, LSMO and PST layers in sequence. Every layer was deposited using spin coating and then dried, pyrolyzed, and followed by annealing respectively. PST (7 layers, 240 nm)/LSMO (5 layers, 76 nm)/LCMO (8 layers, 100 nm) film was achieved by repeating the spin-coating and heat-treating cycles. The drying temperature and pyrolysis temperature are 200 °C and 400 °C, respectively. The annealing temperature of LCMO and LSMO layers were 750 °C, while, that of PST layers was 650 °C.The structure and morphology of the films were characterized by conventional X-ray diffraction (CXRD) and grazing incidence X-ray diffraction technique (GIXRD: D/max-2550/PC, Rigaku, Tokyo, Japan). The cross-section morphologies of the PST/LSMO/LCMO/Si films were observed using scanning electron microscope (SEM, Magellan 400, FEI Company, Hillsboro, OR) and transmission Electron Microscopy (TEM, JEM-2100F, JEOL, Japan). The crystal structures and chemical compositions of the PST/LSMO/LCMO/Si film were analyzed by the selected area electron diffraction patterns and energy dispersive spectrometry (EDS) measurements.
The electric, dielectric, ferroelectric, magnetic, magnetotransport properties were measured with and without magnetic field by Physical Property Measurement System (PPMS-9, Quantum Design, USA), Precision LCR Meter (TH2827, Tong Hui, China) and a ferroelectric tester (Premier II, Radiant Technologies, USA). The magnetic field was perpendicular to the film surface. The dielectric and ferroelectric properties measurements were carried out on capacitor structures fabricated with Pt top electrode, which were sputtered through a photolithography. Standard four probe method was used to measure the resistances with Pt top electrode being sputtered on the surface of LSMO/LCMO films. The sample was cooled to 5 K in a zero magnetic field, and then a magnetic field of 500 Oe was applied in order to conduct the zero-field-cooled (ZFC) measurement. The measurements were conducted while the temperature of the sample was being increased from 5 K to 400 K. The field-cooled (FC) measurements of the magnetization were carried out in a magnetic field of 500 Oe while the temperature of the sample was being decreased from 400 K to 5 K.
Results and discussion
The structure of the composite films
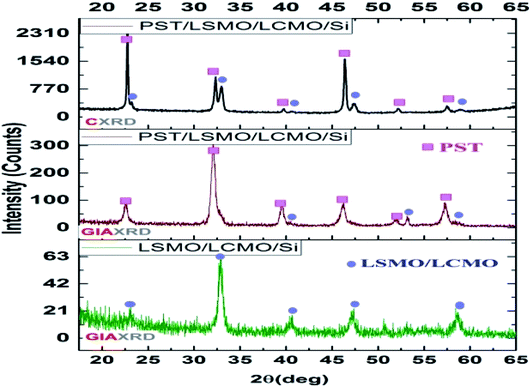
The conventional CXRD patterns and the GIAXRD of LSMO/LCMO/Si and PST/LSMO/LCMO/Si films (Fig. 1) proved that the LSMO/LCMO/Si and PST/LSMO/LCMO/Si crystallized perfectly into the perovskite phase with a random crystalline orientation and the lattices matched well. The peaks of PST hold together with those of LSMO/LCMO/Si. According to SEM and TEM images (Fig. 2a and b), the LCMO and LSMO polycrystalline show granular growth together, the interface matched well, there is no obvious interface boundary; the PST polycrystalline shows columnar growth. The EDS (Fig. 2c) line scanning from the surface of the film to the inside of the Si substrate shows that Pb, La, Mn and Ti elements diffuse across the interface of PST/LSMO, and Ti elements diffuses deeper to LCMO layer, and Sr and Ca elements diffuse mutually across the interface of LSMO/LCMO. Because there are no obvious heterogeneous phases in the CXRD and GIAXRD of the PST/LSMO/LCMO/Si film, there may exists continuous perovskite phases La0.7SrxCa0.3−xMnyTizO3 and Pb0.6−xLaySr0.4TizMnkO3 caused by the diffusion chemical elements near the interface LSMO/LCMO and PST/LSMO.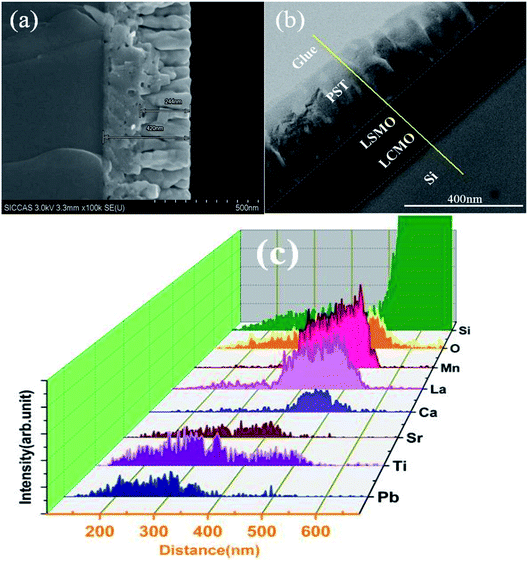 | ||
| Fig. 2 The microstructures and components of PST (240 nm)/LSMO (76 nm)/LCMO (100 nm)/Si film: (a) The SEM and (b) TEM image of the cross-sectional microstructure, (c) the EDS line scanning. | ||
| T | 5 K | 50 K | 100 K | 150 K | 200 K | 250 K | 300 K | 350 K | 400 K |
| MC (%) | 102.9 | 82.1 | 73.0 | 59.3 | 44.8 | 34.3 | 29.5 | 32.8 | 2.36 |
| ML (%) | −84.3 | −78.1 | −65.5 | −49.7 | −36.6 | −30.5 | −35.6 | −48.1 | −17.9 |
The electronic and magnetic transport properties in LSMO/LCMO films
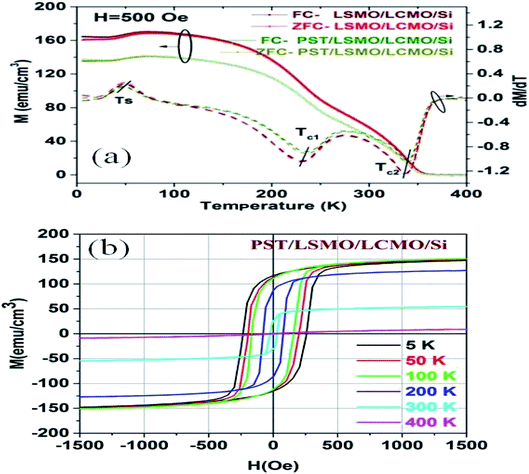
Fig. 3a shows the temperature dependences of the ZFC and FC magnetizations and the corresponding dM/dT in LSMO/LCMO/Si film and PST/LSMO/LCMO/Si film respectively. The temperature dependence of the ZFC and FC magnetization, and the corresponding dM/dT in LSMO/LCMO/Si film and PST/LSMO/LCMO/Si film have similar change trends, except the ZFC and FC magnetization is smaller than that of LSMO/LCMO/Si. There are three obvious intense phase transition zones near 49 K, 230 K and 338 K in the curves of temperature dependences of dM/dT in LSMO/LCMO/Si and 48 K, 235 K and 339 K in that of PST/LSMO/LCMO/Si film respectively. The ferromagnetic–paramagnetic phase transition temperatures (Tc) of LCMO and LSMO sublayers in LSMO/LCMO/Si are 230 K and 338 K are respectively; the Tc of LCMO and LSMO sublayers in PST/LSMO/LCMO/Si are shift to ∼235 K and ∼339 K. The decrease of magnetizations and maximum magnetic entropy change, the shift of phase transition temperatures in PST/LSMO/LCMO/Si mean that the magnetic orders are weakened which may be caused by the diffusion of elements or the strain from PST phase. Fig. 3b shows the magnetic hysteresis loops of PST/LSMO/LCMO/Si film measured at 5 K, 50 K, 100 K, 200 K, 300 K and 400 K. The saturation magnetizations match with the values in the curves of temperature dependence of magnetizations shown in Fig. 3a. From 100 K to 400 K, with the increase of the temperature, the magnetic order tends to disorder and the magnetization decreases gradually. Near 300 K, though ferromagnetic phases are still existent in PST/LSMO/LCMO/Si film, the magnetization has became very weak, the magnetostriction is small, the strain induced by magnetic field can be neglected. From 235 K to 339 K, the large, wide and successive amplitude of dM/dT means that there exist intense successive phase transitions which are come from the competing mixed phases of paramagnetic and insulator phase and ferromagnetic and metallic phase.In Fig. 3b, the coercive field increases with the temperature decrease from 100 K to 5 K, while the saturation magnetization increases slightly with the coercive field increase. The coercive field is the magnetic field strength required for magnetic spin reorientation. The nearly stagnant saturation magnetization means the existence of irreversible phase. In Fig. 3a, in the low temperature range, as temperature decreases, the ZFC and FC magnetization reach a maximum at ∼80 K and decreases afterward to a minimum at ∼49 K and tends to level off to 5 K. The ZFC magnetization is smaller than the FC magnetization. Such a behavior is the existence of cluster-spin-glass system. In the curve of T-dM/dT of PST/LSMO/LCMO/Si film, near 49 K, there exists a peak, is also a proof of the existence of cluster-spin-glass phase transition.
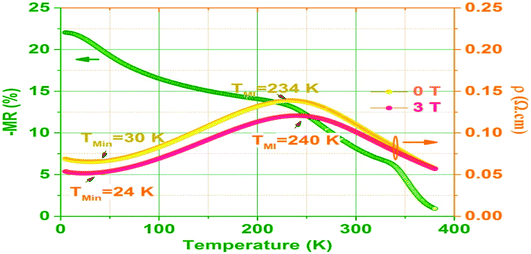
Fig. 4 shows the temperature dependences of the surface ρ of LSMO/LCMO/Si film in 0 T, 3 T and the corresponding MR. The plot of ρ versus T of LSMO/LCMO/Si film exhibits metal to insulator transition temperature TMI at 234 K and the maximum value of ρ occurs at this point for H = 0 T. Below TMI, the ρ falls quite sharply followed by metallic behavior and the ρ saturation is attained around TMin = 30 K, Kondo like temperature, where the ferromagnetic spin ordering starts to reduce and spin glass occurs as shown in Fig. 3a. The plot of ρ versus T in H = 3 T exhibits similar behavior but larger TMI occurred at 240 K, the maximum value of ρ is reduced from 0.1388 to 0.1207 Ω cm and TMin shifts from 30 K to 24 K. The applied magnetic field tends to align the local spin in cores and reduces the spin-dependent scattering of the polarized electrons at boundaries. The negative MR in LSMO/LCMO/Si film measured at 3 T is observed in a wide temperature range from 5 K to 380 K, and the amplitude decrease with the decrease of temperature. Above the Tc of LCMO (230 K) and LSMO (338 K), the paramagnetic phases of LCMO and LSMO occurred in the system are in polaron type conduction mechanism. The polaron is a complex of electrons in the conduction band of a crystal and the lattice distortion associated with it. Below the Tc of LCMO and LSMO, as temperature decreases, double exchange interaction becomes dominant and system starts to behave as a metal, the systems show much better magnetic ordering and magnetic moment as shown in Fig. 3. The MR regimes are dominated by inhomogeneities in the form of coexisting competing phases (Table 1).
| Ts (K) | Tc1 (K) | Tc2 (K) | |
|---|---|---|---|
| LSMO/LCMO | 49 | 230 | 338 |
| PST/LSMO/LCMO | 48 | 235 | 339 |
The magnetodielectric response in the composite films
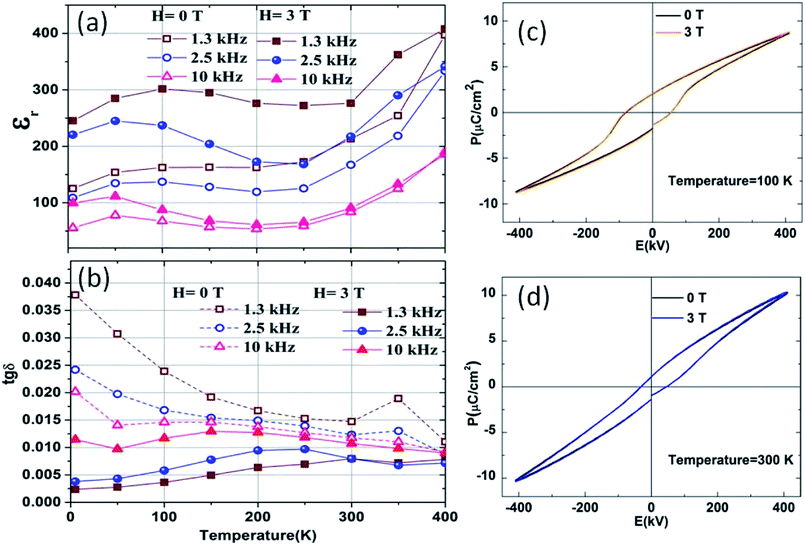
Fig. 5a and b show the temperature dependences of dielectric constant (εr) and dielectric loss (tan![[thin space (1/6-em)]](https://www.rsc.org/images/entities/char_2009.gif) δ) of PST/LSMO/LCMO/Si film. In 0 T, from 5 K to 400 K, as temperature increases, the εr increases and the tan
δ) of PST/LSMO/LCMO/Si film. In 0 T, from 5 K to 400 K, as temperature increases, the εr increases and the tan![[thin space (1/6-em)]](https://www.rsc.org/images/entities/char_2009.gif) δ decrease as a whole. In 3 T, the εr increase and tan
δ decrease as a whole. In 3 T, the εr increase and tan![[thin space (1/6-em)]](https://www.rsc.org/images/entities/char_2009.gif) δ decrease obviously compared those obtained in 0 T. According this trend, the ferroelectric–paraelectric phase transition temperature of the PST in this film is above 400 K. The ferroelectric hysteresis loops which directly show the ferroelectric behavior of the PST/LSMO/LCMO/Si film were measured at 1 kHz in dc bias magnetic field (0 T and 3 T). Well-defined hysteresis loops were clearly observed at 100 K and 300 K as shown in Fig. 5c and d. The remnant polarization and coercive field at 100 K are larger than those at 300 K, which are corresponding with the regulation of the temperature variation of the εr. However, as the applied magnetic field varies, the ferroelectric hysteresis loops show no obvious change and we can conclude that there is no distinguished magnetoelectric coupling effect in PST/LSMO/LCMO/Si film.
δ decrease obviously compared those obtained in 0 T. According this trend, the ferroelectric–paraelectric phase transition temperature of the PST in this film is above 400 K. The ferroelectric hysteresis loops which directly show the ferroelectric behavior of the PST/LSMO/LCMO/Si film were measured at 1 kHz in dc bias magnetic field (0 T and 3 T). Well-defined hysteresis loops were clearly observed at 100 K and 300 K as shown in Fig. 5c and d. The remnant polarization and coercive field at 100 K are larger than those at 300 K, which are corresponding with the regulation of the temperature variation of the εr. However, as the applied magnetic field varies, the ferroelectric hysteresis loops show no obvious change and we can conclude that there is no distinguished magnetoelectric coupling effect in PST/LSMO/LCMO/Si film.
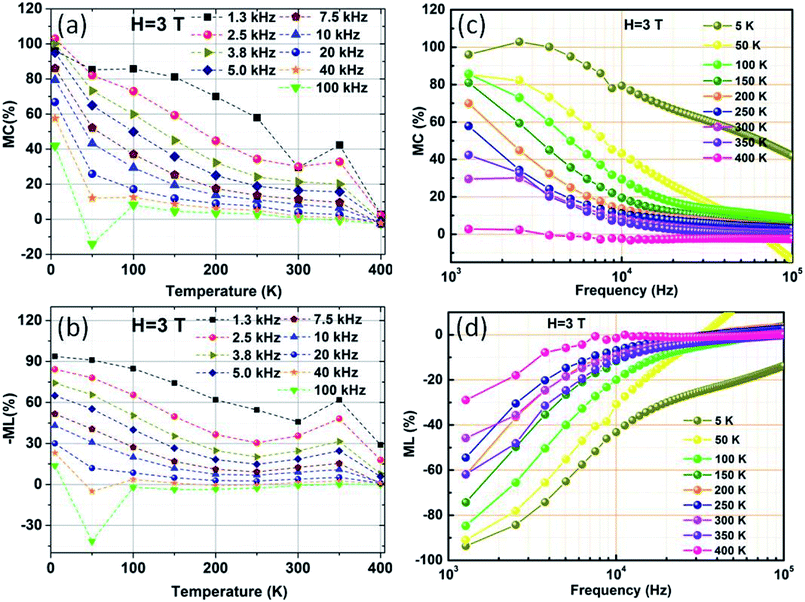
Fig. 6 shows the corresponding temperature and frequency dependences of MC and ML in 3 T respectively. The MC is the magnetocapacitance, defined as (CH − C0)/C0 × 100%; the ML is the magnetoloss, defined as (tan δH − tan δ0)/tan δ0 × 100%. From 1.3 kHz to 100 kHz, as frequency decreases, the MC increase. At 2.5 kHz, as temperature decreases, the corresponding MC increase from 2.36% (400 K) to 102.9% (5 K), the corresponding-ML increase on the whole (Table 2). The values of MC and ML measured at 2.5 kHz. Near room temperature, the MC values are 34.3% @ 250 K, 29.5% @ 300 K and 32.8% @ 350 K respectively.
From the magnetic hysteresis loops of PST/LSMO/LCMO/Si film (Fig. 3b) measured at 300 K, the ferroelectric hysteresis loops (Fig. 5d) measured at 1 kHz, in applied magnetic field (0 T, 3 T) at 300 K, we know the magnetic polarization is weak and there is no distinguished magnetoelectric coupling effect in PST/LSMO/LCMO/Si film. That is to say, the appearance of dielectric enhancement and frequency relaxation are correlated to the onset of Maxwell–Wagner (MW) behavior, they are artifacts of carrier migration. The MC response with applied magnetic field could be attributed to the MR effects originates from heterogeneity of the structure in PST/LSMO/LCMO/Si film. The structure can be described by an equivalent circuit comprising of two parallel RC circuits according the MW model.9 One associated to the LSMO/LCMO (Cl and Rl) and one attributed to the PST (Cp and Rp). The real and imaginary parts of its permittivity can be expressed in terms of eqn (1) and (2), where sub indices l and p refer to the LSMO/LCMO layer and PST layer, respectively, and R, C, and ω represent resistance, capacitance, and frequency, respectively. τl = ClRl, τp = CpRp, τ = (τlRp + τpRl)/(Rl + Rp), C0 = ε0A/t, A is the area of the capacitor, and t is the thickness.
 | (1) |
 | (2) |
![[thin space (1/6-em)]](https://www.rsc.org/images/entities/char_2009.gif) δ show obvious frequency relaxation, so, in the high frequency range, as frequency increases, the MC and -ML decrease rapidly. At polaron freezing temperature 5 K, the spin dependent disorder and scattering can be suppressed largely as an applied magnetic field is applied, so the MC is relatively insensitive to frequency and larger than those measured at other temperatures.
δ show obvious frequency relaxation, so, in the high frequency range, as frequency increases, the MC and -ML decrease rapidly. At polaron freezing temperature 5 K, the spin dependent disorder and scattering can be suppressed largely as an applied magnetic field is applied, so the MC is relatively insensitive to frequency and larger than those measured at other temperatures.
After inputting the permittivity, the resistance of PST/LSMO/LCMO/Si and LSMO/LCMO/Si at 1 kHz to eqn (1) and (2), the MC is found nearly equal to the MR. While the real value is several times of the theoretical value, and MC decreased more smoothly near room temperature, not like the MR in LSMO/LCMO/Si drops faster as temperature increase. Considering there is no distinguished magnetoelectric coupling effect in PST/LSMO/LCMO/Si film, and from 235 K to 339 K, there exist successive competing mixed phases of paramagnetic and insulator phase and ferromagnetic and metallic phase, the MC response must be produced by other favorable MR source except that of LSMO/LCMO/Si. The diffusion of Pb, Sr, Ca, Mn and Ti elements in the interface and core of PST/LSMO/LCMO/Si may enhance the MR response. Enhanced MR have been also obtained in LCMO and LSMO by ionic substitutions,33–36 which is attributed to the response of magnetic polarons to the applied magnetic field. The replacement of ions leads to lattice distortions. The role of the magnetic field is to enhance the hopping of the carriers between different lattice sites. Carriers' hopping between different lattice sites decreases the charge-depletion (high resistivity) width in applied magnetic field, reduces of the current barrier and gives rise to continuous junction MR. The homologous principles go in PST/LSMO/LCMO/Si film. The enhanced MR is not only residing in the successive diffused manganite phases, but spin dependent tunneling across the ferroelectric is possible, as is magnetic tuning of size of the depletion layers at the manganite–titanate junctions.37,38
Conclusions
We prepared LCMO/LSMO films by CSD method, studied the magneto electric transport mechanism and found that the LSMO/LCMO/Si film has the lowest ρ and obvious MR. Then, we grew PST/LSMO/LCMO/Si film, measured the structure, the magnetic, dielectric and ferroelectric properties in applied magnetic field. From 235 K to 339 K, there exist successive mixed phases of paramagnetic and insulator phase and ferromagnetic and metallic phase. The ferroelectric hysteresis loops show no obvious change in applied magnetic field. There is no distinguished magnetoelectric coupling effect. Notable MC were obtained over a large temperature range, at 2.5 kHz, it increases from 2.36% (@ 400 K) to 102.9% (@ 5 K). Near room temperature, the MC is 34.3% @ 250 K, 29.5% @ 300 K and 32.8% @ 350 K respectively. The mechanism can be explained in the light of the M–W model and the enhanced MR residing in the successive mixed manganite phases and spin dependent tunneling across the junctions of PST/LSMO/LCMO. It provides important guideline for designing and developing novel composite films with high MC in the future.Author contributions
All authors contributed to this work.Conflicts of interest
There are no conflicts to declare.Acknowledgements
This work were supported by the National Key Research and Development Program of China (Grant No. 2017YFB0701703), and International Partnership Program of Chinese Academy of Sciences (Grant No. GJHZ1821). We thank Prof. Yongling Wang of SICCAS for discussion.References
- J. F. Scott, J. Mater. Chem., 2012, 22, 4567–4574 RSC
.
- W. Eerenstein, N. D. Mathur and J. F. Scott, Nature, 2006, 442, 759–765 CrossRef CAS PubMed
.
- Y. Kitagawa, Y. Hiraoka, T. Honda, T. Ishikura, H. Nakamura and T. Kimura, Nat. Mater., 2010, 9, 797–802 CrossRef CAS PubMed
.
- G. Lawes, A. P. Ramirez, C. M. Varma and M. A. Subramanian, Phys. Rev. Lett., 2003, 91, 257208 CrossRef CAS PubMed
.
- Y. A. Zhao, Y. S. Rao, B. C. Luo, C. L. Chen, H. Xing, L. W. Niu, J. Y. Wang and K. X. Jin, J. Phys. Chem. C, 2016, 120, 22318–22322 CrossRef CAS
.
- M. Tarnaoui, N. Zaim, M. Kerouad and A. Zaim, Comput. Mater. Sci., 2020, 183, 109816 CrossRef CAS
.
- G. Singh, H. P. Bhasker, R. P. Yadav, S. K. Mandal, A. Kumar, B. Khan, A. Kumar and M. K. Singh, Phys. Scr., 2019, 94, 125805 CrossRef CAS
.
- J. Gebhardt and A. M. Rappe, Phys. Rev. B, 2018, 98, 125202 CrossRef CAS
.
- G. Catalan, Appl. Phys. Lett., 2006, 88, 102902 CrossRef
.
- D. Y. Zhou, R. Takahashi, Y. Y. Zhou, D. Kim, V. K. Suresh, Y. H. Chu, Q. He, P. Munroe, M. Lippmaa, J. Seidel and N. Valanoor, Adv. Electron. Mater., 2017, 3, 1600295 CrossRef
.
- S. Pachari, S. K. Pratihar and B. B. Nayak, J. Alloys Compd., 2019, 784, 897–905 CrossRef CAS
.
- Y. Chen, G. S. Wang, S. A. Zhang, X. Y. Lei, J. Y. Zhu, X. D. Tang, Y. L. Wang and X. L. Dong, Appl. Phys. Lett., 2011, 98, 1600295 Search PubMed
.
- J. P. Palakkal, C. R. Sankar, A. P. Paulose, M. Valant, A. Badasyan and M. R. Varma, Mater. Res. Bull., 2018, 100, 226–233 CrossRef CAS
.
- H. J. Shin, N. Lee and Y. J. Choi, J. Alloys Compd., 2019, 785, 1166–1172 CrossRef CAS
.
- H. Taniguchi, H. Takahashi, A. Terui, K. Sadamitsu, Y. Sato, M. Ito, K. Nonaka, S. Kobayashi, M. Matsukawa, R. Suryanarayanan, N. Sasaki, S. Yamaguchi and T. Watanabe, J. Appl. Phys., 2020, 127, 184105 CrossRef CAS
.
- R. Schmidt, J. Garcia-Barriocanal, M. Varela, M. Garcia-Hernandez, C. Leon and J. Santamaria, Phys. Status Solidi A, 2016, 213, 2243–2253 CrossRef CAS
.
- X. N. Fu, Q. X. Yu, Q. Q. Gao and B. Chen, J. Appl. Phys., 2012, 111, 013907 CrossRef
.
- A. Tarale, Y. D. Kolekar, V. L. Mathe, S. B. Kulkarni, V. R. Reddy and P. Joshi, Electron. Mater. Lett., 2012, 8, 381–385 CrossRef CAS
.
- A. N. Tarale, P. B. Joshi, S. B. Kulkarni, V. R. Reddy, M. Gupta, R. C. Pawar and C. S. Lee, J. Sol-Gel Sci. Technol., 2014, 70, 346–354 CrossRef CAS
.
- P. R. Mandal and T. K. Nath, J. Appl. Phys., 2017, 121, 164101 CrossRef
.
- Y. Zhang, W. Dong, R. Qi, R. Huang, J. Yang, W. Bai, N. Zhong, Y. Chen, G. Wang, X. Dong and X. Tang, J. Sol-Gel Sci. Technol., 2016, 78, 576–581 CrossRef CAS
.
- Y. Hou, Q. X. Yu, Y. P. Yao, X. H. Huang, S. N. Dong, Y. Chen and X. G. Li, Ferroelectrics, 2010, 409, 196–203 CrossRef CAS
.
- M. Sirena, N. Haberkorn, L. B. Steren and J. Guimpel, J. Appl. Phys., 2003, 93, 6177–6181 CrossRef CAS
.
- D. Liu and W. Liu, Ceram. Int., 2012, 38, 2579–2581 CrossRef CAS
.
- M. Jain, Y. Li, M. F. Hundley, M. Hawley, B. Maiorov, I. H. Campbell, L. Civale and Q. X. Jia, Appl. Phys. Lett., 2006, 88, 232510 CrossRef
.
- P. K. Muduli, G. Singh, R. Sharma and R. C. Budhani, J. Appl. Phys., 2009, 105, 113910 CrossRef
.
- B. S. Blagoev, T. C. Nurgaliev, I. E. Bineva, E. D. Vasileva, V. Štrbik and E. S. Mateev, Mod. Phys. Lett. B, 2014, 28, 1450096 CrossRef
.
- H. C. Pan, J. N. Sheng, C. C. Chou and H. F. Cheng, Integr. Ferroelectr., 2002, 46, 175–184 CrossRef CAS
.
- H. Y. Chen, J. M. Wu, H. E. Huang and H. Y. Bor, J. Cryst. Growth, 2007, 308, 213–217 CrossRef CAS
.
- S. Nandy and C. Sudakar, J. Appl. Phys., 2019, 126, 135303 CrossRef
.
- J. Jeon and K. H. Kim, Thin Solid Films, 2020, 701, 137940 CrossRef CAS
.
- J. M. Vila-Fungueirino, J. Gazquez, C. Magen, G. Saint-Girons, R. Bachelet and A. Carretero-Genevrier, Sci. Technol. Adv. Mater., 2018, 19, 702–710 CrossRef CAS
.
- B. Das and P. Padhan, Appl. Phys. Lett., 2019, 115, 222401 CrossRef
.
- J. M. DeTeresa, M. R. Ibarra, P. A. Algarabel, C. Ritter, C. Marquina, J. Blasco, J. Garcia, A. delMoral and Z. Arnold, Nature, 1997, 386, 256–259 CrossRef
.
- X. H. Yu, T. Sun, Q. M. Chen, Y. B. Duan and X. Liu, J. Sol-Gel Sci. Technol., 2019, 90, 221–229 CrossRef CAS
.
- A. Dhahri, M. Jemmali, E. Dhahri and E. K. Hlil, Dalton Trans., 2015, 44, 5620–5627 RSC
.
- N. Nakagawa, M. Asai, Y. Mukunoki, T. Susaki and H. Y. Hwang, Appl. Phys. Lett., 2005, 86, 082504 CrossRef
.
- J. Pawlak, A. Zywczak, G. Szwachta, J. Kanak, M. Gajewska and M. Przybylski, Acta Phys. Pol., A, 2018, 133, 548–551 CrossRef CAS
.
| This journal is © The Royal Society of Chemistry 2021 |

