 Open Access Article
Exploring the effects of approach velocity on depletion force and coalescence in oil-in-water emulsions
Ola Aarøen*a,
Enrico Riccardibc and
Marit Sletmoen a
a
aDepartment of Biotechnology and Food Science, Norwegian University of Science and Technology, Høgskoleringen 5, 7491 Trondheim, Norway. E-mail: ola.aaroen@ntnu.no
bDepartment of Chemistry, Norwegian University of Science and Technology, Høgskoleringen 5, 7491 Trondheim, Norway
cDepartment of Informatics, UiO, Gaustadalléen 23B, 0373 Oslo, Norway
First published on 25th February 2021
Abstract
An emulsion is a thermodynamically unstable system consisting of at least two immiscible liquid phases, one of which is dispersed in the other in the form of droplets of varying size. Most studies on emulsions have focused on the behaviour of emulsion droplets with diameter from ∼50 μm and upwards. However, the properties of smaller droplets may be highly relevant in order to understand the behaviour of emulsions, including their performance in numerous applications within the fields of food, industry, and medical science. The relatively long life-time and small size of these droplets compared to other emulsion droplets, make them suited for optical trapping and micromanipulation technologies. Optical tweezers have previously shown potential in the study of stabilized emulsions. Here we employ optical tweezers to examine unstable oil-in-water emulsions to determine the effects of system parameters on depletion force and coalescence times.
Introduction
Emulsions play an important role in a wide range of fields, with applications from oil processing and recovery,1 to the food industry,2,3 and pharmaceutical manufacture.4 Emulsions arise from the forced mix of immiscible liquids in a multiphase system, by breaking one or more liquids into smaller droplets dispersed in a bulk phase. Their types and classifications vary, dependant on composition, use, and stability. Nomenclature generalizes them as O/W for an non-polar liquid (i.e. oil) dispersed in a polar (i.e. water) phase, or in the opposite case W/O. Recently, a series of more complex emulsions have been developed. One of these is double emulsions, also called multiple emulsions, and the properties of these emulation, including preparation methods5 and stabilisation6 have been reviewed. Widely used in the food industry, their thermodynamic instability, resulting in gradual separation into two pure phases, is the main challenge for product shelf-life demands. Different mechanisms for phase-separation exist but they can be categorized into the following main groups:(1) Sedimentation/creaming due to gravitational forces and difference in phase densities.
(2) Flocculation/aggregation due to low range attractive droplet–droplet interactions.
(3) Diffusion and re-precipitation over interfaces, know as Ostwald ripening.
(4) Coalescence, where droplets or bubbles of the dispersed phases merge, usually aided by mechanism (1) and (2).
Measures can be taken to reduce the rate of separation of emulsions, by addition of stabilizing agents to counteract some of the mechanisms driving separation. These emulsifiers, or surfactants, stabilize the dispersed phase by reducing the interfacial tension over the oil–water interface, and form a layer of adsorbed molecules that prevent aggregation of droplets and subsequent coalescence. Conversely, clarifying agents, or flocculants, reduce emulsion stability by inducing droplet flocculation to separate liquid phases.
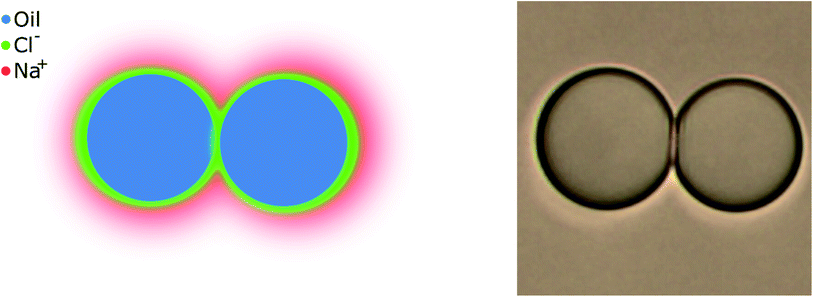
Even with no stabilizing agents present, OH− ions originating from water autoprotolysis or ionic additions to solution adsorbs to the oil–water interface, forming a negatively charged layer.7 Subsequently, a positively charged layer forms, surrounding the negative, forming a double layer on the interface, as illustrated in Fig. 1 (with Na+ and Cl− ions). This electrical double layer will result in a repulsive force between neighbouring droplets, reducing droplet contact and stabilizing the emulsion even in the absence of surfactant. The double layer extent is given by the distance from the interface to a point away from interface, where the charge density is equal to that of the bulk solution. The theoretical extent of this layer, κ−1, from the droplet interface is given by
 | (1) |
 , with ci being the concentration of ions and zi the charge. Increasing the overall ionic strength in bulk solution can reduce the distance κ−1. Table 1 presents the results obtained when using eqn (1) to calculate the double layer extents as a function of the ionic strength of the surrounding solution. In pure water emulsions (at 25 °C) an ionic concentration equal to 10−7 mol L−1 is assumed due to the autoprotolysis in water. When adding ions (NaCl) to concentrations equal to or exceeding 0.1 mol L−1, this contribution from the autoprotolysis of water to the total ionic strength becomes negligible. Reducing the repulsive force originating from the electrical double layer is expected to lead to increased probability for spontaneous coalesce between emulsion droplets when brought to proximity. Temperature effects would also change droplet coalescence time, as increased thermal energy has been shown to decrease the interfacial tension in bulk crude oil,8 and reduce coalescence time in micromanipulated droplets,9 although for the small size ranges of the latter, temperature control has proved to be inaccurate.
| Ions | Concentration [mol L−1] | κ−1 [nm] |
|---|---|---|
| H+ OH− | 10−7 | 960.28 |
| Na+ Cl− | 0.01 | 3.04 |
| 0.1 | 0.96 | |
| 1.0 | 0.30 |
This de-stabilization of emulsions have become important especially within the petroleum industry, where wastewater bi-product from drilling contains a variety of petroemulsions. These emulsions consist of a mix of polar crude oil components, polar hydrocarbons (“resins”) and polyaromatic hydrocarbons (“asphaltenes”), which can form surfactant layers that are considered to be primarily responsible for their stability and behaviour.10–12
The performance of transport and separation processes involving petroemulsions is affected by the dynamics of coalescence between droplets.10,11,13 Dynamics of coalescence are controlled by the drainage and eventual rupture of the thin liquid film13 that develops between approaching droplets. Thin film drainage times and film rupture behavior depend on the intermolecular forces between the molecules present at the interfaces. Solvent molecules interacting with surfactants and interfaces determine the behaviour of the thin film formed between the two interface regions encircling two approaching droplets.
It is preferable both due to environmental concerns, and commercial ones, to separate petroemulsions into the constituent phases prior to wastewater release.14–16 This has led to the development of (green) enhanced oil recovery ((G)EOR) techniques, which are based on the injection of specific green chemicals (surfactants,17,18 polymers or particles,1 gas,19 etc.) that effectively displace oil because of their phase-behavior properties, which decrease the interfacial tension (IFT) between the displacing liquid and the oil.
During the past decade, extensive experimental campaigns and modelling efforts have been undertaken to characterize the rheological, thermodynamic, and structural properties of interfacial layers composed of resin and asphaltene surfactants. Experimentally, crude oils containing a myriad of indigenous resin and asphaltenes have been studied.10 In computational studies, the interface induces limitation in the molecular simulation predictions. Firstly, common force fields are developed assuming an homogeneous environment (bulk).20,21 Thereafter, surfactants coming from oil sources are composed by a wide distribution of different amphiphilic molecules. Model oils employing complex synthetic (and synthesizable) surfactants22 have been employed23,24 to successfully, but approximately describe the interface region under different ionic conditions.
The current theoretical models for film drainage during coalescence focus primarily on systems employing relatively simple descriptions of surfactant behaviors. These systems are based on London dispersion forces in the case of oil continuous emulsions and Derjaguin, Landau, Verwey and Overbeek (DLVO) theory for water continuous emulsions. Despite the studies trying to unify the macroscopic behavior and the underlying molecular mechanisms,25,26 a comprehensive understanding is still lacking.
Recent investigations have shown the importance of describing the structural and conformational rearrangements at molecular level.27,28 These structural rearrangements occur in the inter-phase region as a result of altered conditions (surfactant concentration and type, ionic strength and type) in the thin film generated between two drops. As a result, the current continuous models have a limited validity in predicting the overall system behavior by adopting a simplistic description of the disjoining pressure and film rupture mechanisms. In emulsions, and in particular in petroemulsions, there is a lack of agreement between the mechanisms considered in state-of-the-art models for film drainage during coalescence13,29 and the mechanisms responsible for the stability behavior of petroemulsions that have been suggested by experimental studies.10,30
As explained above and also recently stated by Langevin31 coalescence in emulsions and foams is far from being understood, despite many years of investigations. In addition to the properties described above, also other inherent properties of the coalescence process may explain the still unsatisfactory understanding of this phenomenon. The coalescence process is characterized by being extremely rapid. Furthermore, the rupture of the thin films separating the droplets or bubbles prior to coalescence is influenced by several properties of the system, including hydrodynamics, surface rheology, surface forces, and thermal fluctuations. The rapidness of the coalescence event as well as its dependence on a high number of factors makes experimental studies challenging. Experimental challenges may also explain why most previous studies have focused on oil droplets in the size range of 20–200 μm. The lack of attention to the smaller droplets is problematic since the emulsion droplets found in many applications have a diameter below 10 μm, and these small droplets are known to show a behavior that deviate from this of the larger droplets, both related to deformation, internal pressure and hydrodynamic effects.32 Filling this gap and providing information on the properties of the small droplets is therefore important.
During the past decades, new methods have been developed that trap small particles and even single molecules while at the same time applying and measuring forces acting on them. Among these, atomic force microscopes, optical tweezers, and magnetic tweezers have enabled the study of a wide range of molecular processes in which force plays a crucial role.33 These tools have also been continuously refined in order to offer frequent improvements in spatial and temporal resolution. These tools are therefore today recognized as interesting tools when addressing questions related to a wide variety of processes, including droplet coalescence, as further explained in the following.
The manipulation of microparticles with light was first demonstrated by Ashkin.34 His experiments revealed that radiation pressure originating from a beam of light would impart momentum to particles and thus push them in the direction of light propagation. He later showed that by introducing an additional force counteracting the force acting in the propagation direction of the light, the particle can be trapped in a small volume in space.35 This is referred to as an optical trap and can be described as a simple harmonic oscillator potential,36 within which a particle can diffuse by Brownian motion.37 An optical trap can be created by the use of a laser and a lens creating a tightly focused laser beam. While optical trapping can be used simply to position particles, the method is also often used to quantified forces on microscopic length scales. Optical tweezers set-ups can be used to exert forces in excess of 100 pN on particles ranging in size from nanometers to micrometers while simultaneously measuring the three-dimensional displacement of the trapped particle with sub-nanometer accuracy and sub-millisecond time resolution. The forces are determined by either a sensitive photodiode or a high-speed camera that reports the displacement of a particle from the center of an optical trap of known spring constant. The spring constant is usually obtained from studying the restriction of the Brownian motion of the particle.38
Optical tweezers have been used in a range of research fields,39 but despite the obvious potential of optical tweezers to provide new insight into the coalescence process of microdroplets, the number of studies published in this field is still limited. In 2006, Ward and coworkers published a study40 demonstrating the deformation of micron-sized emulsion droplets having ultralow interfacial tensions, by optical tweezers. A few years later, Bauer and coworkers trapped one emulsion droplet in each of two optical traps and quantified the pH dependent interactions between the individual emulsion droplets.41 A similar approach was used by Nilsen-Nygård and coworkers42 who obtained force versus distance curves of emulsion droplets of both micro- and macromolecular stabilization. These studies were followed by publications from Chen and coworkers. In their first study they reported the interaction forces between tetradecane droplets with a diameter equal to 5.0 μm in water, as a function of varying SDS and NaCl concentration.43 In the following paper they turned to oil droplets stabilized by a non-ionic surfactant44 before focusing on a system of switchable surface-active colloid particles.45 Otazo and coworkers performed studies with a different aim. They focused on the aggregation and coalescence of partially crystalline emulsion droplets.46 In the current paper we use a dual trap optical tweezers set-up to investigate the effects of approach velocity on depletion forces and coalescence times47 in an oil-in-water emulsion.
Experimental
Materials
Emulsions were made using dodecane oil, C12H26 (Sigma-Aldrich, St. Louis, USA) in de-ionized water (MilliQ, <18 Ω). The ionic strength of the emulsions was regulated by adding small volumes of a solution of high ionic strength. This solution was made by dissolving NaCl (Sigma-Aldrich, St. Louis, USA) in de-ionized water.Preparation of O/W emulsions
The O/W emulsions were made using the following three alternative methods: the first method was based on the use of a microfluidic cell. In order to produce emulsions with droplet sizes in a suitable range, a cross-junction48 cell with channel width (nozzle) of 15 μm was fabricated using soft lithography. A second method explored was based on the use of an Ultra Turrax homogenizer (IKA, Straufen, Germany). This is a mechanical stirrer, and in the current project it was operated at 3000 rpm for 5 minutes. The last method explored for the fabrication of emulsions included a simplified homogenization method based on mixing the materials in an Eppendorf tube and shaking for 3 minutes on a variable speed vortex mixer (Fisher Scientific, Pittsburg, US) at 2000 rpm.In order to promote droplet coalescence in the OT sample chamber, the ionic strength of the emulsion solutions were increased prior to the measurements. Immediately after emulsification, small volumes of 1 mol L−1 NaCl solution was added to the sample in order to increase the ionic concentrations to pre-defined values (0.05, 0.1 and 0.15 M). These emulsions were transferred to fluid cells, made as described below, which were immediately mounted in the microscope set up.
Fluid cells were made with a circular Borax glass (35 mm, thickness no. 1, VWR, Pennsylvania, US) and a rectangular cover glass (22 × 50 mm, thickness no. 1, VWR, Pennsylvania, US), separated by two layers of double sided tape or melted parafilm. The spacing between the rectangular pieces of tape or parafilm was in the range 0.5–1.0 cm. This lead to sample cells having an internal height of 100–200 μm, and a total sample volume of 20–30 μL. After filling, cells were sealed with nail polish.
Optical tweezers instrumentation
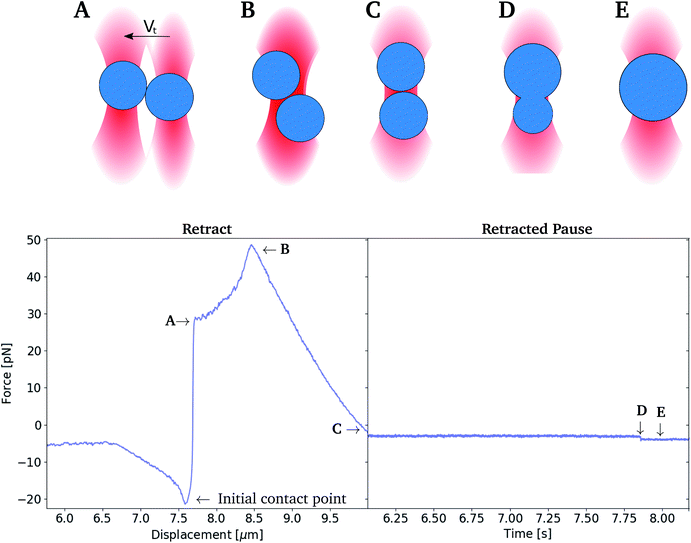
The OT instrument used was the NanoTrackerTM 2 optical tweezers instrument (JPK Instruments, Berlin, Germany) mounted on a Zeiss Axio Observer Inverted optical microscope. The instrument is equipped with a TEM00 laser with 3 W maximum power and option of a dual beam mode with scalable split-ratio. The laser has a Gaussian beam profile and the two traps can be controlled independently of each other. A quadrant photodiode placed at the back-focal plane of the condenser detects the displacement of the trapped beads. The emulsion solutions were diluted in order to obtain a suitable density of droplets in the sample chamber. The probability of an additional droplet being trapped in the optical trap increases with increasing droplet density, and the droplet density should therefore be kept low. However, the probability of trapping a droplet with suitable size increases with droplet density. The droplet density chosen was a compromise between these two restrictions. Prior to all measurements, one droplet was trapped in each of the two optical traps. The trap stiffness of each trap was calibrated from power spectra obtained by tracking the 3D Brownian motion of the beads.The approach velocity of the optical trap holding an emulsion droplet was controlled. In experimental series aiming at determining the depletion force, the droplets were brought into contact and were then maintained in contact for a duration of 1 second before retracting one of the droplets, as shown in Fig. 1. The forces acting on the trapped droplets were recorded throughout both approach, pause and retract periods. In experimental series aiming at determining coalescence times, the two droplets were left in contact for a duration of 20 seconds prior to retraction.
Determination of depletion forces
Experiments were performed in order to determine the depletion force acting between oil droplets upon their separation. When performing these experiments, the two optical traps were initially positioned at known separation distance, and set to approach each other at fixed velocity until the surfaces of the two trapped droplets were in contact. The traps where then kept at this position for 1 second. Thereafter, the two traps were moved apart, while continuously recording the forces acting on each of the two droplets, including attractive depletion forces. The recorded forces were plotted as a function of droplet separation distance, giving force versus distance curves. As part of the data processing, the retract curve was smoothed using a Savitzky–Golay filter (bins: 200, order: 3), and subtracted from the unsmoothed extend curve, giving the difference between the forces acting on the droplets during approach as compared to retract.Determination of coalescence times
In the current work the coalescence time, tcoales, was defined as the time period from the first encounter between the two oil droplets until their rupture. It was determined by bringing two droplets into contact and leaving them in contact for an extended period of time while recording the force acting on the droplets. The two droplets were approached until a point where the two optical traps fully overlapped. This procedure was chosen in order to avoid the consequences of the uncertainty in droplet size, and thus inter-droplet distance and contact point. The tcoales was determined with a sampling rate of 50 kHz. When analysing the force–time plots using this procedure (Fig. 3), accurate coalescence times were obtained.Correction for drag force experienced by moving droplets
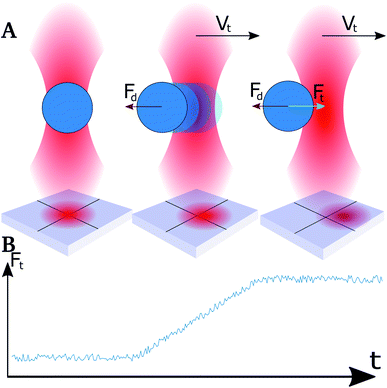
When moving the optical traps at high speed, the trapped particles were observed to lag behind the trap center.49 This lag is caused by a drag force that acts on the droplet when it moves through a viscous medium. The strength of the drag force will depend on the velocity of the droplet as well as its size, and the viscosity of the bulk liquid.50 At relatively high displacement speeds, in the order of 0.1 mm s−1 and exceeding, trapped droplets did not stabilize in a shifted position with respect to the focal point of the optical trapping beam within the time spent approaching neighbouring droplets. The Hookean nature of the traps, and the instantaneous acceleration, made droplets shift out of the trap due to the drag force acting in the opposite direction of the trap movement (Fig. 2A). This resulted in a linear rise in force (Fig. 2B) and not a plateau as expected.51 By normalizing the retract curve to the linear increase, and shift the curve to the height at the end of the segment, a plateau was obtained which could be used as a basis for the determination of the force difference during retract–extend schemes. The difference in force between the normalized retract and extend curves was used as a measure of the forces acting between the two droplets on extension, including the attractive interaction depletion force.Results and discussion
Evaluation of alternative emulsion preparation procedures
When studying emulsions using optical tweezers it is essential to obtain emulsions containing droplets of a size that can be trapped by the optical traps. Ideally, the distribution of droplet sizes should also not change between subsequent sample preparations.The microfluidic method promised droplets with a pre-defined and reproducible size range as well as a narrow size distribution. However, in the absence of a stabilizing agent, emulsion droplets would coalesce immediately past the cell nozzle. This resulted in droplet populations characterised by a wide spread in diameters, with only a small subpopulation remaining within the wanted range by the time of measurements. Additionally, the microfluidic procedure for producing emulsions was time-consuming. The preparation of 1 ml of sample required several hours. The microfluidics based preparation approach was therefore not used in the later experiments.
Emulsions prepared using an Ultra-Turrax were observed to contain droplets ranging in size from sub micrometer to >100 μm. Compared to the microfluidic set-up, this procedure provided emulsions with higher droplet density. The samples contained droplets within the range suitable for optical trapping (1–30 μm). However, the inherent low stability of the droplets lead to a need for re-homogenization with the stirrer between every experiment. The relatively large volume required (50 ml and upwards) to use the stirrer necessitates access to the chemicals in relatively high quantities compared to what is the requirement in other approaches.
To minimize the time used on sample preparation, while keeping the droplet diameter within the aimed range, a simplified homogenization method was developed. This method is described in the methods section and involved mixing the materials in an Eppendorf tube by vortexing. This approach provided emulsions characterised by a wide range of droplet diameters, ranging from ≈1 μm to well above the limit of optical traps. However, larger droplets would float to the top of the tube, leaving a solution in the mid-tube area containing droplets in the 1–10 μm range. Small volumes of this emulsion were removed by a syringe and used for the OT experiments. This approach did provide emulsions containing droplets of size and stability that was ideal for the intended studies.
Ionic strength effects on depletion force
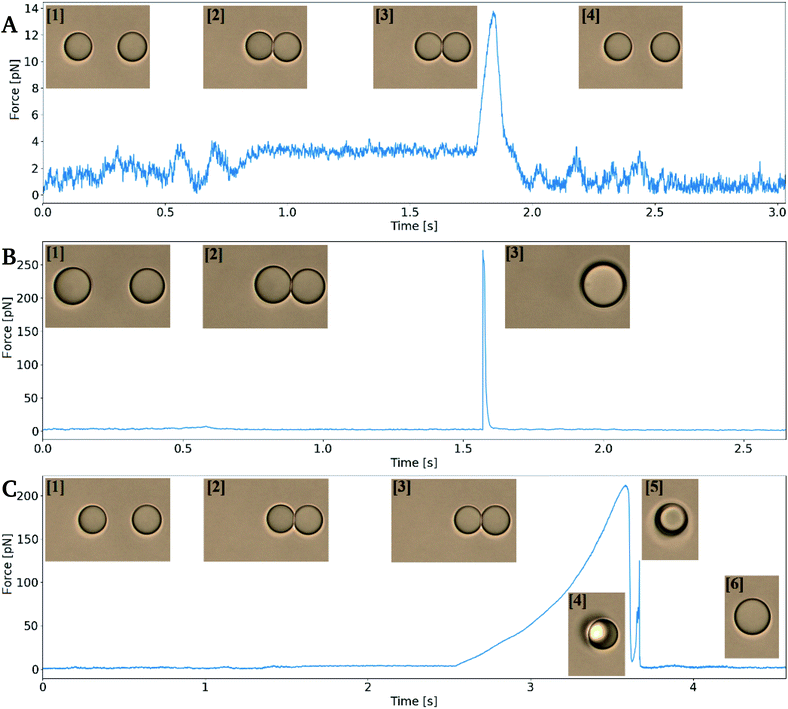
In order to measure depletion force, two droplets were moved into close contact in order to obtain a contact region between the two interfaces. The droplet contact point was determined visually based on light microscopy based imaging of the droplet pairs. However, the resolution of the light microscope entails an uncertainty in the determination of the contact point, and thus also the depletion force. In case of an un-sufficient contact between the droplets, depletion will not be observed. On the other hand, pressing droplets together with excessive force could result in coalescence (Fig. 4B) or it could cause droplet to stick to each other (flocculate) and thus escape traps on extend, rather than separate (Fig. 4C) to later coalesce.The depletion force between pairs of droplets was measured using the experimental approach detailed in previous sections. The approach and retract curves were compared by smoothing the retract curve with a moving average and subtracting the extend force curve. This resulted in a flat curve containing a peak reflecting the attractive force acting on the droplets upon their separation. The area under this peak gave the work needed to separate droplet pairs, i.e. the depletion work, J.
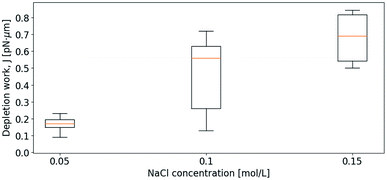
Initially, the depletion force was determined for the separation of pairs of relatively small droplets in varying bulk solutions containing NaCl. Fig. 5 shows how J increases with increasing ion concentration. Despite a variation in droplet sizes as well as a variation in approach velocity (1–2 μm s−1), the effect of the ionic strength of the solution is visible. More precisely, the increased ion concentration in bulk, leading to increased difference in ion concentration between bulk and thin film, resulted in increased depletion force and work. The small values of the work needed to separate the droplet pairs shown in Fig. 5 are partly explained by the low retract–extend velocities. As previously pointed out in a theory describing the influence of external force on the dissociation of non-covalent bonds, bond survival time depends on how fast the force is applied and the expected survival time specifies the most likely breakage force (strength) at a given loading rate (force/time).52 In line with this previously developed theory, when moving traps at low speed, charge differences between bulk and thin film have time to equilibrate due to thermodynamically driven movements of charges in solution, reducing the attractive force felt when separating the droplets.
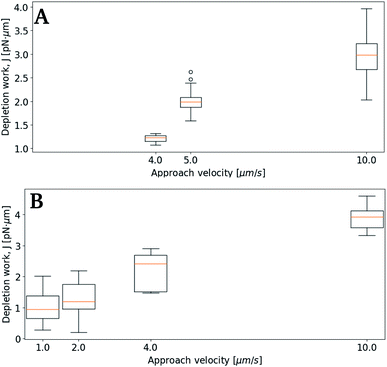
In a subsequent set of experiments, the depletion work associated with droplet pair separation was quantified for higher droplet approach velocity, keeping the ionic strength of the surrounding solution fixed. As for the previous experiments, the droplet pairs consisted of two droplets of similar droplet diameter. Fig. 6 presents the increase in J at increased approach velocity, at a ionic strength of 0.05 mol L−1 (A) or 0.15 mol L−1 (B), respectively. At the lowest ionic concentration investigated, 0.05 mol L−1, the work J is, at an approach velocity of 4 μm s−1, at the same level (∼1 pN nm) as observed for slower approaches at higher ion concentration. Measurements performed using lower velocity were not included due to the low depletion force (in A), that hindered a reliable determination of the depletion work.
Effect of droplet velocity on depletion force
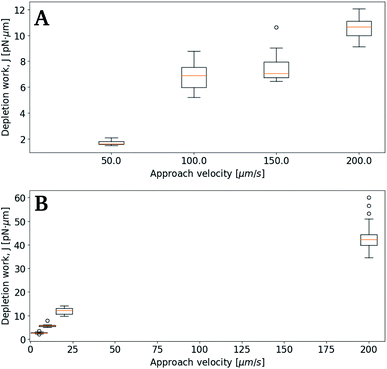
Subsequent experimental series focused on the effect of the approach velocity on the depletion work. The experiments were performed using a concentration of NaCl in the solution surrounding the oil droplets equal to 0.1 mol L−1. Care was taken to minimize the size difference between the two trapped droplets. The higher velocities used induced a drag force on the trapped droplets. In order to secure that the final processed curves gave correct estimation of the depletion work, the drag force was accounted for and removed from the original force curve using the procedure described in the Materials and methods section. Fig. 7 presents the distribution of the work J, observed when separating two droplets, as a function of the droplet displacement velocity, for approach velocities up to 200 μm s−1. The droplet diameters were determined for each droplet, and based on this information the droplet pairs were divided into two different size ranges; (A) 3–4 μm and (B) 8–9 μm (Fig. 7). The data presented show that, as for the lower droplet displacement velocities (Fig. 6), the work increases with increasing droplet velocity. However, while the results obtained for the droplets characterized by the largest diameters investigated (B) show a positive correlation between depletion work and droplet velocity throughout the interval of droplet velocities studied, the increase is not linear. At low velocities the results show a steeper rise in the depletion work with increasing approach velocity than what is observed at higher velocities. This behaviour may be fully or in part explained by the drag force and the resulting displacement of the droplet in the optical trap. The drag force complicates the determination of the depletion work and thus makes the force measurements using parameter settings where the drag force was important, unreliable.Effect of droplet size on depletion force
The results obtained in the current paper revealed that at fixed approach velocity of 10 μm s−1, the depletion force and work J increases with increasing droplet size (Fig. 8). This observation is in agreement with previous OT observations on related emulsions.42 However, droplets with deq of 12.7 and 14.7 showed similar work of separation as was observed for the droplets with deq of 10.8 μm. One reason for the unexpected low J recorded may be a fault in achieving proper contact between droplets. In planning the contact point the diameter of the droplets is visually estimated, avoiding coalescence by not over-extending trap movement. Oil droplets of diameter exceeding ∼20 μm were not included in the study since, for oil droplets of this size, droplet buoyancy force overcame the trapping force, causing droplets to escape the traps.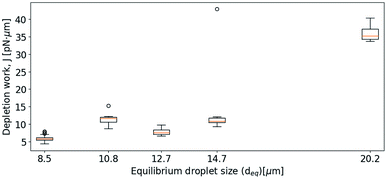 | ||
| Fig. 8 Boxplots showing depletion work J against equilibrium droplet size, deq, approaching at 10 μm s−1, in 0.1 mol L−1 NaCl concentration. | ||
Characterisation of factors affecting the coalescence times
The coalescence time was determined both as a function of droplet size and droplet velocity. Droplets were brought to fully overlap along the z-axis in order to make sure they were in contact, as illustrated in Fig. 3. Also, as the goal was to determine the coalescence time, any uncertainty in droplet size that would influence calibration and force measurements were irrelevant. While this scheme gave accurate times of contact and of coalescence, it did however make repeated study of the same droplet pair impossible. With the emulsion being as unstable as chosen, droplets would either coalesce, remain connected unable to separate, or be ejected and lost from the traps.Attempts to determine coalescence times using the retract–overlap scheme described above were performed at a fixed NaCl concentration of 0.1 mol L−1. When using this ion concentration emulsion droplets could be obtained by vigorous shaking of the sample tube, and a fraction of the droplets constituting the dispersed phase were within size ranges usable on the optical tweezers. In order to obtain correct coalescence times, all force vs. time plots obtained from the tweezers were manually examined to determine first contact point, and then the tcoales during a retracted pause segment, see Fig. 3. Depending on the differing coalescence dynamics of every sample run, contact, reorganization within traps, trap escape and/or depletion forces exceeding that of the traps, force–time curves would take varying appearances, with recognizable steps.
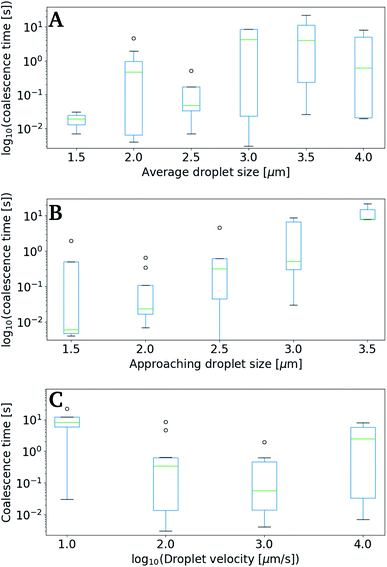
Fig. 9 shows data collected using the retract–overlap scheme, with coalescence time plotted against average droplet size (A), size of the moving droplet (B) and velocity of the moving droplet (C). The results indicate an increase in coalescence time with increasing droplet size (Fig. 9A and B). This positive correlation becomes even more striking when plotting correlation time as a function of the size of the approaching oil droplet (Fig. 9B). The coalescence time appears to show a negative correlation with droplet velocity (Fig. 9C), but the large error intervals in the data impede firm conclusions.
Despite the numerous studies of droplet coalescence, there is a lack of studies dealing with the effect of the droplet approach velocity on the coalescence time. This lack has previously been explained by the more important challenges connected to controlling the droplet velocity compared to controlling the other parameters influencing the coalescence process (e.g. droplet size, geometrical arrangement, temperature, phase properties, density, viscosity, surface tension, additives).53 Some previous studies have shown that coalescence times should be inversely proportional with velocity,54 while others have concluded that at low droplet approach velocity the coalescence is rapid and then decreases with increasing velocity.55 In the current study the highest coalescence times are observed at the lowest droplet velocities investigated (Fig. 9C). However, at the highest droplet velocities investigated, the coalescence time appear to increase slightly. This is in agreement with what is theorized by Ozan and Jakobsen,56 where coalescence times increases with increasing droplet velocity above a critical approach velocity.
The diameters of the droplets investigated proved to have a clear effect on the coalescence time, with the coalescence times increasing proportional to both the average size of droplet pairs (Fig. 9A), and the size of the approaching (moving) droplet (Fig. 9B). Although this too follows well with other studies,57 the domination on our results were unexpected.
As explained for the depletion measurements presented in previous sections, the drag force causes displacement of the droplets in the traps. This causes the droplet contact to be delayed, but this delay can be corrected for in the force–time curves. This delay in contact before establishing a thin film is at most in the order of milliseconds. The coalescence time – which is in order of seconds for some data points – is thus not significantly affected by this phenomenon.
In the current study, measurements were performed on droplets that were significantly smaller than the droplet sizes that are usually investigated using microfluidics,30 AFM58 or micropipette59 based studies. As also pointed out by Chen and coworkers,43 the measurement and theoretical model of emulsion droplets with diameter below 10 μm are rarely mentioned, even though this is the size scale of real emulsion droplets widely used in various applications. The importance of these small droplets for the overall properties of an emulsion is unclear, and the current study thus contribute to filling this knowledge gap. Due to the small diameters of the droplets investigated, the relative size-difference between two trapped droplets become greater than those of a micro-pipette study or a large micro-fluid cell.30 The results obtained in the current study are therefore more subject to potential effects of varying droplet sizes.
Compared to flotation or flow-based studies, the experimental approach used in the current study allows for improved control of droplet velocity. The position control of the optical traps offer high precision control of the approach velocity, and we are not limited to the sedimentation velocity of larger droplets, or the pressure of individual pumps in a MF cell. With a force output registered at 50 kHz, the contact point, t0, and the coalescence point tcoales, can be accurately determined based on the force-recordings, and does not depend on the use of a high-speed camera. Additionally, the optical tweezers allow for very precise movement and position control of trapped droplet pairs. The OT instrumentation thus opens for high resolution studies of oil droplets of a size rarely explored by other techniques. Further, the approach used in the current paper (retracting and overlapping of droplets) well emulate the collision, sticking and eventual coalescence occurring during fluidic-based experiments.30 However, the more forceful separation of phases in rotational gravity separators,60 or the cumulative pressure from large number of droplets stacked high in creaming layers, subjects individual droplets to a higher vertical force. This force might possibly deform droplets giving wider and flatter thin films, which promotes the coalescence event.61
However, for small droplets, precise size determination is challenging and this may in part explain the large error intervals observed in some of the data presented in the current study. An interesting future improvement to the experimental approach could thus be the inclusion of custom OT/MF cells, which would allow immediate generation and subsequent trapping of emulsion droplets. Results obtained in the current study have shown that the creation of droplets in the desired size ranges for the OT is challenging due to the high interfacial tension in a surfactant-less system. A combined OT/MF approach would thus require the careful choice of surfactant to control the IFT for droplet generation. Additionally, the combined efforts of experimental measurements detailed in this paper and simulations will be important for further progress in the understanding of these emulsions. Ongoing experimental studies are therefore in our group complemented by the use of rare event simulations using the PyRETIS62,63 and PyVisA64 packages to aid in understanding the dynamics of thin film breakage.
Conclusions
An optical tweezers-based approach to measure the effects of approach velocity on depletion forces and work of separation, and coalescence times in pristine oil-in-water emulsions was presented. As part of the study different methods for the preparation of oil in water emulsions were evaluated. Even though the microfluidics-based approaches give an exceptional control of droplet sizes generated, subsequent coalescence of the droplets resulted in a wide droplet size distribution in the emulsion. Alternative and less work-intensive approaches for emulsion preparation were found to provide comparable droplet size distributions at a lower time consumption and were therefore used in the subsequent experiments.Within this paper we explored the limitations on optical manipulation on emulsion droplets. These limitations included the drag force observed at high droplet velocities, and possible flocculation during droplet contact with subsequent trap escape. The identification of the thin film contact point was challenging and depended on estimates of the droplet size and the required trap displacement to contact. Still, the depletion force between pairs of oil droplets as well as the work performed when separating two droplets was determined based on OT retract–extend measurements. The work of separating droplets was found to increase with increasing ionic concentration in the continuous phase, droplet size and approach velocity. Despite large variation in data sets, the coalescence times for droplet pairs appears to decrease with increasing approach velocity. Similarly, the coalescence times for droplet pairs increased with average droplet size. However, the size of the approaching droplet seems to have a more important influence on the coalescence times compared to its approach velocity.
Author contributions
E. R. and M. S. were instrumental in obtaining the funding for the study. O. A., E. R. and M. S. designed the experiments. O. A. and M. S. developed and optimized the protocols for the OT experiments. O. A. prepared the emulsions using the different methods described in the paper. O. A. performed the OT experiments, developed the software to process and analyze the data and performed the data analysis. O. A. and M. S. drafted the manuscript with input from all authors. All authors reviewed and approved the manuscript.Conflicts of interest
There are no conflicts to declare.Acknowledgements
We thank Swapnil Vilas Bhujbal for preparing the microfluidic cells. This work was supported by the Research Council of Norway through their funding of the PETROMAKS 2 project number 267669.References
- X. Sun, Y. Zhang, G. Chen and Z. Gai, Energies, 2017, 10, 345 CrossRef.
- F. Zhu, Trends Food Sci. Technol., 2019, 85, 129–137 CrossRef CAS.
- C. Berton-Carabin and K. Schroën, Curr. Opin. Food Sci., 2019, 27, 74–81 CrossRef.
- B. A. Khan, N. Akhtar, H. M. S. Khan, K. Waseem, T. Mahmood, A. Rasul, M. Iqbal and H. Khan, Afr. J. Pharm. Pharmacol., 2011, 5, 2715–2725 CAS.
- S. Ding, C. A. Serra, T. F. Vandamme, W. Yu and N. Anton, J. Controlled Release, 2019, 295, 31–49 CrossRef CAS.
- E. Dickinson, Food Biophys., 2011, 6, 1–11 CrossRef.
- J. K. Beattie and A. M. Djerdjev, Angew. Chem., Int. Ed., 2004, 43, 3568–3571 CrossRef CAS.
- M. Lashkarbolooki and S. Ayatollahi, Can. J. Chem. Eng., 2018, 96, 1396–1402 CrossRef CAS.
- M. Mitsunobu, S. Kobayashi, N. Takeyasu and T. Kaneta, Anal. Sci., 2017, 33, 709–713 CrossRef CAS.
- I. Kralova, J. Sjöblom, G. Øye, S. Simon, B. A. Grimes and K. Paso, Adv. Colloid Interface Sci., 2011, 169, 106–127 CrossRef CAS.
- J. G. Speight, The chemistry and technology of petroleum, CRC press, 2014 Search PubMed.
- F. Goodarzi and S. Zendehboudi, Can. J. Chem. Eng., 2019, 97, 281–309 CrossRef CAS.
- J. C. Slattery, L. Sagis and E.-S. Oh, Interfacial transport phenomena, Springer Science & Business Media, 2007 Search PubMed.
- L. Pan, Y. Chen, D. Chen, Y. Dong, Z. Zhang and Y. Long, IOP Conf. Ser.: Mater. Sci. Eng., 2018, 042005 Search PubMed.
- P. Kundu and I. M. Mishra, Rev. Chem. Eng., 2018, 35, 73–108 CrossRef.
- S. M. Vegas Mendoza, E. Avella Moreno, C. A. Guerrero Fajardo and R. Fierro Medina, Water, 2019, 11, 1452 CrossRef.
- C. Negin, S. Ali and Q. Xie, Petroleum, 2017, 3, 197–211 CrossRef.
- M. S. Kamal, J. Surfactants Deterg., 2016, 19, 223–236 CrossRef CAS.
- J. J. Sheng, J. Nat. Gas Sci. Eng., 2015, 22, 252–259 CrossRef.
- A. Y. Mehandzhiyski, E. Riccardi, T. S. van Erp, T. T. Trinh and B. A. Grimes, J. Phys. Chem. B, 2015, 119, 10710–10719 CrossRef CAS.
- A. Y. Mehandzhiyski, E. Riccardi, T. S. van Erp, H. Koch, P.-O. Åstrand, T. T. Trinh and B. A. Grimes, J. Phys. Chem. A, 2015, 119, 10195–10203 CrossRef CAS.
- O. Sundman, S. Simon, E. L. Nordgard and J. Sjöblom, Energy Fuels, 2010, 24, 6054–6060 CrossRef CAS.
- E. Riccardi, K. Kovalchuk, A. Y. Mehandzhiyski and B. A. Grimes, J. Dispersion Sci. Technol., 2014, 35, 1018–1030 CrossRef CAS.
- K. Kovalchuk, E. Riccardi, A. Mehandzhiyski and B. Grimes, Colloid J., 2014, 76, 564–575 CrossRef CAS.
- K. Kovalchuk, E. Riccardi and B. A. Grimes, Ind. Eng. Chem. Res., 2014, 53, 11691–11703 CrossRef CAS.
- E. Riccardi and T. Tichelkamp, Colloids Surf., A, 2019, 573, 246–254 CrossRef CAS.
- S. S. Jang and W. A. Goddard, J. Phys. Chem. B, 2006, 110, 7992–8001 CrossRef CAS.
- L. Rekvig and D. Frenkel, J. Chem. Phys., 2007, 127, 134701 CrossRef.
- L. Leal, Phys. Fluids, 2004, 16, 1833–1851 CrossRef CAS.
- M. Dudek, D. Fernandes, E. H. Herø and G. Øye, Colloids Surf., A, 2020, 586, 124265 CrossRef CAS.
- D. Langevin, Curr. Opin. Colloid Interface Sci., 2019, 44, 23–31 CrossRef CAS.
- R. Pal, AIChE J., 1996, 42, 3181–3190 CrossRef CAS.
- K. C. Neuman and A. Nagy, Nat. Methods, 2008, 5, 491–505 CrossRef CAS.
- A. Ashkin, Phys. Rev. Lett., 1970, 24, 156 CrossRef CAS.
- A. Ashkin, J. M. Dziedzic, J. E. Bjorkholm and S. Chu, Opt. Lett., 1986, 11, 288–290 CrossRef CAS.
- J. R. Moffitt, Y. R. Chemla, S. B. Smith and C. Bustamante, Annu. Rev. Biochem., 2008, 77, 205–228 CrossRef CAS.
- R. Huang, I. Chavez, K. M. Taute, B. Lukić, S. Jeney, M. G. Raizen and E.-L. Florin, Nat. Phys., 2011, 7, 576–580 Search PubMed.
- Y. Deng, J. Bechhoefer and N. R. Forde, J. Opt. A: Pure Appl. Opt., 2007, 9, S256 CrossRef.
- P. Polimeno, A. Magazzu, M. A. Iati, F. Patti, R. Saija, C. D. E. Boschi, M. G. Donato, P. G. Gucciardi, P. H. Jones and G. Volpe, et al., J. Quant. Spectrosc. Radiat. Transfer, 2018, 218, 131–150 CrossRef CAS.
- A. D. Ward, M. G. Berry, C. D. Mellor and C. D. Bain, Chem. Commun., 2006, 4515–4517 RSC.
- W.-A. C. Bauer, J. Kotar, P. Cicuta, R. T. Woodward, J. V. Weaver and W. T. Huck, Soft Matter, 2011, 7, 4214–4220 RSC.
- J. Nilsen-Nygård, M. Sletmoen and K. I. Draget, RSC Adv., 2014, 4, 52220–52229 RSC.
- A. Chen, S.-W. Li, F.-N. Sang, H.-B. Zeng and J.-H. Xu, J. Colloid Interface Sci., 2018, 532, 128–135 CrossRef CAS.
- A. Chen, S.-W. Li, D. Jing and J.-H. Xu, Chem. Eng. Sci., 2019, 193, 276–281 CrossRef CAS.
- A. Chen, F. Wang, Y. Zhou and J.-h. Xu, Langmuir, 2020, 36, 4664–4670 CrossRef CAS.
- M. R. Otazo, R. Ward, G. Gillies, R. S. Osborne, M. Golding and M. A. Williams, Soft Matter, 2019, 15, 6383–6391 RSC.
- T. Danner and H. Schubert, Food Colloids: Fundamentals of Formulation, ed. E. Dickinson and R. Miller, 2001, pp. 116–124 Search PubMed.
- H. Liu and Y. Zhang, Phys. Fluids, 2011, 23, 082101 CrossRef.
- J. E. Melzer and E. McLeod, ACS Nano, 2018, 12, 2440–2447 CrossRef CAS.
- R. Beetstra, M. A. van der Hoef and J. Kuipers, AIChE J., 2007, 53, 489–501 CrossRef CAS.
- A. Buosciolo, G. Pesce and A. Sasso, Opt. Commun., 2004, 230, 357–368 CrossRef CAS.
- E. Evans, Biophys. Chem., 1999, 82, 83–97 CrossRef CAS.
- S. Orvalho, M. C. Ruzicka, G. Olivieri and A. Marzocchella, Chem. Eng. Sci., 2015, 134, 205–216 CrossRef CAS.
- J. Kamp and M. Kraume, Chem. Eng. Sci., 2016, 156, 162–177 CrossRef CAS.
- R. Kirkpatrick and M. Lockett, Chem. Eng. Sci., 1974, 29, 2363–2373 CrossRef CAS.
- S. C. Ozan and H. A. Jakobsen, Int. J. Multiphase Flow, 2019, 119, 223–236 CrossRef CAS.
- F. Gebauer, J. Villwock, M. Kraume and H.-J. Bart, Chem. Eng. Res. Des., 2016, 115, 282–291 CrossRef CAS.
- C. Shi, L. Zhang, L. Xie, X. Lu, Q. Liu, J. He, C. A. Mantilla, F. G. Van Den Berg and H. Zeng, Langmuir, 2017, 33, 1265–1274 CrossRef CAS.
- C. Tang, P. Zhang and C. K. Law, Phys. Fluids, 2012, 24, 022101 CrossRef.
- T. Frising, C. Noïk and C. Dalmazzone, J. Dispersion Sci. Technol., 2006, 27, 1035–1057 CrossRef CAS.
- T. Krebs, D. Ershov, C. Schroen and R. Boom, Soft Matter, 2013, 9, 4026–4035 RSC.
- A. Lervik, E. Riccardi and T. S. van Erp, J. Comput. Chem., 2017, 38, 2439–2451 CrossRef CAS.
- E. Riccardi, A. Lervik, S. Roet, O. Aarøen and T. S. van Erp, J. Comput. Chem., 2020, 41, 370–377 CrossRef CAS.
- O. Aarøen, H. Kiær and E. Riccardi, J. Comput. Chem., 2020, 435–446 Search PubMed.
| This journal is © The Royal Society of Chemistry 2021 |

