
 Open Access Article
 This Open Access Article is licensed under a Creative Commons Attribution-Non Commercial 3.0 Unported Licence
Development of a colorless Centella asiatica (L.) Urb. extract using a natural deep eutectic solvent (NADES) and microwave-assisted extraction (MAE) optimized by response surface methodology†
Suppalak Phaisana,
Fonthip Makklianga,
Waraporn Putalunbc,
Seiichi Sakamoto d and
Gorawit Yusakul*a
d and
Gorawit Yusakul*a
aSchool of Pharmacy, Walailak University, Thaiburi, Thasala, Nakhon Si Thammarat, 80160, Thailand. E-mail: gorawit.yu@mail.wu.ac.th
bFaculty of Pharmaceutical Sciences, Khon Kaen University, Khon Kaen, 40002, Thailand
cResearch Group for Pharmaceutical Activities of Natural Products Using Pharmaceutical Biotechnology (PANPB), National Research University-Khon Kaen University, Khon Kaen, 40002, Thailand
dDepartment of Pharmacognosy, Graduate School of Pharmaceutical Sciences, Kyushu University, Fukuoka, 812-8582, Japan
First published on 25th February 2021
Abstract
This study outlines a green process for Centella asiatica (L.) Urb. (CA) extraction. Natural deep eutectic solvents (NADESs) and microwave-assisted extraction (MAE) were combined to provide a high bioactive compound yield and high antioxidant activity. Among the NADESs evaluated, the combination of acetylcholine chloride![[thin space (1/6-em)]](https://www.rsc.org/images/entities/char_2009.gif) :malic acid:water (1:2:2): water (40:60) was the best for extraction. These conditions provide high madecassoside (MS) (21.7 mg g−1 dry weight) and asiaticoside (AS) (12.7 mg g−1 dry weight) yields, with greater than 80% (v/v) EtOH (13.3 mg g−1 MS and 7.80 mg g−1 AS). In addition, the extracts from this process showed higher antioxidant activity (IC50 = 0.26 mg mL−1) than the CA aqueous EtOH and water extracts. Moreover, the color of the extract products was less green than that of the extracts prepared using EtOH and aqueous EtOH as solvents, which are suitable for cosmeceutical products. Response surface methodology (RSM) was used for MAE optimization. The ANOVA data from the central composition design (CCD) of RSM were fitted with quadratic models yielding acceptable R2 (>0.93), adjusted R2 (>0.87), predicted R2 (>0.81), and nonsignificant lack of fit (p >0.05) values. The quadratic model was validated using optimal conditions (30 s, power 300 W, and a liquid to solid ratio 20 mL g−1), and the model validation showed more than 80% accuracy in both MS and AS yields. This research presented an effective green process for CA extraction, which resulted in an environmentally friendly CA extract requiring little energy consumption and no organic solvents.
:malic acid:water (1:2:2): water (40:60) was the best for extraction. These conditions provide high madecassoside (MS) (21.7 mg g−1 dry weight) and asiaticoside (AS) (12.7 mg g−1 dry weight) yields, with greater than 80% (v/v) EtOH (13.3 mg g−1 MS and 7.80 mg g−1 AS). In addition, the extracts from this process showed higher antioxidant activity (IC50 = 0.26 mg mL−1) than the CA aqueous EtOH and water extracts. Moreover, the color of the extract products was less green than that of the extracts prepared using EtOH and aqueous EtOH as solvents, which are suitable for cosmeceutical products. Response surface methodology (RSM) was used for MAE optimization. The ANOVA data from the central composition design (CCD) of RSM were fitted with quadratic models yielding acceptable R2 (>0.93), adjusted R2 (>0.87), predicted R2 (>0.81), and nonsignificant lack of fit (p >0.05) values. The quadratic model was validated using optimal conditions (30 s, power 300 W, and a liquid to solid ratio 20 mL g−1), and the model validation showed more than 80% accuracy in both MS and AS yields. This research presented an effective green process for CA extraction, which resulted in an environmentally friendly CA extract requiring little energy consumption and no organic solvents.
1. Introduction
The extraction process of Centella asiatica (L.) Urb. (CA) plays an important and critical role in the resulting health properties, safety, active ingredient quality/quantity, and environmental impacts of the extract. A large quantity of CA extract is utilized in health product industries, such as the health food, nutraceutical, cosmeceutical, and pharmaceutical industries. Therefore, a green chemistry-based and efficient approach that provides a high extraction yield of bioactive ingredients is crucial for the sustainable use of CA products. Triterpene saponins were found and used as biomarkers for CA quality control.1 Madecassoside (MS) and asiaticoside (AS) are principal constituents in CA extracts, and these compounds can be hydrolyzed to madecassic acid (MA) and asiatic acid (AA), respectively. The aerial part of intact CA is composed of MS, AS, MA, and AA in the ranges of 23.0–26.6, 9.9–10.76, 0.3–2.01, and 0.4–2.94 mg g−1 dry weight, respectively.2,3 CA usually accumulates more MS and AS than MA and AA, which can be up to 80 times higher depending on cultivation location and harvesting season.3 Moreover, CA is composed of eugenol derivatives, caffeoylquinic acids, and flavonoids.4 Regarding various chemical constituents, CA extracts have been reported to have many pharmacological properties, such as attenuating chronic venous insufficiency,5 improving alertness, and decreasing anger,1 in clinical trials. For indications in skin disorders and aging, CA extract has been proven to be an effective agent for wound healing by enhancing cell proliferation, collagen synthesis, antioxidation, anti-inflammation, extracellular matrix synthesis, etc.6 Thus, CA-derived products were effective for the treatment of burn wounds7 and diabetic wounds in humans8 and other wounds in an animal model.6 In addition to wound healing, CA phytochemicals ameliorate hypertrophic scars.9 Various CA benefits relate to the antioxidant activity of CA because oxidative stress initiates various disorders. Many previous studies reported the correlation between antioxidants and the content of flavonoid compounds and antitumor activity.10 Another study showed that the 95% (v/v) EtOH extract provides high antioxidant capacity and decreases the lipid profile of mice in vivo.11 As mentioned above, the antioxidant activity relates to triterpene and correlates with other bioactive compounds in the extract. Thus, CA extracts and the triterpenoid fraction are widely incorporated as active ingredients in cosmeceuticals and topical medicine. Regarding the active pharmaceutical ingredients in CA leaves, CA extracts of less green coloration are desired for topical product development.2,3The processes of extraction, preparation, and standardization of CA phytochemicals were developed to facilitate CA product development and utility. When EtOH is used as a solvent for maceration extraction of CA phytochemicals, it consumes time for extraction (2 hours) and evaporation; this method also requires a high EtOH concentration (95%) for a high extractive yield.12 An optimal microwave-assisted extraction (MAE) method was developed and reduced the time consumption (3.4 minutes) and the percentage of EtOH (58%) required.2 MAE is a potential technique that minimizes the time consumption and volume of extraction solvent and provides a high extraction yield compared to the conventional method.2,12 Since MAE can generate heat inside plant materials, this method improves the mass transfer of target compounds and increases the extraction efficiency.13,14 Green solvents based on natural deep eutectic solvents (NADESs) have been developed to replace organic solvents for chemical reactions and extractions. NADES systems are exciting and challenging to develop for extraction because they can extract both polar and nonpolar target compounds. Various types of NADESs containing hydrogen-bond donors (HBDs) and hydrogen-bond acceptors (HBAs) were studied for the extraction of target compounds with high yields and improved solubility, bioavailability, and stability of the bioactive compounds.15–17 Various studies have reported NADESs for extraction that provide a high bioactive compound yield. NADESs are efficient for the extraction of compounds with various polarities, such as phenolic compounds and flavonoids,18 curcuminoids,19 and lipids.20 According to NADESs as effective and safe solvents, NADESs are combined with extraction techniques assisted by microwave and ultrasound.21,22 For fumaric acid extraction using NADES-based MAE, the extraction yield is higher than that of the heating method, and MAE takes 12 times less time than the heating method.22 In addition, the combination of NADESs with ultrasound-assisted extraction is efficient for anthocyanin extraction.23 NADESs coupled with modern extraction methods provide higher efficiency than conventional solvents because NADESs with polarity and a high dielectric constant result in increasing MAE efficiency.24 Herb extraction using EtOH is usually contaminated with chlorophyll because it can be soluble in EtOH. In the case of 95% EtOH used as an extraction solvent, the resultant extract was dark green. Previous development of MAE using 58% EtOH produced a yellowish, powdered CA extract, for which a further decoloring process was required to reduce the chlorophyll contents.2,25 Further treatment for extract decoloring might lead to the loss of active compounds and consume more energy, solvent, and labor. Thus, the current extraction of compounds from herbs limits the development of topical and cosmeceutical products.
In this study, NADES coupled with MAE was developed for high extractive yields with colorless characteristics, minimizing hazardous solvent consumption and waste. NADESs were developed using acetylcholine chloride and organic acids compatible with cosmetic formulations. The development aims to discover the NADES composition with high MS and AS extractive yields and minimize green coloration of the resultant extract. MAE was optimized in terms of parameters affecting extraction using the central composition design (CCD) of response surface methodology (RSM). MAE, coupled with NADES, led to a higher yield of bioactive compounds than that obtained using conventional solvent and less chlorophyll coloration, demonstrating its suitability for use in health products; in addition, the resulting extract is safe for consumers and eco-friendly.
2. Materials and methods
2.1 Chemicals and reagents
Asiaticoside and madecassoside were obtained from INDOFINE Chemical Company, Inc. (Hillsborough, NJ, USA). Acetylcholine chloride (≥98%) was purchased from Alfa Aesar (Tewksbury, MA, USA). Organic acids, such as citric acid (Ajax Finechem Pty Ltd), gluconic acid (50% (v/v) solution in water, Merck KGaA, Darmstadt, Germany), and DL-malic acid (HiMedia Laboratories Pvt. Ltd, Mumbai, India), were obtained commercially. Absolute EtOH, acetonitrile, and deionized water of analytical reagent grade were supplied by RCI Labscan Limited (Bangkok, Thailand). Rutin (≥97%) was purchased from Acros Organics (Thermo Fisher Scientific, Geel, Belgium). 2,2-Diphenyl-1-picrylhydrazyl (DPPH) was purchased from Sigma-Aldrich (MO, USA).2.2 Plant sample and preparation
CA was identified and collected at Walailak University, Nakhon Si Thammarat, Thailand, by Dr Gorawit Yusakul. A whole CA plant was washed with deionized water and dried at 50 °C using a hot air oven for 18 hours. The dried CA sample was ground and then mashed (mesh sieve diameter 0.5 mm) until it transformed into a fine powder. The appearance of CA power is shown in the ESI (Fig. S1).† The CA powder was kept at −20 °C until the extraction process.2.3 NADES preparation
All NADESs were prepared using acetylcholine chloride as the HBA and gluconic acid, malic acid, and citric acid as the HBD. Because the eutectic mixture of the mentioned HBA and HBD could not be formed without water, water was added to each NADES system for a specific final mole ratio of HBA:HBD:water. The composite mixture was then stirred at a constant rate at 80 °C for approximately 1 hour or until a clear solution was obtained. After that, water was added to each NADES at 10:90–80:20 ratios (water:NADES, Table 1).
| Code | NADES | Dilution ratio (water:NADES) |
||
|---|---|---|---|---|
| Hydrogen bond acceptor (HBA) | Hydrogen bond donor (HBD) | Mole ratio (HBA:HBD:water) |
||
| AGW10 | Acetylcholine chloride | Gluconic acid | 1:2:2 |
10:90 |
| AGW20 | Acetylcholine chloride | Gluconic acid | 1:2:2 |
20:80 |
| AGW40 | Acetylcholine chloride | Gluconic acid | 1:2:2 |
40:60 |
| AGW60 | Acetylcholine chloride | Gluconic acid | 1:2:2 |
60:40 |
| AGW80 | Acetylcholine chloride | Gluconic acid | 1:2:2 |
80:20 |
| AMW10 | Acetylcholine chloride | Malic acid | 1:2:2 |
10:90 |
| AMW20 | Acetylcholine chloride | Malic acid | 1:2:2 |
20:80 |
| AMW40 | Acetylcholine chloride | Malic acid | 1:2:2 |
40:60 |
| AMW60 | Acetylcholine chloride | Malic acid | 1:2:2 |
60:40 |
| AMW80 | Acetylcholine chloride | Malic acid | 1:2:2 |
80:20 |
| ACW10 | Acetylcholine chloride | Citric acid | 1:2:2 |
10:90 |
| ACW20 | Acetylcholine chloride | Citric acid | 1:2:2 |
20:80 |
| ACW40 | Acetylcholine chloride | Citric acid | 1:2:2 |
40:60 |
| ACW60 | Acetylcholine chloride | Citric acid | 1:2:2 |
60:40 |
| ACW80 | Acetylcholine chloride | Citric acid | 1:2:2 |
80:20 |
2.4 Screening NADESs
NADESs composed of acetylcholine chloride and an organic acid (gluconic, malic, or citric acid) were prepared and diluted with various ratios of water (Table 1). Each NADES solution was used as an extraction solvent for MAE under specific conditions. MAE was conducted using a microwave oven (ME711 K, Samsung Thailand Electronic, Chonburi, Thailand). Dry CA powder (0.10 g) was introduced into a glass vial (10 mL), and then an extraction solvent was added. After mixing well, MAE (20 s of radiation, 450 W of microwave power, and a 20 mL g−1 liquid–solid (LS) ratio) was performed. Then, the extractant phase was transferred into a microtube as a sample stock solution. The extractive yields of MS and AS were analyzed using HPLC-UV. The antioxidant activity was determined by the DPPH scavenging assay. The preliminary results of NADES screening indicated the most appropriate NADESs for coupling with MAE. The NADES providing the highest extraction capacity and yields of MS and AS were further optimized with the CCD of RSM.2.5 Optimization using central composition design (CCD) of response surface methodology (RSM)
RSM was conducted to characterize the interactions of extraction parameters and define the optimal conditions for MS and AS extraction. A statistical experimental design based on CCD of RSM was used for the optimization of the parameters significantly affecting MAE performance. The effect of different levels of each independent factor, including radiation time (X1) (10, 20, 30, 40, and 50 s), microwave power (X2) (180, 300, 450, 600, and 850 W), and LS ratio (X3) (20, 30, 40, 50, and 60 mL g−1), on the yield of MS (Y1) and AS (Y2) were evaluated. After screening, three independent factor levels (Table 2) were used for optimization using CCD (Table 3). The relationship between the independent parameters and each response was analyzed in a random order for model fitting. All statistical analyses were performed by Design Expert (trial version 12). The statistical significance of the model obtained from CCD was investigated by analysis of variance (ANOVA), with a p-value less than 0.05 considered significant.26 The selected model was validated using the optimal extraction conditions.| Factors | Symbol | Unit | Level | ||||
|---|---|---|---|---|---|---|---|
| −Alpha (−1.68) | Low (−1) | Medium (0) | High (+1) | +Alpha (+1.68) | |||
| a The extractions were performed with 180 W and 800 W microwave power instead, respectively, because the 198 W and 702 W power are not available in the microwave model used. | |||||||
| Independent variables | |||||||
| Irradiation time | X1 | Second | 3.2 | 10 | 20 | 30 | 36.8 |
| Microwave power | X2 | W | 198a | 300 | 450 | 600 | 702a |
| LS ratio | X3 | mL g−1 | 13.2 | 20 | 30 | 40 | 46.8 |
|
|||||||
| Dependent variables | |||||||
| Madecassoside (MS) | Y1 | mg g−1 dry weight | |||||
| Asiaticoside (AS) | Y2 | mg g−1 dry weight | |||||
| Run | Independent variables | Responses | |||
|---|---|---|---|---|---|
| X1 | X2 | X3 | Y1 | Y2 | |
| 1 | 1 | −1 | −1 | 19.84 | 11.84 |
| 2 | 0 | 0 | −1.68 | 15.72 | 9.24 |
| 3 | 1 | 1 | −1 | 18.40 | 10.74 |
| 4 | 0 | 0 | 0 | 12.96 | 7.57 |
| 5 | 0 | 0 | 0 | 13.07 | 7.67 |
| 6 | 0 | 0 | 0 | 15.38 | 8.93 |
| 7 | 1.68 | 0 | 0 | 16.96 | 9.69 |
| 8 | 0 | 0 | 1.68 | 14.00 | 8.05 |
| 9 | 0 | −1.68 | 0 | 17.44 | 10.13 |
| 10 | 0 | 0 | 0 | 13.30 | 7.76 |
| 11 | −1.68 | 0 | 0 | 9.11 | 5.34 |
| 12 | −1 | 1 | 1 | 13.52 | 7.89 |
| 13 | 1 | −1 | 1 | 14.69 | 8.41 |
| 14 | 0 | 0 | 0 | 15.32 | 8.91 |
| 15 | −1 | −1 | −1 | 12.92 | 7.51 |
| 16 | −1 | 1 | −1 | 13.44 | 7.80 |
| 17 | 1 | 1 | 1 | 16.42 | 9.49 |
| 18 | 0 | 1.68 | 0 | 17.78 | 10.40 |
| 19 | −1 | −1 | 1 | 12.01 | 7.06 |
| 20 | 0 | 0 | 0 | 13.26 | 7.84 |
2.6 Determination of MS and AS contents using high-performance liquid chromatography (HPLC-UV)
HPLC-UV was used for MS and AS content determination. A Thermo Scientific Dionex Ultimate 3000 (Thermo Scientific, MA, USA) coupled with a variable wavelength detector (VWD-3100), an autosampler (WPS-3000SL), a tertiary pump (LPG-4300SD), and a column compartment (TCC-3000SL) was used. MS and AS standards and sample solutions (10 μL) were injected into a reverse-phase analytical column (VertiSep™ USP C18 HPLC column, 4.6 mm × 250 mm, 5 μm particle size; Vertical Chromatography Co., Ltd., Nonthaburi, Thailand). The HPLC-UV conditions for MS and AS determination were modified from a previous study.27 The mobile phase was gradient elution with a constant flow rate of 1.0 mL min−1, where acetonitrile and deionized water were mixed as a mobile phase. The mixture began at 30% to 40% (v/v) acetonitrile in water for five minutes and was increased to 70% acetonitrile within ten minutes. The acetonitrile of the mobile phase was increased to 80% in the next five minutes to wash the column; then, the acetonitrile ratio was decreased to 30% acetonitrile to equilibrate the column for the subsequent analysis. The column oven and detection wavelength were set at 35 °C and 206 nm, respectively. HPLC chromatograms of authentic MS, AS, and some samples are shown in ESI (Fig. S2).† The calibration curves of MS and AS were set at 12.5–200 μg mL−1 (R2 = 0.998 and 0.9968, respectively). The HPLC-UV analysis recovery for MS and AS was in the range of 97.2–99% (ESI, Table S1†).2.7 Determination of the intensity of chlorophyll
The method for chlorophyll determination followed a previous study28 with some modifications. The intensity of chlorophyll was evaluated by the absorbance. The samples were determined using a microplate spectrophotometer (Eon™, BioTek Instruments, Inc., VT, USA). One hundred microliters of sample solution were added to a transparent and flat-bottomed 96-well plate. The absorbance of chlorophyll was measured at 660 nm, which is the maximum absorbance wavelength. The solvent of each extract was used as a blank.2.8 Determination of the antioxidant activity
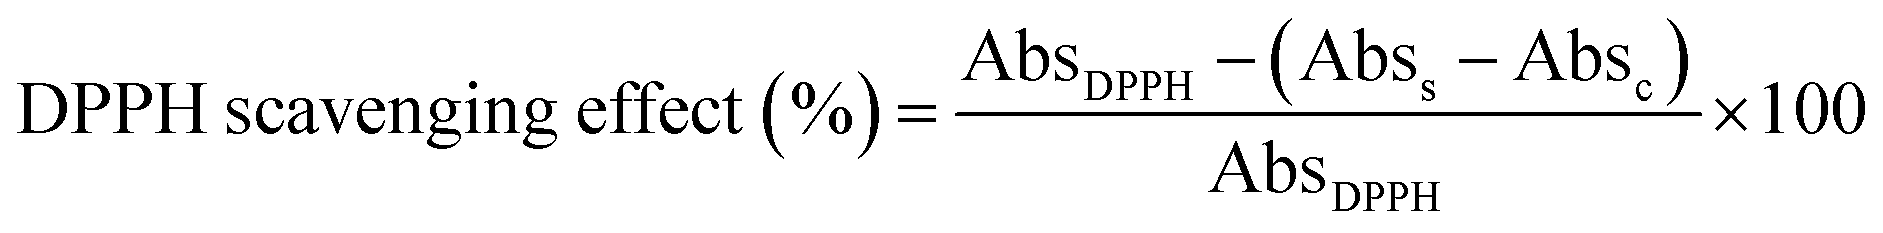
The DPPH assay was used to determine the antioxidant activity of the extractant samples. The method was followed by a previous study with slight modifications.29 Rutin at concentrations ranging from 1.95 to 125 μg mL−1 was used as a reference antioxidant compound. CA samples (0.1 g) were extracted using MAE (20 s of radiation, 450 W of microwave power, and a 20 mL g−1 LS ratio) and then diluted to various concentrations in 50% (v/v) EtOH. Then, 100 μL of rutin or 100 μL of sample solution was individually added to a 96-well plate, and 100 μL of 0.2 mM DPPH was added and mixed. Then, this mixture solution was incubated in the dark at room temperature for 30 minutes. Finally, the absorbance was measured using a microplate reader spectrophotometer at 517 nm. The percentage of the DPPH scavenging effect was calculated according to the following equation:where AbsDPPH is the absorbance of the DPPH solution without the sample and Abss and Absc are the absorbances of the samples in the presence and absence of DPPH solution, respectively. The relationship between the sample concentration and the scavenging effects was plotted and analyzed by linear regression. The antioxidant activity is reported in IC50, which is the concentration of sample scavenging 50% of the DPPH radicals.
3. Results and discussion
3.1 Screening of MAE using NADES for central composition design
NADES systems (acetylcholine chloride: an organic acid: water), diluted with various ratios with water, were investigated to discover the appropriate NADES providing the highest yields of MS and AS. The NADESs of every organic acid produced similar extraction efficacies. The yields of MS and AS increased with increasing water:NADES ratio (10:90 to 60:40); however, the yields decreased when the water content was increased to 80:20 of water:NADES (Table 4). The water content directly influences the viscosity of NADESs, where low-viscosity NADESs facilitate the mass transfer of NADESs in/out of cells. In addition, the water content impacts the polarity of the NADES, which can be adjusted to be suitable for the polarity of target compounds. In the NADES system, water plays a role as bound water if it is appropriately added. Bound water results in an increased polarity and decreased viscosity of NADESs. Excess the limit water content for bonding with the NADES components, water disturbs the hydrogen bond of NADES and negatively affects the extraction ability of the solvent. The water content affects the hydrogen bonding between NADES components and extractant substances.
| Solvents | Extraction yields (mg g−1 dry weight) | |
|---|---|---|
| MS | AS | |
| a All values are presented as the mean of three replicates ± standard deviation (mean ± SD). All samples were extracted using CA powders (0.1 g) and MAE conditions (20 s of radiation time, 450 W of microwave power, and 20 mL g−1 LS ratio). *Indicates that the extractive yield was significantly higher than those extracted using 80% (v/v) EtOH (p-value <0.05), which was analyzed using one-way analysis of variance, followed by Tukey's honest test. | ||
| AGW10 | 18.9 ± 0.03* | 10.6 ± 0.03* |
| AGW20 | 19.9 ± 0.02* | 11.1 ± 0.02* |
| AGW40 | 19.8 ± 0.01* | 10.9 ± 0.05* |
| AGW60 | 22.5 ± 0.01* | 11.9 ± 0.02* |
| AGW80 | 20.5 ± 0.08* | 11.0 ± 0.09* |
| AMW10 | 5.56 ± 0.02 | 3.25 ± 0.02 |
| AMW20 | 11.6 ± 0.01 | 6.90 ± 0.02 |
| AMW40 | 20.1 ± 0.03* | 11.7 ± 0.02* |
| AMW60 | 21.7 ± 0.03* | 12.7 ± 0.03* |
| AMW80 | 20.2 ± 0.03* | 11.8 ± 0.04* |
| ACW10 | 4.50 ± 0.02 | 2.66 ± 0.01 |
| ACW20 | 12.9 ± 0.12 | 7.55 ± 0.01 |
| ACW40 | 18.9 ± 0.02* | 11.0 ± 0.02* |
| ACW60 | 20.5 ± 0.01* | 11.6 ± 0.05* |
| ACW80 | 19.2 ± 0.03* | 11.1 ± 0.03* |
| Distilled water | 6.99 ± 0.41 | 1.16 ± 0.02 |
| 20% (v/v) EtOH | 4.25 ± 0.17 | 1.17 ± 0.00 |
| 40% (v/v) EtOH | 6.95 ± 0.03 | 3.46 ± 0.02 |
| 60% (v/v) EtOH | 13.1 ± 0.10 | 6.71 ± 0.03 |
| 80% (v/v) EtOH | 13.3 ± 0.04 | 7.80 ± 0.02 |
| Absolute EtOH | 4.95 ± 0.03 | 2.99 ± 0.01 |
Previous research indicated that a water content greater than 50% (v/v) in NADES (1,2-propanediol:choline chloride:water, 1:1:1 mole ratio) gradually weakened the hydrogen bonding abilities.30 Although many studies reported ineffective extraction at water contents greater than 50% (v/v), some studies showed that using 60% (v/v) water in NADESs was effective, even if not the best.22 In this study, AMW60 showed a higher extraction yield for MS (21.7 ± 0.03 mg g−1 dry weight) and AS (12.7 ± 0.03 mg g−1 dry weight) than conventional solvents (distilled water, aqueous EtOH, and absolute EtOH) (Table 4). Interestingly, the developed NADESs could extract a high yield of MS and AS in a shorter time than previous reports with EtOH-based MAE, providing MS and AS of 23.09 mg g−1 and 10.76 mg g−1 dry weight, respectively.2 The maceration of CA at 60 °C for 90 min produces MS (43.8 mg g−1 dry weight) and AS (8.93 mg g−1 dry weight).12 Although the yields of MS are relatively high, the maceration process required more energy and time than NADES-based MAE.2 The thermal behavior of NADES depends on the NADES compositions and water contents because the mentioned factors influence the microwave absorption property. Polyols based NADES showed a higher microwave response than organic acids based NADES.31 The organic acids (gluconic acid, malic acid, and citric acid) with different numbers of hydroxyl groups were observed with their different extraction efficacy in the function with their water contents. The developed NADESs contain acetylcholine chloride, whose ionic structure is susceptible to microwave heating by ionic conduction.32 Therefore, acetylcholine-based NADESs require a shorter extraction time than EtOH and aqueous EtOH.2,25 The NADES-based MAE process developed in this study is advantageous as a low-energy-consumption method and zero-waste process. When organic solvents, even relatively low-toxicity EtOH, are used for the extraction of medicinal plants for use in health products, the process of solvent removal is required. These processes require more energy, time, and labor, which results in increased production costs. Regarding the composition of NADESs (acetylcholine chloride, malic acid, and water), the extract obtained can be used directly for product development. Diluted acetylcholine has been investigated as an agent promoting wound repair in mice33 because its muscarinic receptor activation enhances the proliferation of keratocyte cells.34 Malic acid is an alpha-hydroxy acid (AHA) utilized as an ingredient in cosmetic products. Malic acid is found predominantly in fruits and attenuates inflammation in atopic dermatitis-like skin lesions.35 Thus, the potential use of CA extract prepared using the developed NADES (AMW60) is high, and it was selected as the extraction solvent for MAE optimization using CCD of RSM.35
3.2 Effect of radiation time, microwave power, and liquid-to-solid ratio on MAE efficacy
The MAE parameters affecting the extraction yield were the radiation time, microwave power, and LS ratio. Each of these factors was studied at various levels, whereas other parameters were kept constant. The microwave radiation time for the extraction was investigated at 10, 20, 30, 40, and 50 s, and the extractions were divided into cycles (5 s per cycle). The microwave power and LS ratio were fixed at 180 W and 20 mL g−1, respectively, when evaluating microwave radiation time. The MS and AS yields were in the range of 18.2–19.2 mg g−1 and 10.7–11.3 mg g−1 dry weight, respectively (Fig. 1, Table S2†), which varied among different durations. A radiation time of 10 s was sufficient for the extraction of MS and AS yields. This was the advantage of implementing MAE with cationic acetylcholine- and choline-based NADESs, in which samples were quickly heated via ionic conduction, as mentioned previously. Thus, the decreased microwave irradiation duration reduces the energy consumption of the method. Microwaves generate heating via dipole rotation and ionic conduction. After energy absorption, electromagnetic energy is converted into heat. Elevated temperature decreases NADES viscosity,36 facilitates the penetration of solvents, promotes the dissolution of target compounds, and increases extraction capacity. Although a time of 3.4 minutes is required for aqueous EtOH-based MAE of MS and AS from CA,2 the AMW60-based MAE consumed less extraction time. A longer extraction time did not greatly improve the yields of AMW60-based MAE, which MS (21.1 mg g−1 dry weights) and AS (12.2 mg g−1 dry weights) were obtained with three minutes of microwave irradiation. The deep eutectic solvent showed higher microwave absorption and dissipation into heat than molecular solvents.31 Thus, the MAE time of AMW60 is less than that of aqueous EtOH reported in a previous study.2 Usually, NADESs have more polarity than conventional solvents such as methanol, EtOH, and chloroform, which results in more microwave absorption. | ||
| Fig. 1 The extractive yields of madecassoside (MS) and asiaticoside (AS) obtained from the screening of MAE parameters for CCD experiments, including the effect of radiation time (a) with fixed 180 W and 20 mL g−1 LS ratio, microwave power (b) with fixed 10 s radiation time and 20 mL g−1 LS ratio, and liquid to solid ratio (c) with fixed 10 s radiation time and 180 W. The results obtained from triplicates (n = 3) of each extraction and SD are shown in the error bars. | ||
The power was studied (180–800 W), in which the time and LS ratio were fixed (10 s and 20 mL g−1, respectively). The highest yield (20.6 mg g−1 dry weight of MS and 11.9 mg g−1 dry weight of AS) was obtained with a microwave power of 600 W. The results showed the maximum yield of MS and AS obtained at 600 W (10 s extraction time), and the yields slightly decreased with 800 W. Usually, microwave power is associated with temperature in the extraction medium; therefore, increasing the microwave power results in an enhanced extraction yield; however, superheating from excess power may result in thermal degradation, which is also indicated in a phenolic extraction from Dendrobium formosum by MAE.37 The microwave power is specific for extraction.37,38 In addition, microwave power has been reported for specific target compound extraction from CA because the optimal microwave power for triterpenoids is different from that for phenolics and flavonoids.38 Each microwave power has a specific time point for maximum yield; after a maximum point, the yield may decrease from the degradation effect.
The LS ratio was evaluated at 20, 30, 40, 50, and 60 mL g−1, with a fixed radiation time and microwave power of 10 s and 180 W, respectively. The results showed that the 30 mL g−1 LS ratio provided the highest yield (19.3 and 11.3 mg g−1 dry weight of MS and AS, respectively). The extraction yields were decreased when the LS ratio was greater than 30 mL g−1. In this experiment, the volume of NADES was increased with a fixed amount of CA powder (0.1 g). It is known that a large volume of solvent results in a large concentration gradient between the solvent and matrix, resulting in a high extraction yield, but it requires a relatively long radiation time and microwave power. In the case of this study, which used a low LS ratio resulting in a decrease in the penetration depth of microwaves into CA powder, a low radiation time and microwave power were sufficient for extraction.39 Moreover, a high LS ratio resulted in a low concentration of solute, reducing the driving force for diffusion.40 The MAE of MS and AS from CA using aqueous EtOH as the solvent provided the optimal LS ratio at 10 mL g−1.2 The higher the LS ratio produced, the higher the yield of quercetin extraction by boiling; however, in MAE of the same target compound, a specific LS is appropriate for MAE.41 Therefore, the LS of MAE should be obliviously optimized for MAE.
Regarding the preliminary study, radiation time (10, 20, and 30 s), microwave power (300, 450, and 600 W), and LS ratio (20, 30, and 40 mL g−1) were selected for further optimization using CCD of RSM.
3.3 Central composition design experiment
The three levels of independent factors were optimized based on the response using the CCD of RSM. ANOVA of the CCD data (Table 5) showed that all responses fit with a quadratic model, which was assessed by the F-test and p-value. The R-squared values of Y1 and Y2 were 0.9333 and 0.9383, respectively, which indicated that the quadratic model sufficiently fit the data. Sometimes, the adjusted R-squared value is more appropriate for consideration than the R-squared value because the R-squared value may increase for the increasing terms of the model. This study showed that the adjusted R-squared values were 0.8732 and 0.8828 for Y1 and Y2, respectively, which confirmed the fitness of the model. Moreover, the predicted R-squared value was close to the adjusted R-squared value, which meant that this model was proper for prediction. The lack of fit variance of all models was nonsignificant, which implied acceptance and accuracy of the quadratic model. Through optimization using CCD, the MS yields were in the range from 9.11 to 19.84 mg g−1 dry weight, and the second-order polynomial equation is as follows in eqn (1). The linear term X1 and quadratic term X2 had a significantly positive effect on Y1, while the linear term X3 and the interaction between X1 and X3 had significantly negative effects.| Y1 = 13.88 + 2.25X1 − 0.7954X3 − 0.7877X1X3 + 1.30X22 | (1) |
| Y1 | Y2 | |||||
|---|---|---|---|---|---|---|
| Sum of squares | F-Value | p-Value probability | Sum of squares | F-Value | p-Value probability | |
| a * Indicate the significance at p-value <0.05. ** Indicate the insignificance at p-value <0.05. | ||||||
| Model | 113.66 | 15.54 | <0.0001* | 39.5 | 16.9 | < 0.0001* |
| X1 | 68.85 | 84.73 | <0.0001* | 22.48 | 86.54 | < 0.0001* |
| X2 | 0.6154 | 0.7573 | 0.4046 | 0.1747 | 0.6726 | 0.4313 |
| X3 | 8.64 | 10.63 | 0.0086* | 3.64 | 14.01 | 0.0038* |
| X1X2 | 0.3805 | 0.4682 | 0.5094 | 0.1572 | 0.6051 | 0.4547 |
| X1X3 | 4.96 | 6.11 | 0.033* | 2.34 | 8.99 | 0.0134* |
| X2X3 | 2.15 | 2.64 | 0.1349 | 0.9275 | 3.57 | 0.0881 |
| X12 | 1.45 | 1.78 | 0.2116 | 0.6556 | 2.52 | 0.1432 |
| X22 | 24.33 | 29.95 | 0.0003* | 8.3 | 31.94 | 0.0002* |
| X32 | 1.54 | 1.9 | 0.1983 | 0.5048 | 1.94 | 0.1935 |
| Residual | 8.13 | 2.6 | ||||
| Lack of fit | 1.58 | 0.2418 | 0.9273** | 0.5997 | 0.3002 | 0.8937** |
| Pure error | 6.54 | 2 | ||||
| Cor total | 121.79 | 42.1 | ||||
| Std. dev. | 0.9014 | 0.5097 | ||||
| Mean | 14.78 | 8.61 | ||||
| C.V. (%) | 6.1 | 5.92 | ||||
| PRESS | 22.37 | 7.96 | ||||
| R-Squared | 0.9333 | 0.9383 | ||||
| Adjusted R-squared | 0.8732 | 0.8828 | ||||
| Predicted R-squared | 0.8163 | 0.8109 | ||||
The AS yield was in the range of 5.34 to 11.84 mg g−1 dry weight in the CCD experiments. The significant term Y2 showed a similar pattern to Y1, but each significant term showed a lower effect than that of Y2. The equation of the quadratic model is as follows in eqn (2).
| Y2 = 8.11 + 1.28X1 − 0.5162X3 − 0.5404X1X3 + 0.7587X22 | (2) |
The interactions of each term on all responses were demonstrated in the three-dimensional (3D) surface response (Fig. 2). The 3D surface response of Y1 displays an increasing response with increasing X1 at the intermediate level of X2 (Fig. 2(a1)) and the low level of X3 (Fig. 2(a2)). Moreover, the intermediate level of X2 showed a high response of Y1 at a low level of X3 (Fig. 2(a3)). The 3D surface responses of Y2 (Fig. 2(b1–b3)) displayed the same pattern as that of Y1 but exhibited different effects on the value of each interaction term.
 | ||
| Fig. 2 The 3D responses of extractive yields for madecassoside (MS, a) and asiaticoside (AS, b), which resulted from the effects of dependent factors, including the interaction between radiation time and microwave power (X1X2) (a1 and b1), radiation time and liquid to solid ratio (X1X3) (a2 and b2), and microwave power and liquid to solid ratio (X2X3) (a3 and b3). | ||
From the results, we can conclude that radiation time is an important factor for CA extraction using NADESs because the time used had a positive effect on the response. At the same time, the LS ratio showed a negative effect on MS and AS. The microwave power at 450 W increased all responses when increasing the radiation time and decreasing the LS ratio. The relation between predicted values and actual values in the quadratic model is shown in Fig. 3. Almost every point of all models was close to a linear line, which means strong prediction of the extraction yield.
 | ||
| Fig. 3 Linear regression established between the actual and predicted values of the quadratic model for extractive yields of MS (a) and AS (b). | ||
The equation model indicated the strong positive effect of extraction time because a long extraction time resulted in high temperature, which decreased viscosity and increased diffusion, resulting in increased extraction efficiency. Moreover, the higher LS ratio tends to decrease the response since microwaves are absorbed by NADESs, resulting in a loss of microwave transferring to CA powder.42 The quadratic significance term for microwave power means little change in response, although the microwave power changed within the experimental range. The optimal conditions that provided the maximum yields of MS and AS were X1 = 30 s, X2 = 300 W, and X3 = 20 g mL−1. The equation models were validated by experiments, as shown in Table 6. The accuracy of the model was calculated and was 81.2% for MS and 86.8% for AS, which indicated the reliability of the models.

At the optimum conditions of MS and AS extraction, AMW60 and 80% (v/v) EtOH were utilized as solvents. The results showed 80% (v/v) EtOH yielded MS and AS of 12.1 ± 0.88 mg g−1 and 7.31 ± 0.27 mg g−1 dry weights, respectively, while AMW60 yielded MS (23.4 ± 0.33 mg g−1 dry weights) and AS (12.9 ± 0.29 mg g−1 dry weights). The yields of extraction using AMW60 were more than 80% (v/v) EtOH for 1.9 fold and 1.8 fold of MS and AS, respectively. The green color of the extract was obtained when 80% EtOH was used, whereas the color was fade with AMW60 solvent (ESI, Fig. S3†). The results showed that the yields of MS and AS were relatively similar to those in a previous study,2 which yielded 23.09 ± 0.12 mg g−1 dry weight for MS and 10.76 ± 0.11 mg g−1 dry weight for AS. However, this study took approximately 10-fold less time to perform MAE. Therefore, the efficiency of NADES coupled with MAE has the potential to reduce the time and energy of extraction without loss of extraction efficacy.
3.4 Determination of the intensity of chlorophyll and antioxidant activity
The chlorophyll content of the CA extracts was determined using a microplate spectrophotometer (Eon™, BioTek Instruments, Inc., VT, USA) at 660 nm. The comparative absorbance showed the response of the relative chlorophyll content in all extracts. The results showed the lowest absorbance of chlorophyll in the NADES-derived CA extract, while the absolute EtOH-derived extract produced the highest absorbance of chlorophyll (Table 7). NADESs, including malic acid and acetylcholine chloride, were quite polar, which limited chlorophyll solubility. These acids also induced the degradation of chlorophyll to phytons, resulting in reduced extract coloration. The degradation of chlorophyll under acidic conditions was reported in previous research, in which decreased pH increased the rate constant of chlorophyll degradation and affected the visual green color loss of chlorophyll.43 The mechanism of acid on chlorophyll degradation can be explained by acid promoting the conversion process of chlorophyll into pheophytin and pheophorbide,44 which occurs via the magnesium substitution mechanism.| Extracts | The absorbancea of chlorophyll at 660 nm | Antioxidant activityb (IC50) |
|---|---|---|
| a The absorbances of every extract were subtracted from the absorbances of their solvent as a blank.b The CA powders (0.1 g) were extracted using MAE (20 s of radiation time, 450 W of microwave power, and 20 mL g−1 LS ratio) and then prepared into various concentrations in 50% (v/v) EtOH as the working solution for the DPPH assay. | ||
| Water | 0.348 | 1.50 mg mL−1 |
| 20% (v/v) EtOH | 0.400 | 0.37 mg mL−1 |
| 40% (v/v) EtOH | 0.165 | 0.44 mg mL−1 |
| 60% (v/v) EtOH | 0.391 | 0.40 mg mL−1 |
| 80% (v/v) EtOH | 1.709 | 0.99 mg mL−1 |
| Absolute EtOH | 2.033 | 4.30 mg mL−1 |
| AMW60 | 0.088 | 0.26 mg mL−1 |
| Rutin (positive control) | — | 34.8 μg mL−1 |
The antioxidant activity of CA, MS, and AS leads to various pharmacological effects, such as cell protection, wound healing, and neuroprotection.45–48 Usually, the antioxidant activity is related to the triterpene content in the extract. In addition, the antioxidant activity of CA is contributed by flavonoid compounds such as castilliferol, castillicetin, kaempferol-3-p-coumarate, and quercetin-3-caffeate.49 In this study, rutin was used as a positive control and showed an IC50 of 34.8 μg mL−1. The antioxidant activity of the AMW60 extract was higher than that of the aqueous EtOH extract, which was related to the MS and AS contents. From these results, we conclude that NADESs were efficient for CA extraction, which recovers both MS and AS, CA antioxidation potential.49
4. Conclusions
NADES (AMW60) was chosen as the optimal solvent for extraction because it produced the highest yields of MS and AS. In this study, NADESs showed a greater extraction efficiency and antioxidant activity than conventional solvents. In addition, the NADES-base extracts were less colored than those obtained with conventional solvents, which indicated the limited extraction or degradation of chlorophyll in the samples. The parameters of MAE, radiation time (10, 20, and 30 s), microwave power (300, 450, and 600 W), and LS ratio (20, 30, and 40 mL g−1) were used for optimization by CCD of RSM. The responses, including MS and AS yield, were fitted with a quadratic model with R2 and adjusted R2 values close to 1. The lack of fit was nonsignificant, which meant the models accurately fit the data. The comparison between each point of actual and predicted value approached the linear regression line, implying high accuracy of prediction. The equation model was validated by an experiment that showed an accuracy percentage of more than 80%. This study revealed an environmentally friendly process for CA extraction using an NADES coupled with MAE. NADESs have many adv antages, such as low toxicity, low cost, high extraction efficiency, and high antioxidant activity. Moreover, MAE is effective in creating superheating for the disruption of the cell wall and the release of bioactive compounds into the solvent while using a shorter time than that of the conventional method and EtOH-based MAE. The extract using the developed NADES produced less chlorophyll coloration in the extraction than when using conventional solvents, which will allow for the easy formulation of the extract as topical medicine and cosmeceutical for cosmetics. Both NADES and MAE are interesting when used in a green extraction process. Moreover, this process is possible for use on a large scale in the industry.Author contributions
Conceptualization, funding acquisition, experimental design, investigation, and writing of the original draft were performed by Suppalak Phaisan. Fonthip Makkliang performed the investigation and data curation. Waraporn Putalun and Seiichi Sakamoto provided some resources and supervision. Gorawit Yusakul conceptualized, administered, reviewed, and edited the manuscript.Conflicts of interest
There are no conflicts to declare.Acknowledgements
This research was financially supported by the personal research grant [grant number WU-IRG-62-024]. In addition, this research was financially supported by the new strategic research project (P2P), Walailak University, Thailand. The authors also would like to thank the facilities and support of the center for scientific and technological equipment, Walailak University, Thailand.References
- P. Puttarak, P. Dilokthornsakul, S. Saokaew, T. Dhippayom, C. Kongkaew, R. Sruamsiri, A. Chuthaputti and N. Chaiyakunapruk, Sci. Rep., 2017, 7, 10646 CrossRef.
- B. Yingngam, A. Chiangsom and A. Brantner, Ind. Crops Prod., 2020, 147, 112231 CrossRef CAS.
- P. Puttarak and P. Panichayupakaranant, Pharm. Biol., 2012, 50, 1508–1512 CrossRef CAS.
- N. E. Gray, A. Alcazar Magana, P. Lak, K. M. Wright, J. Quinn, J. F. Stevens, C. S. Maier and A. Soumyanath, Phytochem. Rev., 2018, 17, 161–194 CrossRef CAS.
- N. J. Chong and Z. Aziz, J. Evidence-Based Complementary Altern. Med., 2013, 2013, 627182 Search PubMed.
- W. Bylka, P. Znajdek-Awizen, E. Studzinska-Sroka, A. Danczak-Pazdrowska and M. Brzezinska, Phytother. Res., 2014, 28, 1117–1124 CrossRef CAS.
- A. Saeidinia, F. Keihanian, A. P. Lashkari, H. G. Lahiji, M. Mobayyen, A. Heidarzade and J. Golchai, Medicine, 2017, 96, e6168 CrossRef CAS.
- V. Paocharoen, J. Med. Assoc. Thailand, 2010, 93(suppl. 7), S166–S170 Search PubMed.
- K. Jenwitheesuk, P. Rojsanga, B. Chowchuen and P. Surakunprapha, J. Evidence-Based Complementary Altern. Med., 2018, 2018, 9525624 Search PubMed.
- F. Pittella, R. C. Dutra, D. D. Junior, M. T. Lopes and N. R. Barbosa, Int. J. Mol. Sci., 2009, 10, 3713–3721 CrossRef CAS.
- Y. Zhao, P. Shu, Y. Zhang, L. Lin, H. Zhou, Z. Xu, D. Suo, A. Xie and X. Jin, Oxid. Med. Cell. Longevity, 2014, 2014, 154295 Search PubMed.
- C. Monton, S. Settharaksa, C. Luprasong and T. Songsak, Rev. Bras. Farmacogn., 2019, 29, 254–261 CrossRef CAS.
- A. Delazar, L. Nahar, S. Hamedeyazdan and S. D. Sarker, in Natural Products Isolation, ed. S. D. Sarker and L. Nahar, Humana Press, Totowa, NJ, 2012, pp. 89–115, DOI:10.1007/978-1-61779-624-1_5.
- Z. Karami, Z. Emam-Djomeh, H. A. Mirzaee, M. Khomeiri, A. S. Mahoonak and E. Aydani, J. Food Sci. Technol., 2015, 52, 3242–3253 CAS.
- C. G. González, N. R. Mustafa, E. G. Wilson, R. Verpoorte and Y. H. Choi, Flavour Fragrance J., 2018, 33, 91–96 CrossRef.
- M. Faggian, S. Sut, B. Perissutti, V. Baldan, I. Grabnar and S. Dall’Acqua, Molecules, 2016, 21, 1531 CrossRef.
- Y. Dai, R. Verpoorte and Y. H. Choi, Food Chem., 2014, 159, 116–121 CrossRef CAS.
- A. Ali Redha, J. Agric. Food Chem., 2021, 69, 878–912 CrossRef CAS.
- Y. Liu, J. Li, R. Fu, L. Zhang, D. Wang and S. Wang, Ind. Crops Prod., 2019, 140, 111620 CrossRef CAS.
- E. Tommasi, G. Cravotto, P. Galletti, G. Grillo, M. Mazzotti, G. Sacchetti, C. Samorì, S. Tabasso, M. Tacchini and E. Tagliavini, ACS Sustainable Chem. Eng., 2017, 5, 8316–8322 CrossRef CAS.
- Y. H. Choi and R. Verpoorte, Curr. Opin. Food Sci., 2019, 26, 87–93 CrossRef.
- Y. Xie, H. Liu, L. Lin, M. Zhao, L. Zhang, Y. Zhang and Y. Wu, RSC Adv., 2019, 9, 22677–22684 RSC.
- T. Bosiljkov, F. Dujmic, M. C. Bubalo, J. Hribar, R. Vidrih, M. Brncic, E. Zlatic, I. R. Redounikavic and S. Jokic, Food Bioprod. Process., 2017, 102, 195–203 CrossRef CAS.
- M. Ruesgas-Ramon, M. C. Figueroa-Espinoza and E. Durand, J. Agric. Food Chem., 2017, 65, 3591–3601 CrossRef CAS.
- P. Puttarak and P. Panichayupakaranant, Nat. Prod. Res., 2013, 27, 684–686 CrossRef CAS.
- N. H. Ramli, S. Yusup, A. T. Quitain, K. Johari and B. W. Bin Kueh, Sustainable Chem. Pharm., 2019, 11, 23–35 CrossRef.
- M. H. Rafamantanana, E. Rozet, G. E. Raoelison, K. Cheuk, S. U. Ratsimamanga, P. Hubert and J. Quetin-Leclercq, J. Chromatogr. B: Anal. Technol. Biomed. Life Sci., 2009, 877, 2396–2402 CrossRef CAS.
- H. K. Lichtenthaler, in Plant Cell Membranes, Academic Press, 1987, vol. 148, pp. 350–382 Search PubMed.
- S. Phaisan, G. Yusakul, A. Sakdamas, N. Taluengjit, S. Sakamoto and W. Putalun, Songklanakarin J. Sci. Technol., 2020, 42, 1084–1090 CAS.
- Y. Dai, G. J. Witkamp, R. Verpoorte and Y. H. Choi, Food Chem., 2015, 187, 14–19 CrossRef CAS.
- J. González-Rivera, E. Husanu, A. Mero, C. Ferrari, C. Duce, M. R. Tinè, F. D’Andrea, C. S. Pomelli and L. Guazzelli, J. Mol. Liq., 2020, 300, 112357 CrossRef.
- K. Ghanemi, M. A. Navidi, M. Fallah-Mehrjardi and A. Dadolahi-Sohrab, Anal. Methods, 2014, 6, 1774–1781 RSC.
- F. Uberti, V. Morsanuto, S. Ghirlanda, S. Ruga, N. Clemente, C. Boieri, R. Boldorini and C. Molinari, Adv. Wound Care, 2018, 7, 121–133 CrossRef.
- M. Sloniecka, L. J. Backman and P. Danielson, Int. Immunopharmacol., 2015, 29, 57–62 CrossRef CAS.
- B. Lee, J. Heo, S. Hong, E. Y. Kim, Y. J. Sohn and H. S. Jung, Immunopharmacol. Immunotoxicol., 2019, 41, 614–621 CrossRef.
- Y. Dai, J. van Spronsen, G. J. Witkamp, R. Verpoorte and Y. H. Choi, Anal. Chim. Acta, 2013, 766, 61–68 CrossRef CAS.
- C. Pengdee, B. Sritularak and W. Putalun, S. Afr. J. Bot., 2020, 132, 423–431 CrossRef CAS.
- V. Mandal, K. Sen, K. Singh Chouhan, R. Tandey and R. Mehta, Pharmacogn. Mag., 2019, 15, 267–273 CrossRef.
- J. Tang, J. Food Sci., 2015, 80, E1776–E1793 CrossRef CAS.
- R. Y. Krishnan and K. S. Rajan, Braz. J. Chem. Eng., 2017, 34, 885–899 CrossRef CAS.
- A. Chahyadi and A. Elfahmi, Saudi Pharm. J., 2020, 28, 1466–1473 CrossRef CAS.
- C. H. Chan, R. Yusoff, G. C. Ngoh and F. W. Kung, J. Chromatogr. A, 2011, 1218, 6213–6225 CrossRef CAS.
- N. Koca, F. Karadeniz and H. S. Burdurlu, Food Chem., 2007, 100, 609–615 CrossRef CAS.
- M. I. Gunawan and S. A. Barringer, J. Food Process. Preserv., 2000, 24, 253–263 CrossRef.
- Y. Ling, Q. Gong, X. Xiong, L. Sun, W. Zhao, W. Zhu and Y. Lu, Oncotarget, 2017, 8, 51066–51075 CrossRef.
- M. Liu, Y. Dai, Y. Li, Y. Luo, F. Huang, Z. Gong and Q. Meng, Planta Med., 2008, 74, 809–815 CrossRef CAS.
- Y. Luo, Y. P. Yang, J. Liu, W. H. Li, J. Yang, X. Sui, X. Yuan, Z. Y. Nie, Y. Q. Liu, D. Chen, S. H. Lin and Y. A. Wang, Brain Res., 2014, 1565, 37–47 CrossRef CAS.
- Y. Luo, C. Fu, Z. Wang, Z. Zhang, H. Wang and Y. Liu, Mol. Med. Rep., 2015, 12, 8294–8300 CrossRef CAS.
- R. Subban, A. Veerakumar, R. Manimaran, K. M. Hashim and I. Balachandran, J. Nat. Med., 2008, 62, 369–373 CrossRef CAS.
Footnote |
| † Electronic supplementary information (ESI) available. See DOI: 10.1039/d0ra09934a |
| This journal is © The Royal Society of Chemistry 2021 |