
 Open Access Article
 This Open Access Article is licensed under a Creative Commons Attribution-Non Commercial 3.0 Unported Licence
Hyperbranched polyamide modified graphene oxide-reinforced polyurethane nanocomposites with enhanced mechanical properties
Yahao Liua,
Jian Zheng*a,
Xiao Zhang *b,
Yongqiang Dua,
Guibo Yua,
Ke Lic,
Yunfei Jiaa and
Yu Zhanga
*b,
Yongqiang Dua,
Guibo Yua,
Ke Lic,
Yunfei Jiaa and
Yu Zhanga
aShijiazhuang Campus of Army Engineering University, Shijiazhuang 050003, China. E-mail: zhengj2020@163.com
bEngineering University of PAP, Xi'an 710086, China. E-mail: zxleo@foxmail.com
cCollege of Naval Architecture and Ocean Engineering, Naval University of Engineering, Wuhan 430033, China
First published on 16th April 2021
Abstract
As is well known, it is difficult to simultaneously improve both the strength and elongation at break of polymers filled with nanomaterials. This work obtained high-performance composites with enhanced strength and elongation at break via cross-linking hydroxyl-terminated polybutadiene (HTPB) chains with hyperbranched-polyamide-modified graphene oxide (HGO), and the preparation, characterization, and mechanical properties of the composites serving as a composite solid-propellant binder have been described in detail. Compared with pure HTPB polyurethane (P-HTPB), the tensile strength and elastic modulus of the composite containing 0.1 wt% HGO (H-0.1/HTPB) increase by 57.8% and 65.3%, respectively. Notably, the elongation at break of the H-0.1/HTPB composite can reach up to 1292.6%, which is even higher than that of P-HTPB. Moreover, the capabilities of the composites to resist deformation have also been enhanced significantly. The glass transition temperatures of the composites are still extremely low (∼−73 °C), which is beneficial for their applications. It can be expected that this study can provide an effective fabrication approach and strategy for preparing high-performance polyurethane composites.
1. Introduction
Many studies have determined that the strength and elongation of a polymer filled with nanomaterials are a pair of contradicting mechanical properties.1,2 In other words, it is difficult to simultaneously improve both the strength and elongation of a polymer filled with nanomaterials. This contradiction has aroused widespread concern in the polymer field.HTPB-based polyurethane (PU) is an important kind of polymeric material that has been widely applied in numerous areas, such as adhesives, coatings, and composite solid-propellants.3–6 Owing to its outstanding elasticity, toughness, and chemical resistance, and its sub-ambient glass transition temperature (Tg),3,7–11 HTPB-based PU has been regarded as one of the most suitable binders for composite solid-propellants.12 It connects the oxidant and other fuel additives dispersed in composite solid-propellants via forming a PU network upon reacting with diisocyanate.13 Consequently, the mechanical properties of HTPB-based propellants are largely determined based on the properties of HTPB-based PU. Therefore, one viable avenue for enhancing the properties of propellants is to improve the mechanical properties of HTPB-based PU. To date, numerous strategies for improving the mechanical performance of PU have been adopted, such as chemical modification,3 nanoparticle addition,1,14 and cross-linking network reinforcement,15 in which carbon-based nanomaterials have been deemed as considerably promising reinforcing materials.2
Graphene oxide (GO), as a specific derivative of graphene, has been considered as a promising reinforcer for helping polymer nanocomposites to achieve high strength because of its remarkable properties,16–18 including unique electrical, thermal and mechanical properties.19–22 However, it has been reported that GO tends to aggregate in the polymeric matrix, which is ascribed to its large specific surface area and the strong van der Waals forces between carbon layers.1,23 Current thinking suggests that a key route to effectively enhancing the properties of GO-based polymer composites is achieving the uniform dispersion of GO and strong interfacial interactions between GO and the polymeric matrix.24 Compared with other nanofillers like carbon nanotubes,25,26 graphite nanoplates,27–29 montmorillonite,30 and graphene,31–33 there are abundant oxygen-containing groups (e.g., carboxyl, hydroxyl, and epoxide groups) on the surface of GO,34 which possess the potential to undergo chemical reactions with the matrix. Currently, covalent crosslinking between these active groups and the polymer matrix, with specific modifiers as connectors, has been proved to be an effective strategy for addressing the above-mentioned issues.1,35
Recently, hyperbranched polymers with three-dimensional branching structures, abundant reactive terminal groups, and nonentangled architectures36–38 have aroused increasing attention in relation to reinforcing polymer matrices.39–41 Meanwhile, as a result of their low solution viscosity and ultrahigh solubility,42,43 it is expected that hyperbranched polymers could be grafted onto the surface of GO as modifiers to improve the compatibility and interfacial interactions of GO with the polymer matrix;44 this may provide a promising reinforcer for propellant binder.
Herein, we successfully synthesized amine-terminated hyperbranched-polyamide-modified GO (HGO) via a facile “grafted to” method. HGO-reinforced polyurethane composites were fabricated through a cross-linking reaction between HGO and a polyurethane curing agent. To verify the effectiveness of surface modification, various characterization methods were used on HGO. Furthermore, the mechanical properties of the obtained composites were investigated through different approaches. Meanwhile, the reinforcing mechanism was studied to better understand the effects of HBPA grafted on GO.
2. Materials and experiments
2.1. Materials
Monolayer GO with a purity of >99% was obtained from Nanjing XFNANO Material Technology Co., Ltd, China. Hydroxyl-terminated polybutadiene (HTPB, 99.9%, hydroxyl value: 1.42 mmol g−1) was purchased from Liming Research & Design Institute of Chemical Industry Co., Ltd, Luoyang, China. Isophorone diisocyanate (IPDI, 99%) and triphenylbismuthine (TPB) were obtained from Macklin Biochemical Technology Co., Ltd, Shanghai, China. Dibutyl phthalate (DBP, 99.5%), N,N-dimethylformamide (DMF, ≥99.8%), and ethanol (EA, ≥99.7%) were obtained from Damao Chemical Reagent Factory, Tianjin, China and were used directly. O-(7-Azabenzotriazole-1-yl)-N,N,N,N′-tetramethyluronium hexafluorophosphate (HATU, 99%) was purchased from Aladdin Co., Shanghai, China. Amino-terminated hyperbranched polyamide (HBPA) was supplied by Wuhan Hyperbranched Polymers Science & Technology Co., Ltd, China.2.2. Preparation of HGO
In a typical procedure, 100 mg of GO was firstly suspended in 30 mL of DMF, followed by stirring and sonication for 1 h to obtain a well-exfoliated GO suspension. Meanwhile, HBPA (1.0 g) was dissolved in 20 mL of DMF under sonication for 10 min. Subsequently, the GO suspension was added to HBPA solution and sonicated for 30 min. After that, 10 mg of HATU was dispersed in the obtained mixture, which was then continuously sonicated for 3 h at room temperature. Afterwards, the modified GO was separated via centrifuging and washed with excess ethanol at least four times in order to remove other molecules. Finally, the obtained product was dried under vacuum at 60 °C for 24 h and referred to as HGO.2.3. Fabrication of HGO/HTPB composites
HGO/HTPB composites was fabricated using a typical solution blending method. There are four steps, as follows. (1) 3 mg (0.1 wt%) of HGO was dispersed in DMF through sonication for 1 h to obtain a uniform HGO suspension. Note that all wt% values in this paper refer to the weight of HTPB. (2) The HTPB prepolymer was mixed with the obtained HGO suspension under mechanical stirring at 50 °C for 12 h. (3) 13 wt% DBP, 11.5 wt% IPDI, and 0.1 wt% TPB were introduced, followed by mechanical stirring and vacuum degassing. (4) The prepared mixture was injected into PTEF molds and put into an oven for curing for 36 h at 60 °C; after that, the HGO/HTPB composite was obtained, and it was denoted as H-0.1/HTPB. In addition, pure HTPB-based polyurethane and HTPB-based composites with different mass fractions of GO and HGO were also fabricated via an identical route. Fig. 1 shows a schematic illustration of the preparation of composites, and it is clear that the color of the HGO/HTPB composites becomes darker and much deeper than the GO/HTPB composite due to the disappearance of carboxyl from GO surface. For convenience, pure HTPB-based polyurethane is denoted as P-HTPB, the GO-filled HTPB composites are denoted as G-x/HTPB, and the HGO-filled HTPB composites are denoted as H-x/HTPB, where x (0.05, 0.1, 0.15, 0.2, or 0.3) is the mass fraction of GO or HGO.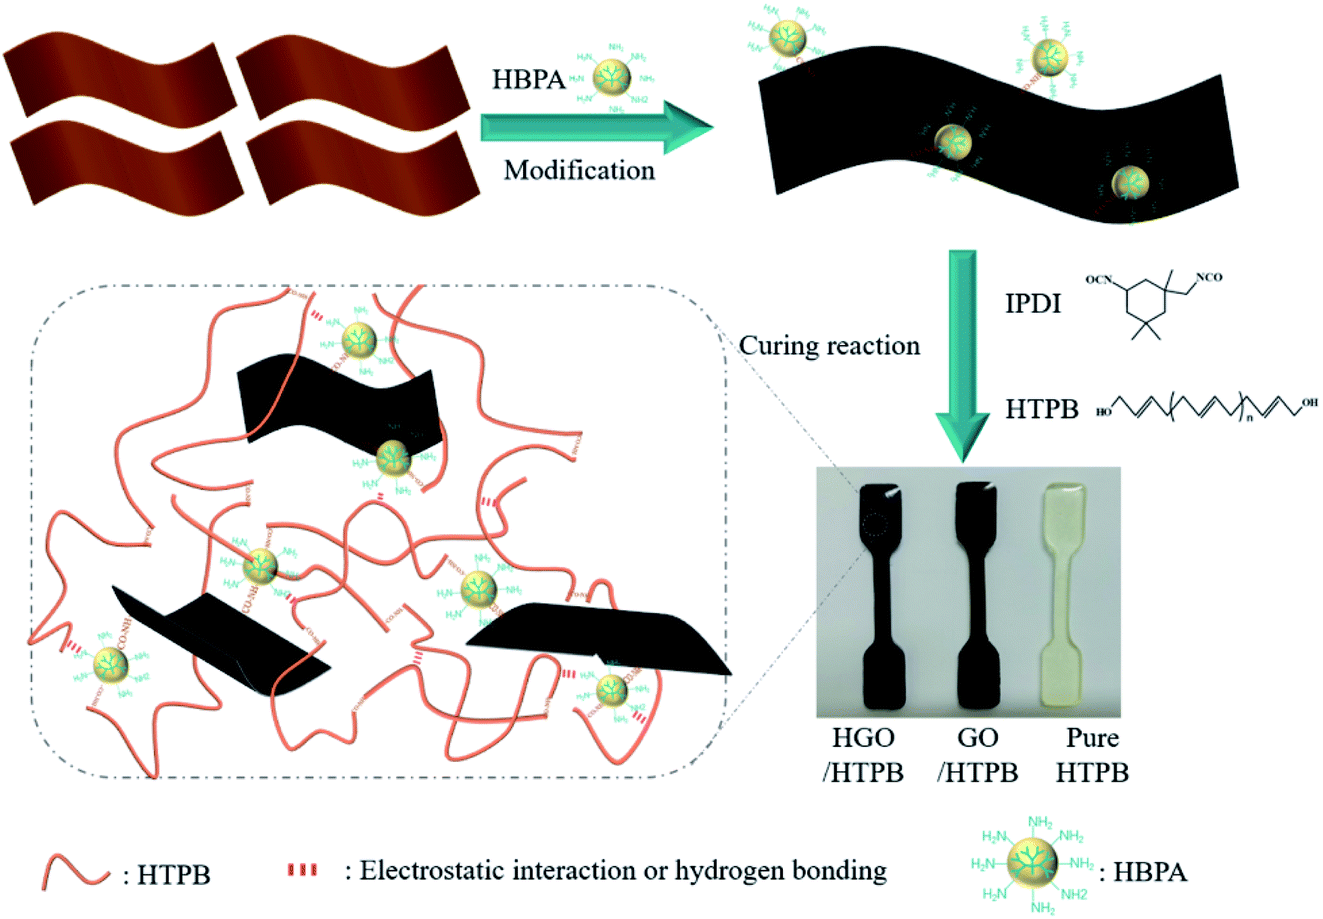 | ||
| Fig. 1 A schematic illustration of the preparation of the composites. | ||
2.4. Characterization
Fourier transform infrared spectroscopy (FTIR) measurements were conducted using an infrared spectrometer (Tensor II, Bruker) in the wavenumber range of 500–4000 cm−1. X-ray diffraction (XRD) studies were performed using a Persée XD6 diffractometer with a scanning speed of 10° min−1 from 5° to 60°. The interlayer spacings of GO and HGO were obtained using Bragg's Law (2d![[thin space (1/6-em)]](https://www.rsc.org/images/entities/char_2009.gif) sinθ = nλ).45 The chemical composition was determined via X-ray photoelectron spectroscopy (XPS, ThermoFischer, ESCALAB 250XI) using Al Kα radiation. The binding energies in XPS measurements are corrected via referencing the C 1s peak to 284.5 eV. The Raman spectra were obtained using a Raman spectrometer (inVia, Renishaw) with laser excitation at 532 nm. The microstructures and morphologies of GO and HGO were observed via transmission electron microscopy (TEM, JSM-2100F, JEOL), scanning electron microscopy (SEM, JSM-7800F, JEOL), and atomic force microscopy (AFM, Nano Man VS, Bruker). Scanning transmission electron microscopy (STEM) images and the elemental mapping of HGO were obtained using JSM-2100F apparatus (JEOL). Thermogravimetric analysis (TGA, SDT Q600, TA Instrument) was performed at a heating rate of 10 °C min−1 under a nitrogen atmosphere. Mechanical tests were carried out using Instron 5982 apparatus at a rate of 100 mm min−1. Creep experiments were performed using DMA Q800 apparatus at 30 °C with a creep stress of 0.02 MPa. The creep stress of 0.02 MPa was loaded during the creep period and maintained for 10 minutes, followed by recovery for 10 minutes; this process was repeated 3 times. The thermal properties of the composites were studied using a differential scanning calorimeter (DSC Q20, TA Instruments) under a nitrogen atmosphere, and the heating rate was set at 10 °C min−1 in the temperature range of −90 °C to 40 °C.
sinθ = nλ).45 The chemical composition was determined via X-ray photoelectron spectroscopy (XPS, ThermoFischer, ESCALAB 250XI) using Al Kα radiation. The binding energies in XPS measurements are corrected via referencing the C 1s peak to 284.5 eV. The Raman spectra were obtained using a Raman spectrometer (inVia, Renishaw) with laser excitation at 532 nm. The microstructures and morphologies of GO and HGO were observed via transmission electron microscopy (TEM, JSM-2100F, JEOL), scanning electron microscopy (SEM, JSM-7800F, JEOL), and atomic force microscopy (AFM, Nano Man VS, Bruker). Scanning transmission electron microscopy (STEM) images and the elemental mapping of HGO were obtained using JSM-2100F apparatus (JEOL). Thermogravimetric analysis (TGA, SDT Q600, TA Instrument) was performed at a heating rate of 10 °C min−1 under a nitrogen atmosphere. Mechanical tests were carried out using Instron 5982 apparatus at a rate of 100 mm min−1. Creep experiments were performed using DMA Q800 apparatus at 30 °C with a creep stress of 0.02 MPa. The creep stress of 0.02 MPa was loaded during the creep period and maintained for 10 minutes, followed by recovery for 10 minutes; this process was repeated 3 times. The thermal properties of the composites were studied using a differential scanning calorimeter (DSC Q20, TA Instruments) under a nitrogen atmosphere, and the heating rate was set at 10 °C min−1 in the temperature range of −90 °C to 40 °C.
3. Results and discussion
3.1. Morphological characterization of HGO
In the modification procedure, the –NH2 groups of HBPA can react with the carboxyl groups of GO and graft onto its surface. After modification, the color of GO changed from brown to black in the case of HGO (Fig. 2(a)). We speculate that the reason for this phenomenon is mainly due to the consumption of carboxyl group and epoxy groups, agreeing with previous work.44,46 The effectiveness of the functionalization of GO with HBPA was determined based on FTIR spectra. As shown in Fig. 2(b), the characteristic absorption peaks of GO at 1728 cm−1, 1628 cm−1, and 1053 cm−1 correspond to the stretching vibrations of C![[double bond, length as m-dash]](https://www.rsc.org/images/entities/char_e001.gif) O from carboxylic groups,47 CC, and C–O–C, respectively, and the wide absorption peak at 3300–3000 cm−1 can be ascribed to the stretching vibrations of O–H from hydroxyl and carboxylic acid groups.35,48 In the case of HGO, both carboxyl and epoxy groups can react with –NH2, leading to the peaks at 1728 cm−1 and 1053 cm−1 decreasing significantly. Meanwhile, some new absorption peaks appeared at 3250 cm−1, 2959–2850 cm−1, 1640 cm−1, and 1555 cm−1. It is noteworthy that the features of the HGO spectrum are similar to those of the HBPA spectrum after modification. In addition, these new peaks are assigned to the stretching vibrations of N–H groups, the stretching vibrations of –CH3 and –CH2 groups, amide CO stretching (amide I), and amide N–H bending and C–N stretching (amide II), respectively, implying that GO was successfully modified with HBPA via reactions between the terminal amine groups of HBPA and the carboxylic acid groups of GO.46,49
O from carboxylic groups,47 CC, and C–O–C, respectively, and the wide absorption peak at 3300–3000 cm−1 can be ascribed to the stretching vibrations of O–H from hydroxyl and carboxylic acid groups.35,48 In the case of HGO, both carboxyl and epoxy groups can react with –NH2, leading to the peaks at 1728 cm−1 and 1053 cm−1 decreasing significantly. Meanwhile, some new absorption peaks appeared at 3250 cm−1, 2959–2850 cm−1, 1640 cm−1, and 1555 cm−1. It is noteworthy that the features of the HGO spectrum are similar to those of the HBPA spectrum after modification. In addition, these new peaks are assigned to the stretching vibrations of N–H groups, the stretching vibrations of –CH3 and –CH2 groups, amide CO stretching (amide I), and amide N–H bending and C–N stretching (amide II), respectively, implying that GO was successfully modified with HBPA via reactions between the terminal amine groups of HBPA and the carboxylic acid groups of GO.46,49
 | ||
| Fig. 2 (a) Images of GO and HGO powder. (b) FTIR spectra of GO, HGO, and HBPA. (c) XRD spectra and (d) Raman spectra of GO and HGO. | ||
The XRD spectra of GO and HGO are shown in Fig. 2(c). Due to the existence of functional groups, the XRD spectrum of GO displays a broad diffraction peak at 2θ = 10.46°, corresponding to an interlayer spacing of approximately 0.85 nm. Due to the incorporation of HBPA onto the surface of GO, the 2θ peak of HGO was shifted down to 9.05°, indicating a larger interlayer spacing of 0.97 nm. The grafting of HBPA onto the GO surface allows HBPA to be inserted between the GO layers, thus increasing the interlayer spacing. Moreover, a new broad peak appears at 2θ = 18.57°, which suggests that the HGO sheets are loosely stacked during the modification process.44,50 This result further proves the successful functionalization of GO.
Raman spectroscopy was employed to further investigate the structural characteristics, and the obtained results are shown in Fig. 2(d). As we can see, the Raman spectrum of GO exhibits two peaks at around 1352 cm−1 (D band) and 1588 cm−1 (G band), which are associated with sp3-hybridized carbon or structural defects and the vibration of sp2-hybridized graphitic domains, respectively.51 Additionally, the HGO spectrum displays a G band with a lower Raman shift (1582 cm−1) than that of GO, suggesting strong interactions between HPBA and GO sheets.52 It is known that the peak intensity ratio of the D and G bands (ID/IG) is related to the disordered structures of carbon, and a lower ID/IG ratio corresponds to fewer defects.53 After functionalization, the ID/IG value of HGO slightly increases from 0.926 for GO to 1.007. Graphene is made up of one-atom thick and two-dimensional (2D) sheets of honeycomb-arrayed sp2-bonded carbon.35 After being oxidized to GO, the surface defects and sp3 domains increase, increasing the D peak intensity. The functionalization of GO introduces more structural defects onto its surface, further leading to an increase in the intensity of the D peak and thereby increasing the ID/IG value.51,52 Obviously, more sp3 domains and defects are formed, reflecting successful modification with HBPA.
The surface compositions of GO and HGO were further evaluated via XPS. As shown in Fig. 3(a), the XPS spectrum of GO shows a C 1s peak at 284.5 eV and an O 1s peak at 533 eV. After modification, a clear N 1s peak appears at 399.3 eV in the spectrum of HGO, implying a reaction between GO and HBPA. In addition, it is apparent that the C 1s/O 1s intensity ratio of HGO is relatively higher than that of GO. The C 1s spectra of GO and HGO are displayed in Fig. 3(b) and (c), respectively. The C 1s spectrum of GO exhibits five chemical components: CC/C–C (284.5 eV), C–OH (285.1 eV), CO (286.6 eV), C–O–C (287.1 eV), and C(O)–O (288.6 eV). As for HGO, the C(O)–O and C–O–C peak intensities decreased significantly due to the reaction of –COOH and C–O–C groups with –NH2 groups. It is indicated that the C–O–C and –COOH groups only partially reacted with –NH2, and some of these groups are still present in HGO, which is consistent with the FTIR results. In addition, a new peak, which can be ascribed to C–N groups, appears at 285.9 eV, indicating the successful covalent grafting of HBPA. Furthermore, the N 1s spectrum of HGO presents three chemical components, as seen in Fig. 3(d): –NH2 (398.9 eV), C(O)–NH (399.6 eV), and NH3+–C (400.9 eV).46 These results demonstrate that HBPA has been successfully grafted onto GO, and HGO possesses the ability to react with IPDI due to the existence of –NH2; this is in good agreement with the FTIR results.
 | ||
| Fig. 3 (a) XPS survey spectra of GO and HGO. (b) The high-resolution C 1s XPS spectrum of GO. (c) The high-resolution C 1s XPS spectrum of HGO. (d) The high-resolution N 1s XPS spectrum of HGO. | ||
The morphological structures were also investigated via SEM, TEM, and AFM. As shown in Fig. 4(a), the surface of GO looks soft with some wrinkled structures. On the contrary, the surface of HGO seems to be covered with a layer of additional material, which could be attributed to the grafting of HPBA. Moreover, HGO sheets modified with HBPA with a hyperbranched structure and abundant active groups tend to stick together because of strong hydrogen bonding between the abundant reactive terminal groups of HBPA (Fig. 4(b)). Fig. 4(c) and (d) exhibits AFM images of GO and HGO; it is clear that the thickness of HGO is appropriately 4.35 nm, which is thicker than monolayer GO (∼0.8 nm). Furthermore, as we can see from TEM images (Fig. 5), GO sheets display better transparency than HGO, and the obvious increase in the thickness of the nanosheets can also be observed, which is similar to images reported in previous related studies.44,54,55 In addition, the elemental mapping of HGO can further demonstrate its successful modification with HBPA, as presented via STEM images (Fig. 5(c) and (f)). It can be found that nitrogen elements, originating from HBPA, are evenly distributed on its surface.
 | ||
| Fig. 4 SEM images of (a) GO and (b) HGO. AFM images of (c) GO and (d) HGO. | ||
 | ||
| Fig. 5 TEM images of (a, d) GO and (b, e) HGO. (c) A STEM image of HGO and (f) the corresponding elemental mapping of nitrogen. The white arrows indicate the layer thickness. | ||
In addition to the above measurements, TGA was also conducted to confirm the success of the functionalization of GO, from which we can obtain the amount of HPBA grafted on HGO (Fig. 6). It can be seen that there are two main loss stages in the TGA curve of GO. Firstly, the weight loss from 30 °C to 120 °C can be ascribed to the loss of absorbed water. Then, the main weight loss of 40 wt% between 120 °C and 270 °C is due to the decomposition of labile oxygen-containing groups on the surface of GO.56 As for HBPA, there is only one sharp decomposition stage from 200 °C to 460 °C, and the residual weight is only 0.54 wt%. In the case of HGO, the weight loss in the second decomposition stage is significantly reduced compared with that of GO. It can be suggested that in the modification procedure HBPA replaced some oxygen-containing groups via reactions between –COOH of GO and –NH2 of HBPA. Notably, a new decomposition stage for HGO from 200 °C to 450 °C can be observed, which corresponds to the decomposition of grafted HBPA. Combining the results from the abovementioned various data, we confirm that HBPA was successfully grafted onto the surface of GO.
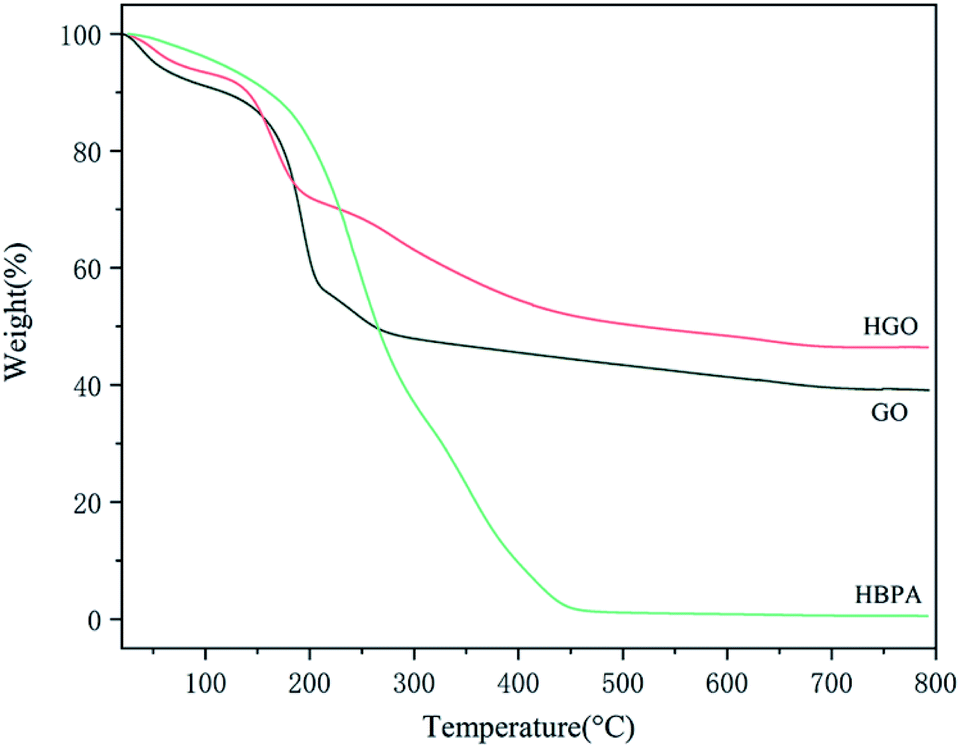 | ||
| Fig. 6 TGA spectra of GO, HGO, and HBPA. | ||
3.2. Morphology characterization of the HGO/HTPB composites
To study the dispersion and interfaces of the nanofiller in the HTPB matrix, cryo-fractured surfaces of these samples were observed using SEM (Fig. 7). As seen in Fig. 7(a), the fracture surface of P-HTPB is quite smooth and flat. For the G-0.1/HTPB composite, some obvious aggregates can be observed, and there are many apparent gaps appearing at the interface, suggesting weak interactions between the GO sheets and the matrix (Fig. 7(b)). Comparatively, the H/HTPB composites exhibit relatively rough cryo-fractured surfaces, and almost no bare HGO sheets were observed. As seen in Fig. 7(c), the HGO sheets are well covered by the matrix and cannot be clearly found on the surface, and the interface between the HGO sheets and HTPB matrix is almost invisible, implying considerable compatibility and strong interfacial bonding between HGO and the matrix. The abundant –NH2 active groups on the surface of HGO can participate in the processes of curing and crosslinking via reacting with the –NCO groups of IPDI molecules, which can promote the formation of strong covalent bonds between the HGO sheets and the matrix. Meanwhile, GO sheets can only form weak physical interactions with the matrix through intermolecular forces, which ultimately leads to differences in their mechanical properties. However, when the HGO content increases to 0.2 wt%, HGO aggregates begin to emerge (Fig. 7(d)). We can deduce that the closer distance between HGO sheets at a higher HGO content can lead to HGO sheets easily reacting with –NCO at both ends of IPDI molecules, which results in aggregates.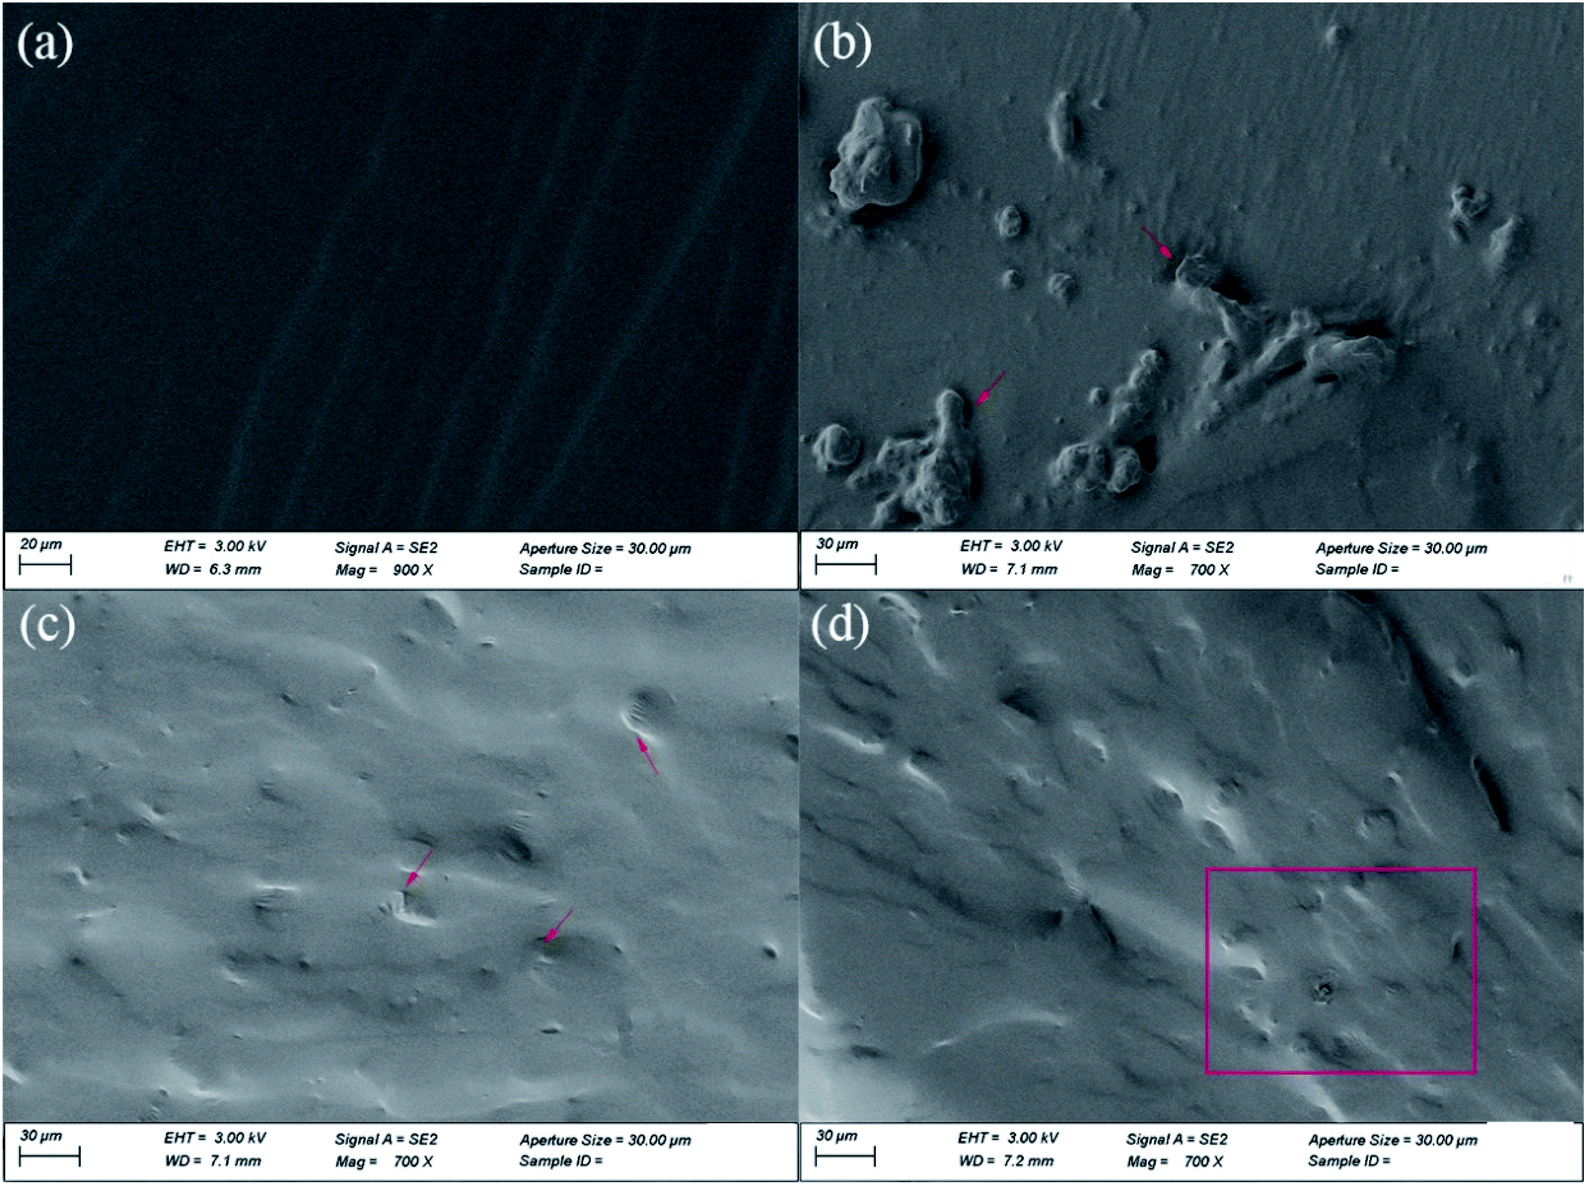 | ||
| Fig. 7 SEM images of the composites: (a) P-HTPB, (b) G-0.1/HTPB, (c) H-0.1/HTPB, and (d) H-0.2/HTPB. The red box and arrows indicate GO and HGO sheets, and aggregates, respectively. | ||
3.3. Mechanical properties of the composites
The mechanical properties of pure HTPB and its composites were investigated. Fig. 8 shows the tensile results. A gradual increase in the elastic modulus values of all composites with respect to nanofiller loading can be observed in Fig. 8(a) and (b). Tensile strength and elongation at break values show a trend of increasing with nanofiller loading, and then decreasing rapidly when the loading is higher than 0.1 wt%. Obviously, the H/HTPB composites display better reinforcement in strength and elongation than the G/HTPB composites. Specifically, when 0.05 wt% nanofiller was added, G-0.05/HTPB and H-0.05/HTPB exhibit tensile strength increases of 31.9% and 33.9%, respectively, relative to P-HTPB. Moreover, the elongation at break of H-0.05/HTPB can reach approximately 1158%, 170% higher than G-0.05/HTPB. In addition, compared to GO, the reinforcement effect of HGO became more remarkable at the same content of 0.1 wt%. The tensile strength of H-0.1/HTPB is near 0.4 MPa, which is 57.8% higher than that of P-HTPB. Meanwhile, it is noteworthy that the elongation at break of H-0.1/HTPB is enhanced simultaneously to 1292.6%, which is 33.4% higher than that of P-HTPB. This is significant and different from the regular phenomenon reported in previous works, which suggests that adding nanofiller into a polymer will decrease the elongation at break.1,57 From SEM images, we infer that this excellent reinforcement effect greatly depends on three aspects: (1) relatively strong interfacial interactions between HGO sheets and the matrix; (2) abundant active groups (–NH2) on the surface, leading to low crosslinking densities in the matrices of the H/HTPB composites; and (3) the unique molecular structure of HBPA.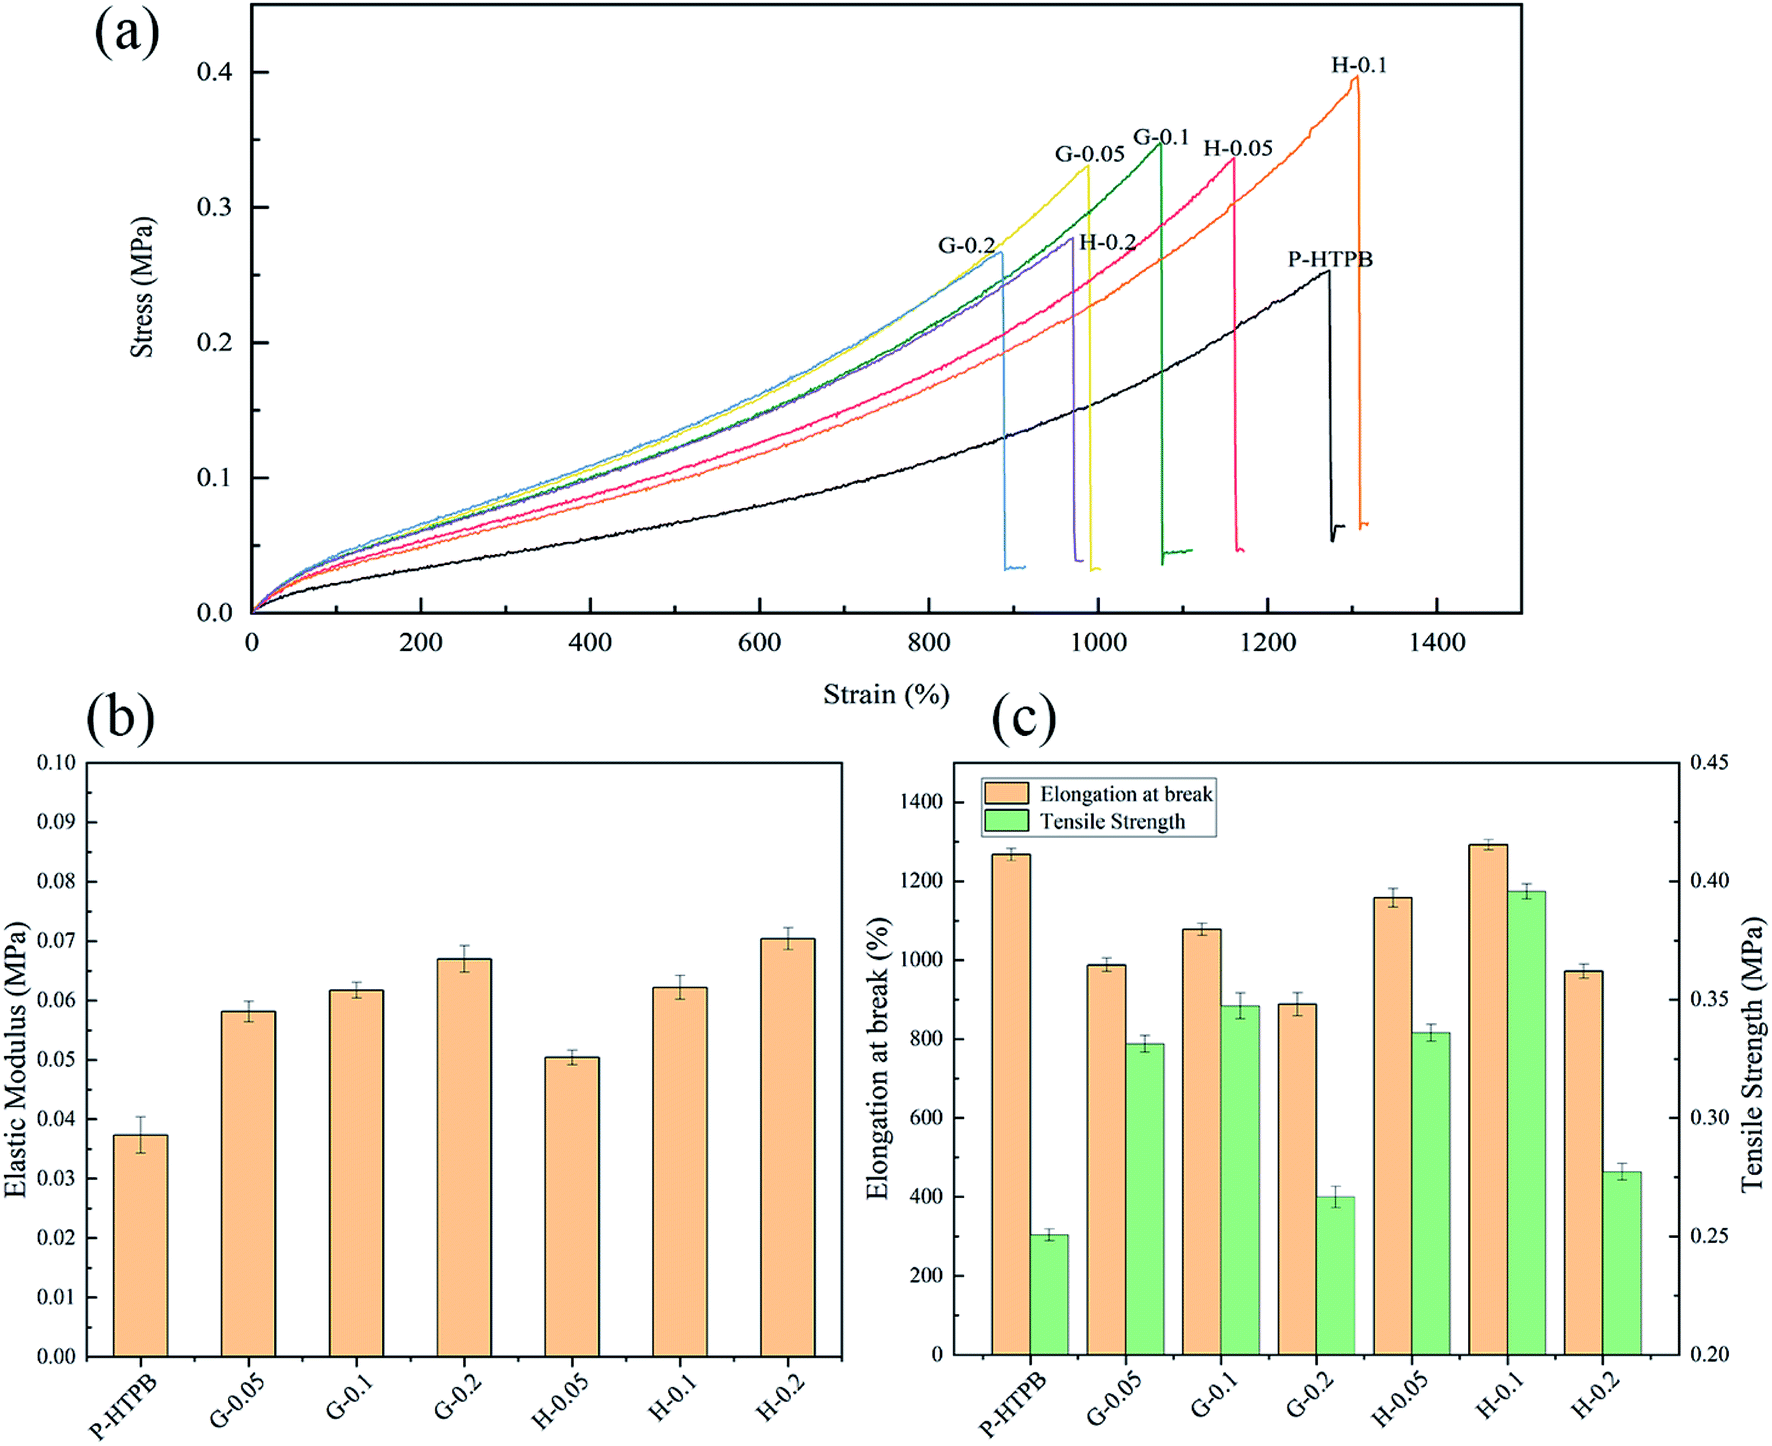 | ||
| Fig. 8 Tensile results for the composites. (a) Stress versus strain curves. (b) Elastic modulus data. (c) Tensile strength and elongation at break values. | ||
Specifically, in our case, abundant active –NH2 groups can react with IPDI molecules to form a strong interface to avoid interfacial debonding. Meanwhile, this reaction will consume some IPDI molecules, and relatively few IPDI molecules remain in the matrix to participate in the curing process, resulting in a low crosslinking density in the matrix. During the tensile process, the strong interface favours stress transfer from the matrix to HGO sheets, improving the strength of the composite, and the relatively low crosslinking density leads to a softer matrix, allowing higher elongation at the same time. Additionally, owing to the hyperbranched structure of HBPA, the HTPB chains can interpenetrate or become entangled with HBPA molecules to form strong interfacial interactions (Fig. 1), and the intramolecular cavities can also blunt the crack front.44,58–60 Therefore, H-0.1/HTPB exhibits a remarkable reinforcement effect. However, both G-0.2/HTPB and H-0.2/HTPB composites display significant decreases in tensile strength and elongation at break values when the loading was 0.2 wt%, as seen in Fig. 8(a) and (c). For the G-0.2/HTPB composite, the aggregation of GO sheets and weak interfacial interactions may be responsible for this result. In the case of the H-0.2/HTPB composite, this can be attributed to the presence of abundant –NH2 active groups, which show high reactivity with IPDI; the reason that the micromolecular cross-linking agent is easily absorbed at the filler surface61 is that HGO sheets are more likely to react with –NCO at the terminations of IPDI molecules, which can form aggregates, leading to stress concentration in the tensile process and resulting in decreases in the ultimate tensile strength and elongation at break values. Consequently, combining the above analysis and SEM images, the H-0.1/HTPB composite is seen to possess the best tensile properties.
Furthermore, creep experiments are conducted to characterize the creep properties of the composites. Fig. 9 displays typical creep curves of pure HTPB and its composites. Obviously, P-HTPB exhibits large creep strain and residual strain, which also increases with the cycle number. Comparatively, for the H/HTPB composites, their creep strains and residual strains are lower than those of P-HTPB, and they barely change after three cycles, indicating notable resistance to deformation and recovery capabilities. However, neither the G-0.2/HTPB nor H-0.3/HTPB composite presents the same excellent creep performances as the H/HTPB composites at loading below 0.2 wt%. This can be attributed to the following reasons. (1) Nanofillers can inhibit the movement of polymer molecules, thereby reducing the creep deformation of the composites.62 (2) The interaction between the nanofiller and the polymer matrix is one of the key factors significantly affecting the creep properties.63 The strong interfacial interactions between HGO and the matrix, and the hyperbranched structure of HBPA play significant roles in limiting the movement of HTPB molecules and its deformation in response to external loading and environmental factors. (3) Owing to the agglomeration of HGO, composites with high HGO content levels exhibit relatively weak abilities to resist the movement of molecules, leading to increasing creep deformation.
 | ||
| Fig. 9 (a) Creep curves of the composites over 3 cycles. (b) Creep curves of the composites from the first cycle. (c) The creep compliance of the composites. | ||
Creep compliance (Jcr) is an important parameter for characterizing the creep performance of a material.1 From Fig. 9(c), it is clear that the H-x/HTPB composites exhibit quite low Jcr values compared with P-HTPB, reflecting the excellent reinforcing effect of HGO.
3.4. Thermal properties of the composites
The glass transition temperature (Tg) is one of the most important polymer parameters since it determines the temperature range for utilizing a material, which is of vital importance for solid propellants.64 The DSC curves of the composites are presented in Fig. 10(a) and (b), and the Tg values from DSC analysis are listed in Fig. 10(c). From Fig. 10(a), the Tg values of the G/HTPB composites are seen to first increase and then decrease as the GO content increases. Due to the limited movement of polymer chains upon the existence of GO, the Tg values of the G/HTPB composites increase continuously, and when the GO content is higher than 0.15 wt%, the Tg values tend to decrease. The good dispersion of nanofiller in the matrix and good interfacial interactions between the nanofiller and the matrix can promote heat transfer.65 As can be seen from SEM images, aggregates of GO can be responsible for these results. But for the H/HTPB composites, their Tg values increase continuously. This phenomenon is in good agreement with previous reports,44,46,48 and it further confirms the effectiveness of HBPA modification. More importantly, it is clear that the Tg values of the composites are all in the range of −72 °C to −74 °C based on Fig. 10(c), slightly higher than P-HTPB and much lower than room temperature, which ensures that the polymers have a wide range of service temperatures and excellent elasticity at low temperatures, which is of great significance for their applications. | ||
| Fig. 10 (a and b) DSC heating curves of the composites. (c) Tg values of the composites. | ||
4. Conclusions
In summary, we successfully modified GO with HBPA via a facile “grafted to” method. The successful grafting of HBPA onto the GO surface is carefully demonstrated. SEM images of cryo-fractured surfaces of composite samples indicate that the GO dispersion and compatibility in the HTPB matrix can be remarkably improved upon functionalizing with HBPA. In addition, the effects of HGO on the mechanical properties of the composites were investigated. The results demonstrate that modification can dramatically enhance the interfacial interactions of GO with the matrix, resulting in the tensile strength of H-0.1/HTPB increasing by 57.8% compared with P-HTPB. It is especially worth noting that its elongation at break has also been improved, which is an ideal and significant result for improving the mechanical properties of HTPB-based composite solid-propellants. Moreover, creep experiments show the notable deformation resistance and recovery capabilities of H/HTPB composites when the HGO content is lower than 0.2 wt%. More importantly, the Tg values of the composites are all in the range of −72 °C to −74 °C; this is conducive to their application in solid propellants. Furthermore, this nanomaterial (HGO) can also be applied in the fabrication of other nanocomposites with strong interface and mechanical properties for wider applications.Author contributions
The manuscript was written through contributions from all authors. All authors have given approval to the final version of the manuscript.Conflicts of interest
There are no conflicts to declare.Acknowledgements
This work was supported by the Sichuan Science and Technology Program (grant number 2020YFG0026) and the National Social Science Foundation of China (grant number 2020-SKJJ-C-108).References
- X. Zhang, J. Zheng, H. Fang, Y. Zhang and S. Bai, Composites, Part A, 2017, 103, 208–218 CrossRef CAS.
- V. D. Punetha, S. Rana, H. J. Yoo, A. Chaurasia, J. T. McLeskey, M. S. Ramasamy, N. G. Sahoo and J. W. Cho, Prog. Polym. Sci., 2017, 67, 1–47 CrossRef CAS.
- B. N. Rao, P. J. P. Yadav, K. Malkappa, T. Jana and P. U. Sastry, Polymer, 2015, 77, 323–333 CrossRef CAS.
- S. B. Bae, C. K. Kim, K. Kim and I. J. Chung, Eur. Polym. J., 2008, 44, 3385–3392 CrossRef CAS.
- K. Ghosh, L. V. Gaikwad, R. K. Kalal, P. A. Kulkarni, A. Kumar, S. Banerjee and M. Gupta, Def. Technol., 2020, 17(2), 559–570 CrossRef.
- M. Shahidzadeh, Z. Khansari Varkaneh, B. Ramezanzadeh, M. Zamani Pedram and M. Yarmohammadi, Prog. Org. Coat., 2020, 140, 105503 CrossRef CAS.
- Q. Zhou, S. Jie and B.-G. Li, Polymer, 2015, 67, 208–215 CrossRef CAS.
- K. Ganesh, S. Sundarrajan, K. Kishore, K. N. Ninan, B. George and M. Surianarayanan, Macromolecules, 2000, 33, 326–330 CrossRef CAS.
- G. Mir Mohamad Sadeghi, J. Morshedian and M. Barikani, React. Funct. Polym., 2006, 66, 255–266 CrossRef CAS.
- Y.-S. He, J.-B. Zeng, G.-C. Liu, Q.-T. Li and Y.-Z. Wang, RSC Adv., 2014, 4, 12857–12866 RSC.
- A. Nazmi, M. Yarmohammadi, M. Zamani Pedram and M. Shahidzadeh, Int. J. Chem. Kinet., 2019, 51, 28–36 CrossRef CAS.
- K. Abhay and D. Devendra, HTPB-Polyurethane: A Versatile Fuel Binder for Composite Solid Propellant, 2012, p. 229, DOI:10.5772/47995.
- B. Lucio and J. L. de la Fuente, Eur. Polym. J., 2014, 50, 117–126 CrossRef CAS.
- S. A. Shokry, A. K. El Morsi, M. S. Sabaa, R. R. Mohamed and H. E. El Sorogy, Egypt. J. Pet., 2015, 24, 145–154 CrossRef.
- H. Mingjie, T. Shuzhen, F. Wei, G. Le, L. Xinghai, L. Yunbai and H. Chi, High Perform. Polym., 2014, 27, 381–391 CrossRef.
- R. Cao, Z. Chen, Y. Wu, Y. Tu, G. Wu and X. Yang, Composites, Part A, 2017, 93, 100–106 CrossRef CAS.
- Y. Zhang, Q. n. Zhang, D. Hou and J. Zhang, Appl. Surf. Sci., 2020, 504, 144152 CrossRef.
- A. Surnova, D. Balkaev, D. Musin, R. Amirov and A. M. Dimiev, Composites, Part B, 2019, 162, 685–691 CrossRef CAS.
- J. W. Suk, R. D. Piner, J. An and R. S. Ruoff, ACS Nano, 2010, 4, 6557–6564 CrossRef CAS PubMed.
- W. Gao, in Graphene Oxide: Reduction Recipes, Spectroscopy, and Applications, ed. W. Gao, Springer International Publishing, Cham, 2015, pp. 61–95, DOI:10.1007/978-3-319-15500-5_3.
- C. Lee, X. Wei, J. W. Kysar and J. Hone, Science, 2008, 321, 385–388 CrossRef CAS PubMed.
- N. V. Medhekar, A. Ramasubramaniam, R. S. Ruoff and V. B. Shenoy, ACS Nano, 2010, 4, 2300–2306 CrossRef CAS PubMed.
- L. Guo, H. Yan, Z. Chen, Q. Lv, T. Bai and Y. Zhang, SN Appl. Sci., 2020, 2, 473 CrossRef CAS.
- C. Y. Lee, J.-H. Bae, T.-Y. Kim, S.-H. Chang and S. Y. Kim, Composites, Part A, 2015, 75, 11–17 CrossRef CAS.
- X. Yan, J. Gu, G. Zheng, J. Guo, A. M. Galaska, J. Yu, M. A. Khan, L. Sun, D. P. Young, Q. Zhang, S. Wei and Z. Guo, Polymer, 2016, 103, 315–327 CrossRef CAS.
- D. Xu, W. Chen and P. Liu, Compos. Sci. Technol., 2020, 199, 108355 CrossRef CAS.
- J. Gu, N. Li, L. Tian, Z. Lv and Q. Zhang, RSC Adv., 2015, 5, 36334–36339 RSC.
- J. Gu, C. Liang, X. Zhao, B. Gan, H. Qiu, Y. Guo, X. Yang, Q. Zhang and D.-Y. Wang, Compos. Sci. Technol., 2017, 139, 83–89 CrossRef CAS.
- J. Gu, X. Yang, Z. Lv, N. Li, C. Liang and Q. Zhang, Int. J. Heat Mass Transfer, 2016, 92, 15–22 CrossRef CAS.
- T. T. Zhu, C. H. Zhou, F. B. Kabwe, Q. Q. Wu, C. S. Li and J. R. Zhang, Appl. Clay Sci., 2019, 169, 48–66 CrossRef CAS.
- X. Wang, W. Xiao, L. Wang, J. Shi, L. Sun, J. Cui and J. Wang, Phys. E, 2020, 123, 114172 CrossRef CAS.
- X. Shen, Z. Wang, Y. Wu, X. Liu, Y.-B. He and J.-K. Kim, Nano Lett., 2016, 16, 3585–3593 CrossRef CAS PubMed.
- Y. Han, Y. Ke, Y. Shi, Y. Liu, G. Yang, Z. Li, D.-B. Xiong, J. Zou and Q. Guo, Mater. Sci. Eng., A, 2020, 787, 139541 CrossRef CAS.
- D. R. Dreyer, S. Park, C. W. Bielawski and R. S. Ruoff, Chem. Soc. Rev., 2010, 39, 228–240 RSC.
- X. Zhang, J. Zheng, H. Fang, Y. Zhang, S. Bai and G. He, Compos. Sci. Technol., 2018, 161, 124–134 CrossRef CAS.
- R. Lian, X. Lei, Y. Chen and Q. Zhang, J. Appl. Polym. Sci., 2019, 136, 47771 CrossRef.
- H. Huang, Y. Fu, X. Mu, Z. Luo, S. Zhang, Z. Wang, H. Li and F. Gao, Appl. Surf. Sci., 2020, 529, 147076 CrossRef CAS.
- Z. Hao, L. Li, B. Yang, X. Sheng and X. Liao, Polymers, 2019, 11, 433 CrossRef PubMed.
- S. Chen, J. Zhang, J. Zhou, D. Zhang and A. Zhang, Chem. Eng. J., 2018, 334, 1371–1382 CrossRef CAS.
- L. Shi, L. Ma, P. Li, M. Wang, S. Guo, P. Han and G. Song, Appl. Surf. Sci., 2019, 479, 334–343 CrossRef CAS.
- L. Wang, Y. Tan, X. Wang, T. Xu, C. Xiao and Z. Qi, Chem. Phys. Lett., 2018, 706, 31–39 CrossRef CAS.
- S. O. Ilyin, V. V. Makarova, M. Y. Polyakova and V. G. Kulichikhin, Mater. Today Commun., 2020, 22, 100833 CrossRef CAS.
- Y. Yu, X. Jiang, Y. Fang, J. Chen, J. Kang, Y. Cao and M. Xiang, Polymers, 2019, 11(12), 1988 CrossRef CAS PubMed.
- X. Wang, N. Li, J. Wang, G. Li, L. Zong, C. Liu and X. Jian, Compos. Sci. Technol., 2018, 155, 11–21 CrossRef CAS.
- K. Tewatia, A. Sharma, M. Sharma and A. Kumar, Mater. Today: Proc., 2020 DOI:10.1016/j.matpr.2020.09.294.
- J. Li, W. Zhu, S. Zhang, Q. Gao, J. Li and W. Zhang, Polym. Test., 2019, 76, 232–244 CrossRef CAS.
- X. Mi, F. Wei, L. Zeng, L. Zhong, J. Zhang, D. Zhang and Y. Luo, Polym. Int., 2019, 68, 1492–1501 CrossRef CAS.
- B. Ramezanzadeh, G. Bahlakeh, M. H. Mohamadzadeh Moghadam and R. Miraftab, Chem. Eng. J., 2018, 335, 737–755 CrossRef CAS.
- Y. Li, M. Zhou, Z. Xia, Q. Gong, X. Liu, Y. Yang and Q. Gao, Colloids Surf., A, 2020, 602, 125172 CrossRef CAS.
- M. J. McAllister, J.-L. Li, D. H. Adamson, H. C. Schniepp, A. A. Abdala, J. Liu, M. Herrera-Alonso, D. L. Milius, R. Car, R. K. Prud'homme and I. A. Aksay, Chem. Mater., 2007, 19, 4396–4404 CrossRef CAS.
- P. Song, Z. Cao, Y. Cai, L. Zhao, Z. Fang and S. Fu, Polymer, 2011, 52, 4001–4010 CrossRef CAS.
- K. N. Kudin, B. Ozbas, H. C. Schniepp, R. K. Prud'homme, I. A. Aksay and R. Car, Nano Lett., 2008, 8, 36–41 CrossRef CAS PubMed.
- Z. Cao, J. Zhang, Y. Ding, Y. Li, M. Shi, H. Yue, Y. Qiao, Y. Yin and S. Yang, J. Mater. Chem. A, 2016, 4, 8636–8644 RSC.
- F. Zhang, W. Liu, S. Wang, C. Jiang, Y. Xie, M. Yang and H. Shi, Appl. Surf. Sci., 2019, 491, 301–312 CrossRef CAS.
- Q. Xie, S. Zhang, H. Ma, W. Shao, X. Gong and Z. Hong, Polymers, 2018, 10(11), 1253 CrossRef PubMed.
- Y. Tang, H. Liu, X. Wang, S. Cheng, Z. Jin, T. Zhuang, S. Guan and L. Li, J. Mol. Struct., 2021, 1224, 129196 CrossRef CAS.
- L. Hu, P. Jiang, P. Zhang, G. Bian, S. Sheng, M. Huang, Y. Bao and J. Xia, J. Mater. Sci., 2016, 51, 8296–8309 CrossRef CAS.
- D. Manjula Dhevi, S. N. Jaisankar and M. Pathak, Eur. Polym. J., 2013, 49, 3561–3572 CrossRef CAS.
- Q. Jin, J. M. Misasi, J. S. Wiggins and S. E. Morgan, Polymer, 2015, 73, 174–182 CrossRef CAS.
- T. Liu, Y. Nie, R. Chen, L. Zhang, Y. Meng and X. Li, J. Mater. Chem. A, 2015, 3, 1188–1198 RSC.
- A. Mujtaba, M. Keller, S. Ilisch, H. J. Radusch, T. Thurn-Albrecht, K. Saalwächter and M. Beiner, Macromolecules, 2012, 45, 6504–6515 CrossRef CAS.
- L.-X. Gong, Y.-B. Pei, Q.-Y. Han, L. Zhao, L.-B. Wu, J.-X. Jiang and L.-C. Tang, Compos. Sci. Technol., 2016, 134, 144–152 CrossRef CAS.
- H. Muenstedt, N. Katsikis and J. Kaschta, Macromolecules, 2008, 41, 9777–9783 CrossRef CAS.
- Y.-y. Lu, Y.-j. Shu, N. Liu, Y. Shu, K. Wang, Z.-k. Wu, X.-c. Wang and X.-y. Ding, Comput. Mater. Sci., 2017, 139, 132–139 CrossRef CAS.
- J. W. Yu, J. Jung, Y.-M. Choi, J. H. Choi, J. Yu, J. K. Lee, N.-H. You and M. Goh, Polym. Chem., 2016, 7, 36–43 RSC.
| This journal is © The Royal Society of Chemistry 2021 |