 Open Access Article
Royal jelly fatty acids bioprofiling using TLC-MS and digital image analysis coupled with chemometrics and non-parametric regression for discovering efficient biomarkers against melanoma†
Reham S. Ibrahim * and
Alaa A. El-Banna
Department of Pharmacognosy, Faculty of Pharmacy, Alexandria University, Alexandria, 21521, Egypt. E-mail: rehamsaid84@yahoo.com; reham.abdelkader@alexu.edu.eg; Tel: +201223821098
First published on 24th May 2021
Abstract
A comprehensive approach of untargeted and targeted fatty acid bioprofiling of different royal jelly commercial and pharmaceutical products based on HPTLC-image analysis and melanoma cytotoxic activity together with chemometric analysis was applied in this study for discovering efficient biomarkers. Principal component analysis based on HPTLC-image analysis fingerprints of fatty acid loading plots were used to determine the chemical markers responsible for classification of royal jelly samples into fresh and lyophilized ones. These markers were identified using the HPTLC-MS technique as 8-hydroxyoctanoic acid, 3,10-dihydroxydecanoic acid, 10-hydroxy-2-decenoic acid, decanedioic acid and 10-hydroxydecanoic acid. These discriminating markers were quantified via the HPTLC-imaging technique for targeted profiling using two different methods: parametric and non-parametric regression. The non-parametric regression method exhibited superiority in terms of linearity, accuracy and precision. Biomarkers were determined from the 3D-loading plot of orthogonal projection to latent structures model based on the fatty acid quantitative data together with the melanoma cytotoxic activity data. 10-Hydroxy-2-decenoic acid showed the greatest reduction in melanoma cell viability followed by decanedioic acid then 8-hydroxyoctanoic acid. The present study is considered the first attempt to discriminate fresh and lyophilized royal jelly samples based on their holistic lipidomic profile to discover efficient fatty acid reducing melanoma cell viability.
1. Introduction
Royal jelly is a honey bee milky-white secretion generated from the hypopharyngeal and mandibular glands of three to twelve day-old nurse bees (Apis mellifera L., family: Apidae). It is the only food source to the queen bee during her life, but it is fed to early-instar larvae of workers only for their first three days.1 Due to this special food, queen bees are distinct from worker bees in their size, production of eggs and life longevity.2 Numerous dietary supplements containing royal jelly are available in the market. These supplements are claimed to be anti-oxidant,3 immunostimulant,4 anti-aging,5 anti-hypercholesterolemic,6 anti-inflammatory,7 anti-tumor,8 wound-healing,9 antibacterial10 and skin whitening agents.11It is believed that these pharmacological claims are due to different constituents existing in royal jelly such as proteins, carbohydrates, fatty acids, vitamins, and trace minerals.12 The most distinctive constituents in royal jelly are its fatty acids.13 Whereas animal and plant fatty acids are mainly composed of 14–20 carbon atoms and are present in the form of esterified triacylglycerols, the royal jelly fatty acids are medium-length chain (8–12 carbon atoms) free fatty acids, either hydroxylated, or dicarboxylated, saturated or monounsaturated at the 2-position.14 Many of the biological properties of royal jelly are attributed to its unusual bioactive fatty acid components. The major royal jelly fatty acid is 10-hydroxy-2-decenoic acid (10-HDA), also known as queen bee acid.15,16 The quantity of 10-HDA in royal jelly differs based on the origin of the jelly and the features of the bee.17 10-HDA is not present in any other natural product, even other bee products. Therefore, it can be used as a marker for the validation of royal jelly quality.18,19
Many studies were published describing the assay of 10-HDA in pure royal jelly and royal jelly products using liquid chromatography methods.19,20 In addition, HPLC and UPLC methods as well as capillary zone electrophoresis (CZE) and HPLC techniques were compared for the quantitation of 10-HDA.17,21 Also, gas chromatography-mass spectrometry (GC-MS) was applied in the study of royal jelly lipidome.22,23 However, GC-MS techniques require the derivatization of free fatty acids into their corresponding trimethylsilyl esters. Therefore, other researches were carried out to study the fatty acid content of royal jelly using LC-MS.24 Most recently, a stability-indicating HPTLC-densitometric assay was developed for the determination of 10-HDA content in royal jelly products marketed in Egypt.25
Two different approaches of analysis are applied in the study of natural products metabolomes: untargeted and targeted analytical approaches. Untargeted approach aims to maximize the number of detected metabolites. Hundreds to thousands of metabolites can typically be measured. The chemical identity of each metabolite is not known at the start of the study. Data acquired during the data acquisition is applied to identify metabolites after data acquisition. However, one single analytical method cannot detect all of the metabolites. It's therefore desirable to combine multiple analytical approaches to maximize the number of metabolites detected and increase coverage of the metabolome. Whereas, targeted studies analyze a relatively small and specific number of metabolites. These metabolites are chemically characterized and biochemically annotated at the start of the study before data acquisition is performed.26,27
High performance thin-layer chromatography (HPTLC) is a very beneficial technique for developing fingerprint profiles of the extracts because the whole chromatogram is regarded as a multidimensional vector, without the need to identify single spots.28 The hyphenation to mass spectrometry (MS) allows the identification of the components on the TLC plates29 which can then be quantified using different regression methods. Among these methods are the parametric and non-parametric regression.30
Parametric regression method presumes that examined data apply the normal (Gaussian) distribution. Therefore, it uses the arithmetic mean as the measure of central tendency of these data. It also supposes that the errors are only present in the y-values and x-values are error-free.30 This method can be applied only if these assumptions are true, but can give misleading results if they are not true; thus the least squares parametric regression method is considered to be not robust to violations of its assumptions. Another major disadvantage in parametric regression method is that it is highly influenced by the outlying results.30 On the other hand, in non-parametric regression, the median is usually applied instead of the mean, because in many circumstances it is a more realistic measure of central tendency.30 Non-parametric regression overcomes the demerits of the parametric one, as it does not presume that either the x- or y-direction errors follow the normal distribution and it does not have the assumption that all the errors are in the y-direction. Also, it is not influenced by the existence of outliers.30
Melanoma is the most serious type of skin cancer. It develops in the melanocytes that produce melanin, the pigment that gives the skin its color and protects it from UV light damage.31 Melanoma in vitro model using B16F10 melanoma cell culture was used in this study to investigate the melanoma cytotoxic effect of royal jelly and its bioactive fatty acids.
The aim of this work was to carry out untargeted and targeted fatty acid profiling of different royal jelly commercial and pharmaceutical products based on HPTLC-image analysis, HPTLC/MS and anti-melanoma activity testing with the use of chemometric analysis. Principal component analysis (PCA) based on HPTLC-image analysis fingerprints of fatty acids loading plots were used to determine the chemical markers responsible for the classification of royal jelly samples. These chemical markers were then identified using HPTLC/MS technique. The identified markers were then quantified via HPTLC-imaging technique for targeted profiling using two different regression methods: parametric and non-parametric regression. Biomarkers were determined from the coefficients plot of orthogonal projection to latent structures (OPLS) model based on the fatty acids quantitative data together with the anti-melanoma activity data. It is worth-mentioning that; this is the first time to study royal jelly fatty acids using HPTLC-image analysis and HPTLC/MS and to apply multivariate analysis to identify the efficacy associated markers against melanoma.
2. Material and methods
2.1. Royal jelly samples collection and preparation
Eighteen individual fresh and lyophilized royal jelly commercial and pharmaceutical samples (RJ1–RJ18) were collected during summer 2020 from different apiary stores, pharmaceutical companies and community pharmacies in Egypt. Details about the source of each sample are available in Table S1.† After testing several extraction solvents; methanol attained the highest extraction yield. 1 g of each sample was separately extracted with 2 mL methanol using ultrasonic bath for 30 minutes. The obtained extracts were then filtered by disk filter (0.20 μm) prior to sample application.2.2. Standard solutions preparation
Accurate weights from each individual reference standard; 8-hydroxyoctanoic acid, 3,10-dihydroxydecanoic acid, 10-hydroxy-2-decenoic acid (10-HDA), decanedioic acid and 10-hydroxydecanoic acid were dissolved in methanol. Standards solution mixture (STD MIX-5) was prepared by mixing the appropriate amounts of individual standards stock solutions. The standards concentrations used for calibration were 1–30 μg μL−1.2.3. Chromatographic parameters and conditions
15 μL of royal jelly samples solutions as well as standards solutions mixture (STD MIX-5) were applied with a 100 μL syringe using Linomat V automated spray-on band applicator Camag (Muttenz, Switzerland) controlled with WinCats manager software. The application settings were 15 mm from the margins and 15 mm from the bottom of the plate with bandwidth 8 mm and inter-band spaces 5 mm. Application was performed on silica gel 60 F254 (10 × 20 cm) HPTLC plates (Merck, Darmstadt, Germany).Several chromatographic solvent systems were tried to maximize the resolution for the developed spots corresponding to royal jelly fatty acid. Finally, toluene![[thin space (1/6-em)]](https://www.rsc.org/images/entities/char_2009.gif) :
:![[thin space (1/6-em)]](https://www.rsc.org/images/entities/char_2009.gif) ethyl acetate (7.5
ethyl acetate (7.5![[thin space (1/6-em)]](https://www.rsc.org/images/entities/char_2009.gif) :
:![[thin space (1/6-em)]](https://www.rsc.org/images/entities/char_2009.gif) 2.5 v/v) was found to be the optimum developing solvent. The plates were then developed over a distance of 85 mm using 40 mL of the mobile phase in a vertical (20 × 10 cm) twin trough CAMAG glass chamber saturated for 15 min before the development.
2.5 v/v) was found to be the optimum developing solvent. The plates were then developed over a distance of 85 mm using 40 mL of the mobile phase in a vertical (20 × 10 cm) twin trough CAMAG glass chamber saturated for 15 min before the development.
2.4. Post-chromatographic derivatization
After development, TLC plates were sprayed with a freshly prepared solution of 0.5 mL p-anisaldehyde in 50 mL glacial acetic acid and 1 mL 97% sulfuric acid and then heated to 105 °C until maximum visualization of spots. The plates were captured under white light using digital camera (14 megapixel, Fujifilm, Japan). The images were then stored as jpg for further processing.2.5. Image processing and multivariate data analysis
Heat maps and “Hierarchical Clustering Analysis (HCA)” for exploring class membership using agglomerative approach were performed by Gitools 2.3.0 software (Biomedical Research Park, Barcelona).
![[thin space (1/6-em)]](https://www.rsc.org/images/entities/char_2009.gif) :
:![[thin space (1/6-em)]](https://www.rsc.org/images/entities/char_2009.gif) 2) at a flow rate of 0.25 mL min−1. MS analysis was performed on Advion Compact Mass Spectrometer (CMS), NY (USA). Data acquisition was performed in negative mode using ESI ion source in the mass range 100–700 Da.
2) at a flow rate of 0.25 mL min−1. MS analysis was performed on Advion Compact Mass Spectrometer (CMS), NY (USA). Data acquisition was performed in negative mode using ESI ion source in the mass range 100–700 Da.2.5.4.1. Linearity and sensitivity. The evaluation of the linearity of the suggested HPTLC method was carried out by the analysis of various concentrations of standards solution mixture (STD MIX-5). In accordance with ICH guidelines, minimally five concentrations should be analyzed. By the use of both parametric and non-parametric regression methods, regression equation, correlation coefficient (r), intercept (a), slope (b), standard deviation of residuals (Sy/x), standard deviation of intercept (Sa), and standard deviation of slope (Sb) were studied. Variance ratio (F) and sensitivity in terms of limit of detection (LOD) and limit of quantitation (LOQ) were calculated as well.
2.5.4.2. Accuracy and selectivity. The accuracy and selectivity of the parametric regression method were evaluated by applying recovery studies, which were carried out via standard addition method. Preparation of samples solutions of a representative sample (RJ13) methanolic extract, in which the concentrations of royal jelly fatty acids were formerly calculated, was carried out. After that, known concentrations of standards solution mixture (STD MIX-5) were added to them. The experiment was followed as formerly mentioned. Each solution was prepared in triplicate and analyzed. Percentage mean recovery and percentage relative error (Er%) for royal jelly fatty acids were used for determination and expression of accuracy. In case of non-parametric method, the accuracy and selectivity were determined as in parametric regression method except that the percentage mean recovery and percentage relative error (Er%) calculations relied on the intercepts and slopes gained via the non-parametric regression method. To test for the significant difference in accuracy among the studied types of regression: parametric (P) and non-parametric (NP) regression, Student's t-test for comparing sample means was carried out.
2.5.4.3. Precision. The analytical method precision gives an idea on the random error. It demonstrates the nearness of agreement among a group of measurements gained by multiple sampling of the same homogenous sample under the previously specified conditions. It is comprised of repeatability (intra-day precision) and intermediate precision (inter-day precision).33
2.5.4.3.1. Repeatability (intra-day precision). The intra-day difference in the determination of royal jelly fatty acids was demonstrated by the analysis of three different concentrations of standards solution mixture (STD MIX-5) within the range of linearity using of the same equipment, the same analyst and the same analytical procedure in the same laboratory. Method repeatability was determined from RSD% value gained by repetition of the experiment three times for each concentration on the same day.
2.5.4.3.2. Intermediate precision (inter-day precision). Determination of the method inter-day precision was carried out by analyzing standards solution mixture (STD MIX-5) prepared at the same levels of the intra-day method but on three successive days. Percentage relative standard deviation (RSD%) was used to express the precision. F test was carried out to test for the significant difference in variance among the two studied regression types: parametric (P) and non-parametric (NP) regression.
2.6. In vitro mouse melanoma cytotoxicity assay
Mouse melanoma cells (B16-F10) were obtained from Nawah Scientific Inc., (Mokatam, Cairo, Egypt). Cells were maintained in Dulbecco's Modified Eagle Medium (DMEM). These media were supplemented with 100 mg mL−1 of streptomycin, 100 units per mL of penicillin and 10% of heat-inactivated fetal bovine serum in humidified, 5% (v/v) CO2 atmosphere at 37 °C. Cell viability was assessed by sulforhodamine B (SRB) assay.34,35 Aliquots of 100 μL cell suspension (5 × 10³ cells) were in 96-well plates and incubated in complete media for 24 h. Cells were treated with another aliquot of 100 μL media containing drugs at various concentrations. After 72 h of drug exposure, cells were fixed by replacing media with 150 μL of 10% trichloroacetic acid (TCA) and incubated at 4 °C for 1 h. The TCA solution was removed, and the cells were washed 5 times with distilled water. Aliquots of 70 μL SRB solution (0.4% w/v) were added and incubated in a dark place at room temperature for 10 min. Plates were washed 3 times with 1% acetic acid and allowed to air-dry overnight. Then, 150 μL of Tris (10 mM) was added to dissolve protein-bound SRB stain; the absorbance was measured at 540 nm using a BMG LABTECH®-FLUOstar Omega microplate reader (Ortenberg, Germany).2.7. Orthogonal projection to latent structures (OPLS) model for discovering efficient biomarkers against melanoma
Bio-profiling of the different extracts was attempted through determination of the biomarkers by OPLS analysis using SIMCA 14.1 software (Umetrics, Umea, Sweden). The data matrix of the previously determined concentrations of 8-hydroxyoctanoic acid, 3,10-dihydroxydecanoic acid, 10-hydroxy-2-decenoic acid (10-HDA), decanedioic acid and 10-hydroxydecanoic acid in each sample was used as X-matrix while the cytotoxic activity against mouse melanoma cells was used as the Y-matrix. This was followed by a regression step where the decomposition of X was used to predict Y through another two matrices of scores and loadings. Meanwhile, variable importance for the projection (VIP) values were utilized for determination of the X-variables significance for the model.3. Results and discussion
3.1. Untargeted fatty acids profiling of royal jelly HPTLC fingerprints
The lipidome of royal jelly (RJ) consists of medium-chained (8–12 carbon atoms) free fatty acids.Many of the biological properties of RJ are attributed to its unusual bioactive fatty acid components.36 HPTLC coupled with chemometric techniques was devoted for the first time for rapid comparative fingerprint profiling of fatty acids in the different lyophilized and fresh RJ samples collected from various sources.
Analysis time for each TLC plate (14 samples per plate) required 20 min from application to development for a total of 60 min for all sample plates (18 samples in duplicates). This is more time saving than the reported HPLC methods37 which require at least 30 min for the elution of each separate sample for a total of 1080 min for 18 samples in duplicates.
A previous study specified the amount of 10-HDA in fresh and lyophilized RJ to be 1.4% and 3.5%, respectively.38 However, the study relied solely on a single fatty acid as a quality marker rather than the holistic lipidomic profiling adopted in this work.
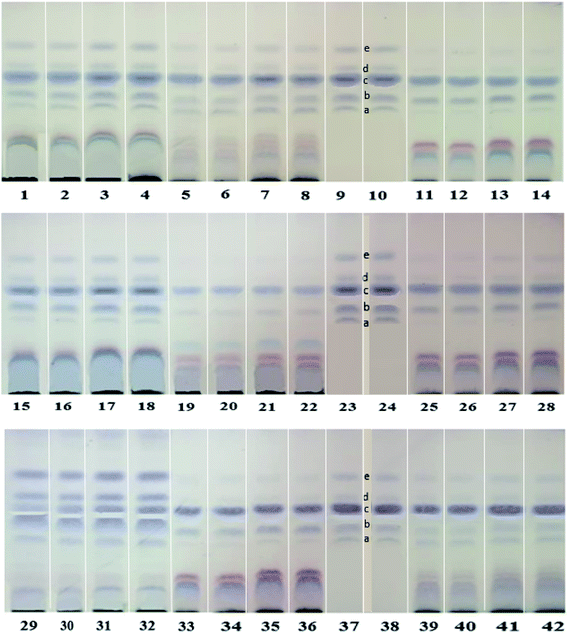
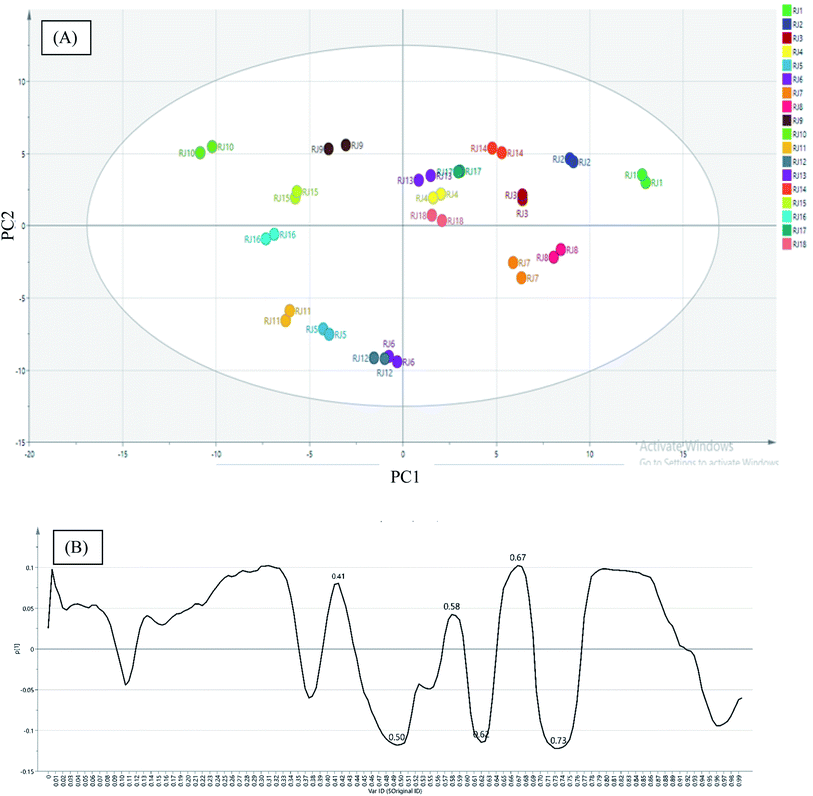
In the present investigation, HPTLC fingerprinting was applied for initial screening of RJ for discrimination of the investigated samples. Image capturing was performed using video densitometry. The HPTLC chromatogram for 18 RJ samples obtained at white light after post-chromatographic derivatization with anisaldehyde/sulfuric acid reagent and subsequent heating to 105 °C is presented in (Fig. 1). The different RJ samples exhibited different chromatographic patterns which could be detected visually through examination of different relative bands intensities among samples tracks. The data set obtained from chromatogram contained 189 pixels length profile for each sample. Untargeted analysis was applied on the matrix constructed from 18 samples × 189 variables. Principal component analysis (PCA) was performed to provide an outline of the ability of the HPTLC variables to discriminate different RJ samples. Mutual projections of factor scores for the first two PCs described 58.2% (PC1) and 24.5% (PC2) of the variability in the data (Fig. 2A). The score scatter plot for the first two components revealed that lyophilized RJ samples (RJ 1, 2, 3, 4, 7, 8, 13, 14, 17 and 18) collected from different sources were successfully clustered along the positive side of PC1, while fresh samples (RJ 5, 6, 9, 10, 11, 12, 15 and 16) on its negative side. This neat separation between the two clusters indicates the difference in the fatty acids profiles between fresh and lyophilized RJ. This highlights the criteria of exploiting the holistic lipidomic profile of RJ rather than considering 10-HDA only as a quality marker.
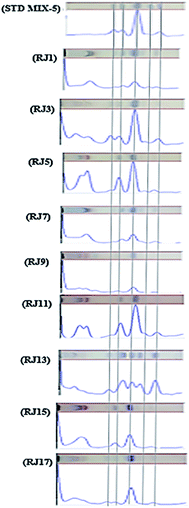
The PC1 loading plot (Fig. 2B), revealed that bands at Rf values 0.41, 0.5, 0.58, 0.67 and 0.73 are the variables that are the most influential on PC1 and PC2 directions. These bands were scrapped and analyzed using mass spectrometry analysis. The zones at Rf values of 0.41, 0.5, 0.58, 0.67 and 0.73 were identified as 8-hydroxyoctanoic acid, 3,10-dihydroxydecanoic acid, 10-hydroxy-2-decenoic acid (10-HDA), decanedioic acid and 10-hydroxydecanoic acid, respectively by comparison with reference substances and mass spectral libraries (Fig. 3).
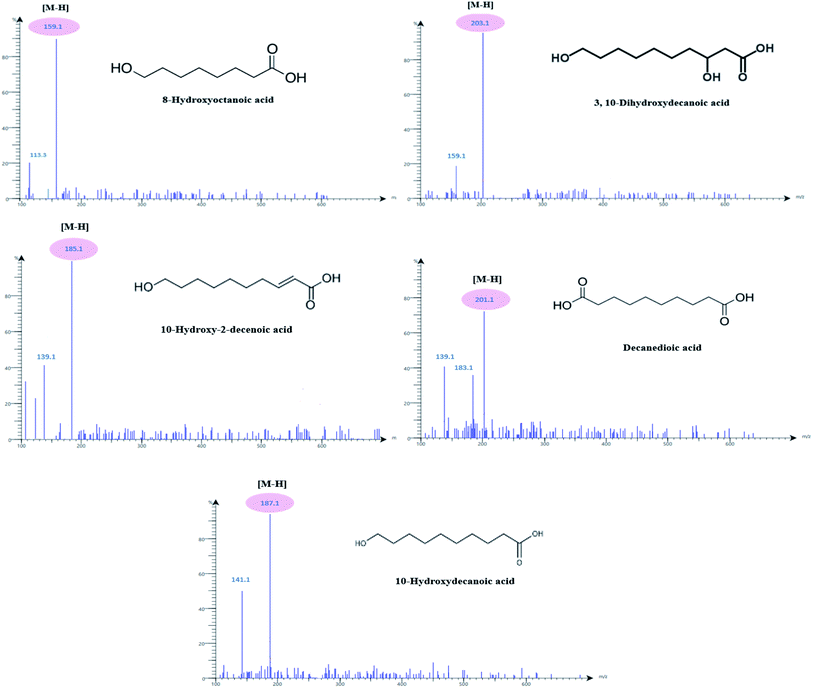 | ||
| Fig. 3 HPTLC-ESI-MS analysis of 8-hydroxyoctanoic acid, 3,10-dihydroxydecanoic acid, 10-hydroxy-2-decenoic acid (10-HDA), decanedioic acid and 10-hydroxydecanoic acid in different RJ samples. | ||
3.2. Targeted fatty acids profiling and heat map of RJ samples
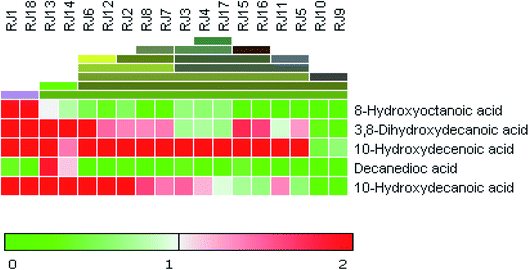
A novel digitally-enhanced HPTLC image analysis method using both parametric and non-parametric regression analyses was then developed and validated.33 This method was applied for quantification of the five significant fatty acids identified from the fingerprint profiling chromatograms in different RJ samples (Fig. 4) namely; 8-hydroxyoctanoic acid, 3,10-dihydroxydecanoic acid, 10-hydroxy-2-decenoic acid (10-HDA), decanedioic acid and 10-hydroxydecanoic acid. The Rf values and peak areas of the bands corresponding to the five significant fatty acids are shown in Table S2.†3.2.1.1. Linearity and sensitivity. Linearity of the method was remarkably enhanced upon applying the non-parametric regression as indicated by higher value of correlation coefficient (r) and smaller intercept (a) when compared to parametric regression (Table 1). Moreover, the smaller values of (Sy/x), (Sa) and (Sb) and greater the values of (F) indicated that the regression line was steeper and the experimental points were less scattered around it in NP method than in P one (Table 1). The higher sensitivity of NP regression was indicated by the lower values of (LOD) and (LOQ). This signifies that the linearity ranges for the determination of royal jelly fatty acids could be extended to lower limits of quantitation upon applying the NP regression method.
| 8-Hydroxyoctanoic acid | 3,10-Dihydroxydecanoic acid | 10-Hydroxy-2-decenoic acid | Decanedioic acid | 10-Hydroxydecanoic acid | ||
|---|---|---|---|---|---|---|
| a r: correlation coefficient, a: intercept, b: slope; Sy/x: standard deviation of residuals, Sa: standard deviation of intercept, Sb: standard deviation of slope, F: variance ratio; equals the mean of squares due to regression divided by the mean of squares about regression (due to residuals), LOD: limit of detection, LOQ: limit of quantitation.b Concentration mg per spot. | ||||||
| Regression equation | P | y = 2![[thin space (1/6-em)]](https://www.rsc.org/images/entities/char_2009.gif) 515 515![[thin space (1/6-em)]](https://www.rsc.org/images/entities/char_2009.gif) 60x + 1222.3 60x + 1222.3 |
y = 187![[thin space (1/6-em)]](https://www.rsc.org/images/entities/char_2009.gif) 378x + 2826.8 378x + 2826.8 |
y = 118![[thin space (1/6-em)]](https://www.rsc.org/images/entities/char_2009.gif) 014x + 27 014x + 27![[thin space (1/6-em)]](https://www.rsc.org/images/entities/char_2009.gif) 439 439 |
y = 218![[thin space (1/6-em)]](https://www.rsc.org/images/entities/char_2009.gif) 883x + 650.23 883x + 650.23 |
y = 121![[thin space (1/6-em)]](https://www.rsc.org/images/entities/char_2009.gif) 387x + 483.22 387x + 483.22 |
| NP | y = 250![[thin space (1/6-em)]](https://www.rsc.org/images/entities/char_2009.gif) 836.9x + 718.2813 836.9x + 718.2813 |
y = 185![[thin space (1/6-em)]](https://www.rsc.org/images/entities/char_2009.gif) 537.9x + 2249.5 537.9x + 2249.5 |
y = 116![[thin space (1/6-em)]](https://www.rsc.org/images/entities/char_2009.gif) 388.9x + 29 388.9x + 29![[thin space (1/6-em)]](https://www.rsc.org/images/entities/char_2009.gif) 428.88 428.88 |
y = 217![[thin space (1/6-em)]](https://www.rsc.org/images/entities/char_2009.gif) 409.7x + 596.2756 409.7x + 596.2756 |
y = 122![[thin space (1/6-em)]](https://www.rsc.org/images/entities/char_2009.gif) 901.4x + 22.125 901.4x + 22.125 |
|
| r | P | 0.914 | 0.914 | 0.968 | 0.985 | 0.989 |
| NP | 0.998 | 0.999 | 0.998 | 0.999 | 0.999 | |
| a | P | 1222.3 | 2826.8 | 27![[thin space (1/6-em)]](https://www.rsc.org/images/entities/char_2009.gif) 439 439 |
650.23 | 483.22 |
| NP | 718.281 | 2249.5 | 29![[thin space (1/6-em)]](https://www.rsc.org/images/entities/char_2009.gif) 428.88 428.88 |
596.276 | 22.125 | |
| b | P | 251![[thin space (1/6-em)]](https://www.rsc.org/images/entities/char_2009.gif) 560 560 |
187![[thin space (1/6-em)]](https://www.rsc.org/images/entities/char_2009.gif) 378 378 |
118![[thin space (1/6-em)]](https://www.rsc.org/images/entities/char_2009.gif) 014 014 |
218![[thin space (1/6-em)]](https://www.rsc.org/images/entities/char_2009.gif) 883 883 |
121![[thin space (1/6-em)]](https://www.rsc.org/images/entities/char_2009.gif) 387 387 |
| NP | 250![[thin space (1/6-em)]](https://www.rsc.org/images/entities/char_2009.gif) 836.9 836.9 |
185![[thin space (1/6-em)]](https://www.rsc.org/images/entities/char_2009.gif) 537.9 537.9 |
116![[thin space (1/6-em)]](https://www.rsc.org/images/entities/char_2009.gif) 388.9 388.9 |
217![[thin space (1/6-em)]](https://www.rsc.org/images/entities/char_2009.gif) 409.7 409.7 |
122![[thin space (1/6-em)]](https://www.rsc.org/images/entities/char_2009.gif) 901.4 901.4 |
|
| Sy/x | P | 1359.94 | 1678.986 | 4159.753 | 183.260 | 879.742 |
| NP | 251.837 | 188.198 | 1109.376 | 70.017 | 375.978 | |
| Sa | P | 1604.025 | 1980.333 | 4906.352 | 483.330 | 2320.231 |
| NP | 302.328 | 225.930 | 1331.795 | 84.055 | 451.358 | |
| Sb | P | 64![[thin space (1/6-em)]](https://www.rsc.org/images/entities/char_2009.gif) 635.31 635.31 |
47![[thin space (1/6-em)]](https://www.rsc.org/images/entities/char_2009.gif) 879.35 879.35 |
17![[thin space (1/6-em)]](https://www.rsc.org/images/entities/char_2009.gif) 793.44 793.44 |
21![[thin space (1/6-em)]](https://www.rsc.org/images/entities/char_2009.gif) 774.99 774.99 |
10![[thin space (1/6-em)]](https://www.rsc.org/images/entities/char_2009.gif) 349.61 349.61 |
| NP | 11![[thin space (1/6-em)]](https://www.rsc.org/images/entities/char_2009.gif) 969.31 969.31 |
5366.811 | 4745.382 | 8319.475 | 4423.149 | |
| F | P | 15.148 | 15.316 | 43.989 | 101.043 | 137.562 |
| NP | 658.773 | 1792.768 | 902.344 | 1024.371 | 1158.089 | |
| LODb | P | 0.021 | 0.035 | 0.137 | 0.007 | 0.063 |
| NP | 0.004 | 0.004 | 0.038 | 0.001 | 0.012 | |
| LOQb | P | 0.064 | 0.106 | 0.416 | 0.022 | 0.191 |
| NP | 0.012 | 0.012 | 0.114 | 0.004 | 0.037 | |
3.2.1.2. Accuracy and selectivity. The accuracy of the method gave a satisfying mean recovery with low percentage relative standard deviation (RSD%) and percentage relative error (Er%) (Table 2). This proves the high accuracy of the developed HPTLC-image analysis method for the determination of royal jelly fatty acids, and the absence of interfering spots with the chromatographic determination of these fatty acids in the samples. The percentage mean recovery was found to be higher and the percentage relative error got lower in the non-parametric regression method in comparison with the parametric one demonstrating better accuracy of the former method (Table 2). Upon applying Student's t-test for comparing sample means, it was found that the obtained t test values were higher than the critical ones and that indicated significant difference among their means (Table 2).
| Nominal fatty acid concentrationa (μg per spot) | Recovery%b | |||||||||
|---|---|---|---|---|---|---|---|---|---|---|
| 8-Hydroxyoctanoic acid | 3,10-Dihydroxydecanoic acid | 10-Hydroxy-2-decenoic acid | Decanedioic acid | 10-Hydroxydecanoic acid | ||||||
| P | NP | P | NP | P | NP | P | NP | P | NP | |
| a The fatty acid content in the sample + fatty acid content in standard fatty acids mixture added to the sample.b The mean recovery of three determinations at each concentration level of the fatty acid.c The mean of all recoveries at different concentration levels of the fatty acid.d Standard deviation of the mean of recoveries at different concentration levels of the fatty acid.e Percentage relative standard deviation.f Percentage relative error.g t-Test for comparison between two sample means, t critical = 2.12 (n1 = n2 = 9, P = 0.05). | ||||||||||
| 10 | 97.59 | 99.58 | 97.14 | 99.02 | 96.95 | 98.99 | 97.63 | 100.15 | 96.45 | 99.45 |
| 20 | 96.55 | 99.84 | 98.13 | 99.45 | 97.58 | 99.15 | 97.77 | 99.45 | 97.23 | 99.32 |
| 30 | 97.95 | 100.05 | 97.33 | 100.14 | 98.45 | 99.89 | 98.45 | 99.99 | 97.14 | 99.98 |
| Mean%c | 97.3633 | 99.8233 | 97.5333 | 99.5366 | 97.66 | 99.3433 | 97.95 | 99.8633 | 96.94 | 99.5833 |
| SDd | 0.72700 | 0.23544 | 0.52538 | 0.56500 | 0.75319 | 0.48013 | 0.43863 | 0.36678 | 0.42673 | 0.34961 |
| RSD (%)e | 0.74669 | 0.23586 | 0.53867 | 0.56763 | 0.77124 | 0.48331 | 0.44781 | 0.36729 | 0.44020 | 0.35108 |
| Er%f | 2.63666 | 0.17666 | 2.46666 | 0.46333 | 2.34 | 0.65666 | 2.05 | 0.13666 | 3.06 | 0.41666 |
| t-Testg | — | 9.65749 | — | 7.78965 | — | 5.65367 | — | 10.0388 | — | 14.3747 |
3.2.1.3. Precision. Evaluation of the repeatability (intra-day precision) and intermediate precision (inter-day precision) for the determination of royal jelly fatty acids by the developed HPTLC-image analysis method showed a good agreement among the individual test results data (Table S3†). It was observed that, the RSD% got lower in the non-parametric method in comparison with the parametric one, demonstrating better precision of the former method. The obtained F test values were higher than the critical ones and that proved the significant difference among the variance and precision of both methods (Table S3†).
| RJ1 | RJ2 | RJ3 | RJ4 | RJ5 | RJ6 | RJ7 | RJ8 | RJ9 | RJ10 | RJ11 | RJ12 | RJ13 | RJ14 | RJ15 | RJ16 | RJ17 | RJ18 | |||
|---|---|---|---|---|---|---|---|---|---|---|---|---|---|---|---|---|---|---|---|---|
| a The average mg % w/w of triplicate determinations.b Percentage relative standard deviations. | ||||||||||||||||||||
| 8-Hydroxyoctanoic acid | P | % w/wa | 2.021 | 0.522 | 0.613 | 0.588 | 0.054 | 0.475 | 0.186 | 0.224 | 0.0003 | 0.031 | 0.035 | 0.319 | 0.959 | 0.753 | 0.057 | 0.189 | 0.588 | 2.598 |
| RSD%b | 3.15 | 2.18 | 3.44 | 1.15 | 2.63 | 3.47 | 2.87 | 2.62 | 1.23 | 1.45 | 2.96 | 3.56 | 4.15 | 3.55 | 2.14 | 4.25 | 1.06 | 2.88 | ||
| NP | % w/wa | 2.067 | 0.550 | 0.655 | 0.617 | 0.094 | 0.503 | 0.227 | 0.251 | 0.040 | 0.058 | 0.076 | 0.347 | 1.002 | 0.782 | 0.097 | 0.216 | 0.630 | 2.633 | |
| RSD%b | 1.02 | 0.962 | 0.854 | 0.752 | 1.120 | 2.141 | 0.532 | 0.632 | 0.523 | 0.334 | 0.874 | 0.465 | 1.062 | 2.018 | 0.821 | 0.654 | 0.721 | 0.698 | ||
| 3,10-Dihydroxydecanoic acid | P | % w/wa | 4.699 | 1.301 | 0.658 | 0.713 | 1.197 | 2.510 | 1.304 | 1.288 | 0.125 | 0.291 | 0.840 | 1.39 | 6.203 | 4.484 | 1.660 | 1.557 | 0.621 | 2.769 |
| RSD%b | 1.023 | 2.036 | 0.947 | 3.547 | 4.235 | 2.587 | 1.879 | 0.965 | 0.874 | 1.854 | 2.369 | 3.147 | 4.258 | 0.987 | 1.014 | 1.587 | 2.854 | 3.698 | ||
| NP | % w/wa | 4.808 | 1.355 | 0.726 | 0.761 | 1.271 | 2.576 | 1.379 | 1.342 | 0.189 | 0.335 | 0.911 | 1.452 | 6.326 | 4.569 | 1.739 | 1.614 | 0.689 | 0.838 | |
| RSD%b | 0.587 | 0.658 | 0.365 | 1.321 | 1.258 | 0.987 | 0.789 | 0.587 | 0.258 | 1.025 | 0.981 | 1.547 | 1.694 | 0.258 | 0.369 | 0.598 | 0.982 | 1.025 | ||
| 10-Hydroxy-2-decenoic acid | p | % w/wa | 17.566 | 7.193 | 5.130 | 4.698 | 2.755 | 6.053 | 6.186 | 5.918 | 0.286 | 0.670 | 3.334 | 5.061 | 2.233 | 1.593 | 4.573 | 4.179 | 4.815 | 10.861 |
| RSD%b | 2.369 | 3.215 | 3.178 | 4.125 | 2.587 | 2.569 | 3.2158 | 1.025 | 0.954 | 0.9236 | 0.821 | 1.698 | 2.145 | 3.874 | 4.325 | 1.365 | 2.146 | 0.954 | ||
| NP | % w/wa | 17.469 | 7.066 | 4.860 | 4.536 | 2.451 | 5.910 | 5.930 | 5.772 | 0.632 | 0.451 | 3.039 | 4.904 | 2.606 | 1.387 | 4.295 | 4.010 | 4.540 | 10.785 | |
| RSD%b | 0.965 | 0.785 | 1.012 | 1.085 | 0.987 | 0.783 | 0.654 | 0.521 | 0.322 | 0.654 | 0.527 | 0.964 | 1.036 | 1.113 | 2.698 | 0.540 | 1.369 | 0.725 | ||
| Decanedioic acid | P | % w/wa | 0.356 | 0.272 | 0.329 | 0.220 | 0.164 | 0.154 | 0.125 | 0.104 | 0.086 | 0.139 | 0.120 | 0.081 | 1.848 | 1.122 | 0.376 | 0.229 | 0.170 | 0.186 |
| RSD%b | 3.265 | 2.587 | 3.254 | 1.458 | 1.154 | 2.487 | 3.258 | 2.147 | 0.982 | 0.977 | 0.821 | 1.023 | 1.778 | 0.951 | 1.235 | 1.587 | 2.016 | 3.487 | ||
| NP | % w/wa | 0.364 | 0.278 | 0.337 | 0.225 | 0.170 | 0.159 | 0.130 | 0.108 | 0.092 | 0.143 | 0.126 | 0.084 | 1.865 | 1.133 | 0.384 | 0.234 | 0.176 | 0.191 | |
| RSD%b | 1.087 | 1.005 | 0.954 | 0.752 | 0.541 | 1.547 | 1.004 | 1.054 | 0.725 | 0.654 | 0.587 | 0.885 | 0.964 | 0.798 | 0.652 | 0.752 | 0.654 | 1.651 | ||
| 10-Hydroxydecanoic acid | P | % w/wa | 9.726 | 2.187 | 1.424 | 1.148 | 0.558 | 2.333 | 1.338 | 1.581 | 0.093 | 0.136 | 1.281 | 2.672 | 5.368 | 4.942 | 0.668 | 0.615 | 0.875 | 4.802 |
| RSD%b | 4.258 | 3.547 | 3.115 | 2.014 | 2.020 | 3.008 | 1.965 | 2.547 | 3.547 | 4.087 | 1.887 | 2.698 | 3.254 | 4.125 | 3.998 | 2.465 | 1.982 | 0.954 | ||
| NP | % w/wa | 9.681 | 2.210 | 1.482 | 1.184 | 0.626 | 2.355 | 1.397 | 1.611 | 0.167 | 0.184 | 1.340 | 2.689 | 5.377 | 4.931 | 0.735 | 0.657 | 0.939 | 4.793 | |
| RSD%b | 1.254 | 1.115 | 0.654 | 0.964 | 0.447 | 2.541 | 1.008 | 1.567 | 2.695 | 2.487 | 0.924 | 1.254 | 1.874 | 2.146 | 2.541 | 1.054 | 1.231 | 0.574 | ||
3.3. OPLS for efficient anti-melanoma biomarker determination
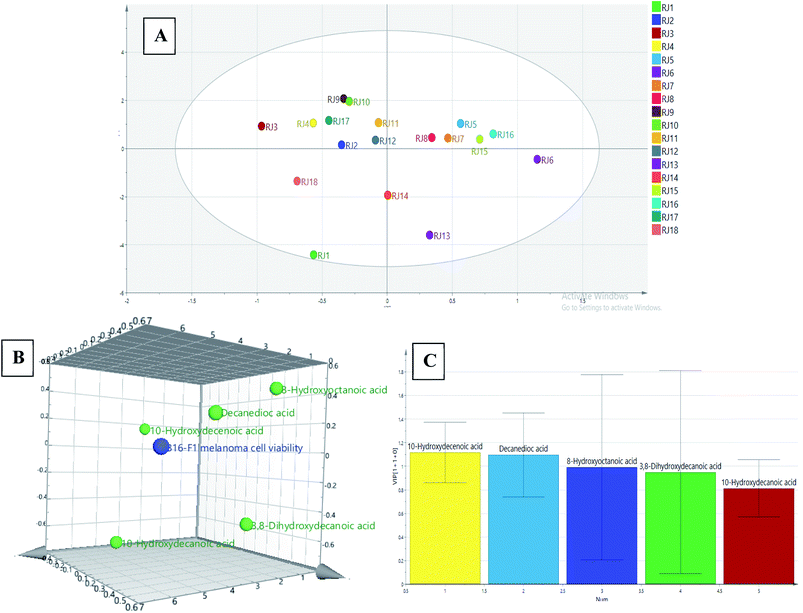
The investigation of the entire RJ fatty acids profile has not been previously reported. For the sake of that, an OPLS model for bioefficacy-directed discrimination of RJ samples was constructed. The model was built in order to correlate the chromatographic lipidomic profile with the B16F1 melanoma cell cytotoxic activity. The multivariate model X matrix (18 RJ samples × five variables) was composed of the predetermined concentrations of the five fatty acids using the NP Theil's regression method, while the B16F1 melanoma cytotoxic activities of the 18 samples (Fig. 6) served as Y matrix. The score scatter plot of the built OPLS model is presented in (Fig. 7A).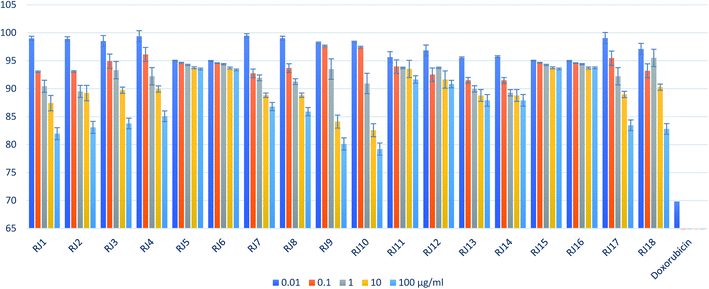 | ||
| Fig. 6 B16F1 melanoma cells cytotoxic activities of the 18 RJ samples and doxorubicin as a positive control (results are average of three determinations ± SD). | ||
The OPLS 3D loading plot (Fig. 7B) represent the Y-variables which are closely correlated to X-variables positioned near them. The first latent variable explained 62.7% of the variation followed by 6.3% variances of the second latent variables, respectively. It was noticed that the queen bee fatty acid (10-HDA) was the closest fatty acid to B16F1 melanoma cytotoxicity data point. This result was further confirmed via variable importance for the projection (VIP) plot (Fig. 7C). VIP plot highlighted that 10-HDA followed by decanedioic acid then 8-hydroxyoctanoic acid as the most influencing chemical markers on the OPLS model by possessing a threshold value greater than one. These results came in agreement with the study performed by Peng, et al.11 where 10-HDA exhibited significant reduction in B16F1 melanoma cells viability at a concentration of 1 mM. However, the study attributed the anti-melanoma activity of RJ to a single fatty acid (10-HDA) rather than considering the entire fatty acids profile. The present study is considered the first attempt to discriminate fresh and lyophilized RJ samples based on their holistic lipidomic profile to discover the efficient fatty acids reducing melanoma cell viability.
4. Conclusion
Untargeted and targeted fatty acid profiling of different royal jelly commercial and pharmaceutical products based on HPTLC-image analysis, HPTLC-MS and anti-melanoma activity testing with the use of chemometric analysis was successfully applied in this study. 8-Hydroxyoctanoic acid, 3,10-dihydroxydecanoic acid, 10-hydroxy-2-decenoic acid, decanedioic acid and 10-hydroxydecanoic acid were identified as the chemical markers responsible for the classification of royal jelly samples into fresh and lyophilized samples using principal component analysis (PCA). The parametric and non-parametric regression methods were applied for quantification of these chemical markers. The non-parametric method was better than parametric one in terms of linearity, accuracy and precision. OPLS model showed that 10-HDA was the closest fatty acid to B16F1 melanoma cytotoxicity data point, followed by decanedioic acid then 8-hydroxyoctanoic acid. This study represents the first attempt to discriminate fresh and lyophilized royal jelly samples based on their holistic lipidomic profile and to discover the efficient fatty acids reducing melanoma cell viability and can be extended for efficacy-directed discrimination of complex matrices of other natural products.Conflicts of interest
There are no conflicts to declare.References
- X. Li, C. Huang and Y. Xue, J. Med. Food, 2013, 16, 96–102 CrossRef CAS PubMed.
- K. Munstedt, Am. Bee J., 2003, 143, 647–650 Search PubMed.
- E. Ghanbari, V. Nejati and M. Khazaei, Int. J. Reprod. Biomed., 2016, 14, 519 CAS.
- S. Babaei, S. Rahimi, M. A. K. Torshizi, G. Tahmasebi and S. N. K. Miran, in Veterinary Research Forum, Faculty of Veterinary Medicine, Urmia University, Urmia, Iran, 2016, vol. 7, p. 13 Search PubMed.
- H. Kunugi and A. Mohammed Ali, Int. J. Mol. Sci., 2019, 20, 4662 CrossRef CAS PubMed.
- H.-F. Chiu, B.-K. Chen, Y.-Y. Lu, Y.-C. Han, Y.-C. Shen, K. Venkatakrishnan, O. Golovinskaia and C.-K. Wang, Pharm. Biol., 2017, 55, 497–502 CrossRef PubMed.
- Z. Aslan and L. Aksoy, Int. Braz. J. Urol., 2015, 41, 1008–1013 CrossRef PubMed.
- H. Izuta, M. Shimazawa, K. Tsuruma, Y. Araki, S. Mishima and H. Hara, BMC Complementary Altern. Med., 2009, 9, 45 CrossRef PubMed.
- M. Siavash, S. Shokri, S. Haghighi, M. Mohammadi, M. A. Shahtalebi and Z. Farajzadehgan, J. Res. Med. Sci., 2011, 16, 904 Search PubMed.
- K. Bílikova, S.-C. Huang, I.-P. Lin, J. Šimuth and C.-C. Peng, Peptides, 2015, 68, 190–196 CrossRef PubMed.
- C. C. Peng, H. T. Sun, l. P. Lin, P. C. Kuo and J. C. Li, BMC Complementary Altern. Med., 2017, 17(1), 1–8 CrossRef PubMed.
- S. R. Howe, P. S. Dimick and A. W. Benton, J. Apic. Res., 1985, 24, 52–61 CrossRef CAS.
- G. Lercker, P. Capella, L. S. Conte, F. Ruini and G. Giordani, Lipids, 1981, 16, 912–919 CrossRef CAS.
- M. F. Ramadan and A. Al-Ghamdi, J. Funct. Foods, 2012, 4, 39–52 CrossRef CAS.
- S. A. Barker, A. B. Foster, D. C. Lamb and N. Hodgson, Nature, 1959, 183, 996–997 CrossRef CAS PubMed.
- M. S. Blum, A. F. Novak and S. Taber, Science, 1959, 130, 452–453 CrossRef CAS PubMed.
- F. Ferioli, G. L. Marcazzan and M. F. Caboni, J. Sep. Sci., 2007, 30, 1061–1069 CrossRef CAS PubMed.
- N. Weaver and J. H. Law, Nature, 1960, 188, 938–939 CrossRef CAS PubMed.
- J.-F. Antinelli, S. Zeggane, R. Davico, C. Rognone, J.-P. Faucon and L. Lizzani, Food Chem., 2003, 80, 85–89 CrossRef CAS.
- B. C. Bloodworth, C. S. Harn, C. T. Hock and Y. O. Boon, J. AOAC Int., 1995, 78, 1019–1023 CrossRef CAS PubMed.
- J. Zhou, J. Zhao, H. Yuan, Y. Meng, Y. Li, L. Wu and X. Xue, Chromatographia, 2007, 66, 185–190 CrossRef CAS.
- V. A. Isidorov, U. Czyżewska, A. G. Isidorova and S. Bakier, J. Chromatogr. B: Anal. Technol. Biomed. Life Sci., 2009, 877, 3776–3780 CrossRef CAS PubMed.
- F. Ferioli, E. Armaforte and M. F. Caboni, J. Am. Oil Chem. Soc., 2014, 91, 875–884 CrossRef CAS.
- M. G. Kokotou, C. Mantzourani, R. Babaiti and G. Kokotos, Metabolites, 2020, 10(1), 40 CrossRef CAS PubMed.
- M. A. Korany, M. S. Moneeb, A. M. Asaad, N. A. El-Sebakhy and A. A. El-Banna, J. Chromatogr. Sci., 2020, 58, 520–534 CAS.
- Metabolomics - Online Course, https://www.futurelearn.com/courses/metabolomics/3, accessed April 19, 2021 Search PubMed.
- E. Gorrochategui, J. Jaumot, S. Lacorte and R. Tauler, TrAC, Trends Anal. Chem., 2016, 82, 425–442 CrossRef CAS.
- P. Ristivojević, J. Trifković, I. Vovk and D. Milojković-Opsenica, Talanta, 2017, 162, 72–79 CrossRef PubMed.
- Y.-M. Kim and H. M. Heyman, in Fungal Genomics, Springer, 2018, pp. 107–118 Search PubMed.
- J. N. Miller and J. C. Miller, Statistics and Chemometrics for Analytical Chemistry, 2010, pp. 169–170 Search PubMed.
- Y. Liu and M. S. Sheikh, Mol. Cell. Pharmacol., 2014, 6, 31–44 Search PubMed.
- R. S. Ibrahim, A. Khairy, H. H. Zaatout, H. M. Hammoda, A. M. Metwally and A. M. Salman, J. Pharm. Biomed. Anal., 2020, 179, 112990 CrossRef CAS PubMed.
- I. C. H. H. T. Guideline, in International Conference on Harmonization, Geneva, Switzerland, 2005, pp. 11–12 Search PubMed.
- P. Skehan, R. Storeng, D. Scudiero, A. Monks, J. McMahon, D. Vistica, J. T. Warren, H. Bokesch, S. Kenney and M. R. Boyd, J. Natl. Cancer Inst., 1990, 82, 1107–1112 CrossRef CAS PubMed.
- R. M. Allam, A. M. Al-Abd, A. Khedr, O. A. Sharaf, S. M. Nofal, A. E. Khalifa, H. A. Mosli and A. B. Abdel-Naim, Toxicol. Lett., 2018, 291, 77–85 CrossRef CAS PubMed.
- E. Melliou and I. Chinou, J. Agric. Food Chem., 2005, 53, 8987–8992 CrossRef CAS PubMed.
- C. Virgiliou, D. Kanelis, A. Pina, H. Gika, C. Tananaki, A. Zotou and G. Theodoridis, J. Chromatogr. A, 2020, 1616, 460783 CrossRef CAS PubMed.
- A. G. Sabatini, G. L. Marcazzan, M. F. Caboni, S. Bogdanov and L. B. D. Almeida-Muradian, Journal of ApiProduct and ApiMedical Science, 2009, 1, 1–6 CrossRef.
Footnote |
| † Electronic supplementary information (ESI) available. See DOI: 10.1039/d1ra00580d |
| This journal is © The Royal Society of Chemistry 2021 |

