
 Open Access Article
 This Open Access Article is licensed under a Creative Commons Attribution-Non Commercial 3.0 Unported Licence
A combined photoelectron-imaging spectroscopic and theoretical investigation on the electronic structure of the VO2H anion
Yongtian Wanga,
Changcai Hanab,
Jing Hongab,
Zejie Feia,
Changwu Dong *a,
Hongtao Liu*a and
Xiaogen Xiongc
*a,
Hongtao Liu*a and
Xiaogen Xiongc
aKey Laboratory of Interfacial Physics and Technology, Shanghai Institute of Applied Physics, Chinese Academy of Sciences, Shanghai 201800, P. R. China. E-mail: dongchangwu@sinap.ac.cn; liuhongtao@sinap.ac.cn
bUniversity of Chinese Academy of Sciences, Beijing 100049, P. R. China
cSino-French Institute of Nuclear Engineering and Technology, Sun Yat-sen University, Zhuhai 519082, P. R. China
First published on 24th May 2021
Abstract
The electronic structure and vibrational spectrum of the VO2H anion are explored by combining photoelectron imaging spectroscopy and density functional theoretical (DFT) calculations. The electron affinity (EA) of VO2H is determined to be 1.304 ± 0.030 eV from the vibrationally resolved photoelectron spectrum acquired at 1.52 eV (814 nm). The anisotropy parameter (β) for the EA defined peak is measured to be 1.63 ± 0.10, indicating that it is the 17a′ (4s orbital of the vanadium atom) electron attachment leading to the formation of the ground state of the VO2H anion. The vibrational fundamentals ν1, ν3, ν4 and ν5 are obtained for the neutral ground state. Experimental assignments are confirmed by energies from electronic structure calculations and Franck–Condon (FC) spectral simulations. These simulations support assigning the anion ground state as the results obtained from the B3LYP method. In addition, the molecular orbitals and bonding involved in the anionic VO2H cluster are also examined based on the present theoretical calculations.
1. Introduction
Vanadium oxides play a tremendous role in heterogeneous catalysis. Bulk or supported vanadium oxides are employed as catalysts in a number of industrial catalytic reactions aimed at energy sustainability, such as the oxidation of SO2 to SO3 in the production of sulfuric acid, oxidation of butene to phthalic anhydride and selective reduction of NOx with NH3.1–6 Exploring the structure and active sites of vanadium oxide catalysts is the key to understanding the catalytic mechanisms and designing catalysts. However, the investigations of detailed catalytic mechanisms in solid state and aqueous media are often hampered due to the complicated surface properties and environments, such as the inhomogeneity and surface defects of the catalyst, rapid aggregation, solvent effects and others. Gas-phase studies of isolated vanadium oxides can reveal molecular-insights into electronic structures of catalysts and reaction mechanisms in precisely controlled conditions. In addition, the discovery of new catalytic models in the gas phase can feed back to the design of bulk catalysts.The oxidation of the alcohols is important for more valuable industrial products such as formaldehyde, dimethylether, methyl-t-butylether and even biodiesel.1,7,8 Vanadium oxides catalysts are employed in a variety of catalytic oxidation processes of significant importance to these chemical industries. Therefore, the studies on reactivity of a range of vanadium oxides with the alcohols are the focus of sustained research efforts.3–5 Besides, alcohols and alkoxides have been proposed as intermediates in other oxidation reactions mediated by vanadium oxides.9,10 Both theoretical calculations11–15 and experimental methods16–25 are employed to study the dehydrogenation of alcohols by vanadium oxides in the gas phase. Most of these studies have focused on the reactivity of neutral and cationic vanadium oxides with alcohols, but few on anionic vanadium oxides as catalysts. Tom Waters and co-workers described the gas-phase catalytic oxidation of methanol to formaldehyde with the anion VO3− as catalyst and found that a key step in the process was the reaction of VO3− with methanol to eliminate water.19 An experimental investigation of the gas-phase ion/molecule reactions of VO2+ with a variety of alcohols shows that VO2+ induce an oxidative dehydrogenation of alcohols.16 The neutral VO2 clusters can abstract more than one hydrogen atom from CH3 and/or OH moiety of CH3OH to form VO2H1,2 products.20 Although many studies on reactivity of vanadium oxides with the alcohols in the gas-phase have been done, there are few acknowledgements on electronic structure and spectrum information of these reaction products.
In the present work, we characterize gas-phase VO2H− using photoelectron spectroscopy (PES) and density functional theory (DFT) approaches. Over the last few decades, the molecular structure and several low-lying electronic states of neutral and anion VO2− had been clearly determined by other groups using anion photoelectron spectroscopy experiments and advanced theoretical calculations.26–30 Here, we obtain the vibrationally resolved photoelectron imaging spectroscopy of VO2H− firstly, which is the product of the dehydrogenation of ethanol mediated by VO2−. The assignments of electronic configuration and vibration are all performed with the aid of electronic structure calculation and frequency analysis. The electronic configuration similarity between VO2H− and VO2− were also described.
2. Experimental and computational methods
Experimental methods
The experiment was performed using a home-built instrument with a laser vaporization source, a time-of-flight mass spectrometer coupled with velocity-map imaging (VMI) spectrometer. The apparatus have been described in detail elsewhere,31 and only a brief outline is given below. The VO2− and VO2H− anions were produced from the laser vaporization process in a supersonic expansion of the Ar/He (5%/95%) carrier gas carrying traces of ethanol at 6 atm. The second harmonic generation of Nd:YAG laser (Continuum, Minilite II) at 532 nm was used to vaporize the vanadium metal target. The anions were cooled and expanded into the McLaren–Wiley time-of-flight mass spectrometer.32 After assignment of anions, the anionic clusters of interest were mass selected into the photodetachment region and crossed with a dye laser beam, which (Spectra-Physics, 400–920 nm, linewidth 0.06 cm−1 at 625 nm) was pumped by a Nd:YAG laser (Quanta-Ray Pro 190, 10 Hz). The detached photoelectrons were extracted by a velocity-map imaging photoelectron spectrometer and recorded by a charge-coupled device camera. Each image was obtained by 5000–50![[thin space (1/6-em)]](https://www.rsc.org/images/entities/char_2009.gif) 000 laser shots at 10 Hz repetition rate. The raw imaging stands for the projection of the photoelectron density in the 3D laboratory frame on the 2D imaging detector. The original 3D distribution was reconstructed using the Maximum Entropy Velocity Legendre Reconstruction (MEVELER) technique.33 The known transitions from the detachment of the Au− are used to calibrate all images.34 The energy resolution was 30 meV at an electron kinetic energy (eKE) of 1 eV. Spectra are plotted as a function of the electron binding energy (eBE) given by eBE = hν − eKE.
000 laser shots at 10 Hz repetition rate. The raw imaging stands for the projection of the photoelectron density in the 3D laboratory frame on the 2D imaging detector. The original 3D distribution was reconstructed using the Maximum Entropy Velocity Legendre Reconstruction (MEVELER) technique.33 The known transitions from the detachment of the Au− are used to calibrate all images.34 The energy resolution was 30 meV at an electron kinetic energy (eKE) of 1 eV. Spectra are plotted as a function of the electron binding energy (eBE) given by eBE = hν − eKE.
Computational methods
Calculations of the optimized geometries and electronic structures of the anionic and neutral VO2H clusters were accomplished using the Gaussian 09 program.35 Different spin multiplicity states of the clusters were attempted to determine the ground-state geometries. The structures were fully optimized without symmetry constraints. In this study, the BP86 (ref. 36 and 37) and B3LYP38 density functionals methods were employed to optimize the lowest-energy geometries and to estimate the electronic affinity (EA) energy, that is adiabatic detachment energy (ADE), of the anionic VO2H cluster. Throughout the calculations, the augmented correlation consistent triple-zeta (aug-cc-pVTZ) basis set was adopted for the oxygen and hydrogen atoms,39 while the vanadium atomic orbital was described by the triple-zeta LANL2TZ basis set combined with the Hay and Wadt effective core potentials.40,41 Moreover, vibration analyses were performed at the same level of theory to make sure that the optimized geometries are real minimum points and to take into account the zero-point energy (ZPE) correction. The theoretical EA value was defined as the energy difference between the optimized anionic and neutral structures under considering the ZPE correction, and the VDE was calculated by considering the energy difference between the ground-state of the anion and neutral cluster with the equilibrium geometry of the anion.3. Results and discussion
Mass spectrum and PES
As shown in Fig. 1(a), the m/z of predominate anionic species is 83 corresponding to VO2−, which probably was generated from the oxide on the surface of vanadium metal rod. The m/z of 67, 68, 69, 84 and 85 corresponding to VO−, VOH1,2− and VO2H1,2− were also observed, but these peaks are much weaker than that of VO2−. The observed weak signal of VO2H− should arise from the reaction between VO2 and H2O molecules that remain in the source chamber, since the carrier gas is only Ar/He (5%/95%). When trace ethanol was added in the carrier gas Ar/He, some new characters were observed in the mass spectrum. As shown in Fig. 1(b), the mass signal of VO2H− noticeably enhanced, was almost equal strength as that of VO2−. It is obvious that the VO2− combines very easily with the hydrogen atoms in the ethanol to form VO2H−. Some new weak mass peaks were also produced, the m/z of 76, 77 and 78 corresponding to VC2Hx− (x = 1–3). The m/z of 81 and 82 was assigned to peaks of V(CH3)2/VOCH2 and VOCH3 anions. However, these mass peaks were too weak to obtain their photoelectron spectra.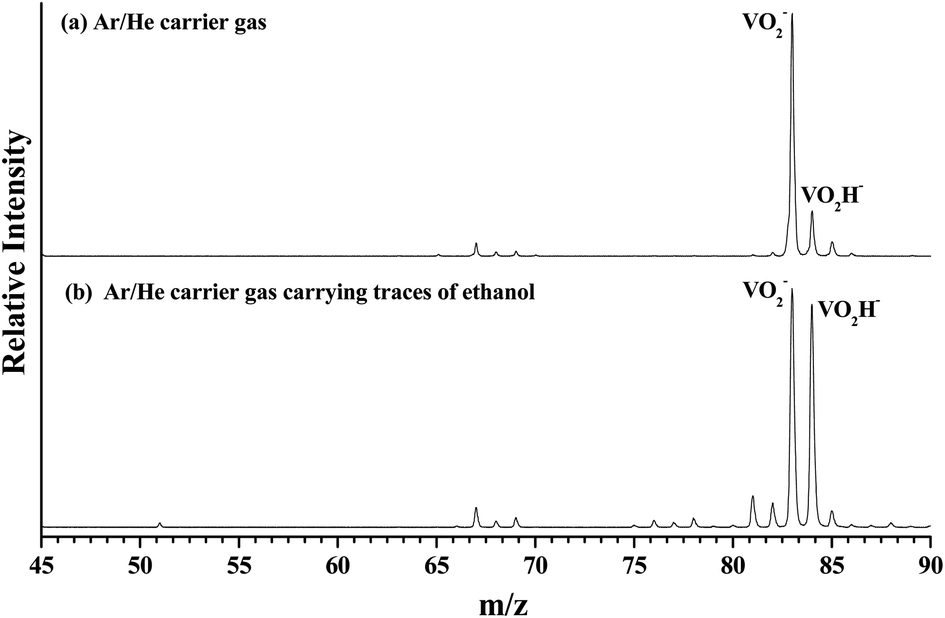 | ||
| Fig. 1 The mass spectrum of laser vaporizing the vanadium metal at 532 nm. (a) Displays the anionic cluster distribution generated by Ar/He (5%/95%) expansion gas, (b) displays the new cluster distribution after Ar/He (5%/95%) expansion gas carrying trace of ethanol. | ||
Fig. 2 depicts the photoelectron image and corresponding PES of VO2H− cluster obtained at a photon energy of 1.52 eV (814 nm). In the present experiment, the laser polarization, which is represented by a double black arrow, is parallel to the photoelectron angular distribution (PAD) of the peak X. The collected PES of VO2H− shows a series of broad peaks, which corresponding to the excited vibrational transition, arising from the transition between the ground state of VO2H− and its corresponding neutral electronic ground state. The EA of 1.304 ± 0.030 eV is deduced from the right shoulder of the strongest peak, and labeled as X. The VDE of 1.317 ± 0.030 eV is obtained from the position of strongest peak and labeled as X1. In addition, four vibrational progressions can be observed in this spectrum. The first progression is comprised from the equally spaced peaks X1–X3, equally spacing is about 100 cm−1, and offset by 104 cm−1. The peaks X4 and X5 comprise the second progression, and this progression is offset by about 460 cm−1. The third progression is offset by 734 cm−1, and comprised by peaks X6–X8, and these peaks are spacing by ∼60 cm−1. The peaks X9–X11 comprise the forth progression, which is offset by 1065 cm−1, the equally peaks spacing is also around 60 cm−1. The peak X′ is assigned to the hot band, arising from the mode 1 vibration in the ground state of VO2H− excited to its corresponding neutral electronic ground state, this frequency is about 137 cm−1. Peak positions (eBE) and assignments are summarized in Table 1. The peaks are wider than the instrumental resolution owing to unresolved rotational structure and the hot band broadening in the cluster source beam.
 | ||
| Fig. 2 Photoelectron image and the corresponding electron binding energy (eBE) spectrum of the negatively charged VO2H cluster collected at 814 nm. | ||
| Peak | eBE | Offset | Assignment |
|---|---|---|---|
| X′ | 1.287 | 0.017 | 101 |
| X | 1.304 | 0 | 000 |
| X1 | 1.317 | 0.013 | 110 |
| X2 | 1.330 | 0.026 | 120 |
| X3 | 1.343 | 0.039 | 130 |
| X4 | 1.361 | 0.057 | 310 |
| X5 | 1.367 | 0.063 | 110310 |
| X6 | 1.395 | 0.091 | 410 |
| X7 | 1.404 | 0.100 | 110410 |
| X8 | 1.411 | 0.107 | 120410 |
| X9 | 1.436 | 0.132 | 510 |
| X10 | 1.441 | 0.137 | 110510 |
| X11 | 1.449 | 0.145 | 120510 |
One of the advantages of the photoelectron imaging technique is to obtain the PAD of the detached electron. For one-photon detachment, the PAD is given by the form,
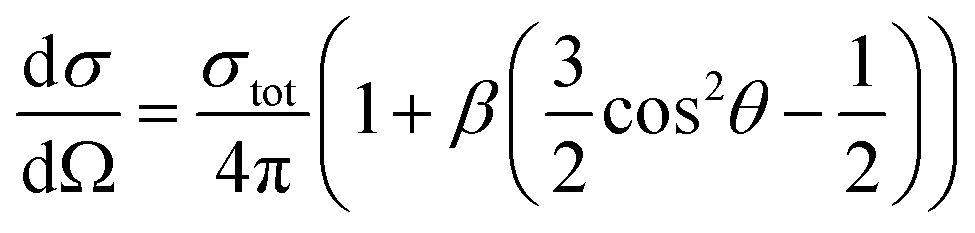 | (1) |
Cluster geometry and electronic structure calculations
The metal oxide systems are often formally considered ionic, however covalent molecular orbital theory has proven to be a useful framework for understanding the electronic structure of the 3d transition metal monoxides,45,55 and is used here for elucidating the relevant electronic states of the neutral and anionic VO2H cluster. The ground state electronic configuration of atomic V is 4s23d3. In the VO2H and VO2H−, the formal oxidation state of the vanadium atom is +3 and +2, leaving two and three metal-centered valence electrons in the neutral and anion, respectively.Earlier theoretical studies of vanadium oxides clusters have used the B3LYP and BP86 density functionals to obtain geometries, electronic states, and vibrational frequencies. B3LYP was successfully used in comparison with experimental IRPD results of various vanadium oxide clusters.46 BP86 was used to predict the electronic and structural properties of VO2 clusters.47 Many different density functional methods, including BPW91, has been made on the relative merits of different functionals, although it is believed that pure density functionals like BP86 and BPW91 are more reliable for multireference systems than B3LYP, which includes some Hartree–Fock exchange.
To improve confidence in the theoretical results, both the B3LYP and BP86 functionals are used to calculate the anion and neutral VO2H− energies, geometries, and vibrational frequencies. The geometries optimization gives two stable conformation in neutral and anionic ground state, as shown in Fig. 3. In isomer A, hydrogen atom combined with O atom form a planar Cs symmetry, and in isomer B, the hydrogen atom coordinated with center vanadium atom. Previous calculations and experiments found that neutral VO2 was doublet in ground state,48 meanwhile the anion VO2− has been assigned to be triplet in ground state. In VO2H cluster, the additional hydrogen 1s electron will change the spin multiplicity to singlet or triplet in neutral ground state, and to doublet or quartet in anionic ground state. Different spin states of the clusters were calculated, and the theoretical results are listed in Table 2. As shown in Table 2, the present calculations predict a triplet state as the global minimum of VO2H isomer A, while that of VO2H− isomer B has a doublet spin multiplicity, however only the EA predicted from a triplet state of neutral and a quartet state of anionic VO2H cluster for isomer A supports the experimentally assigned that of VO2H− discussed above.
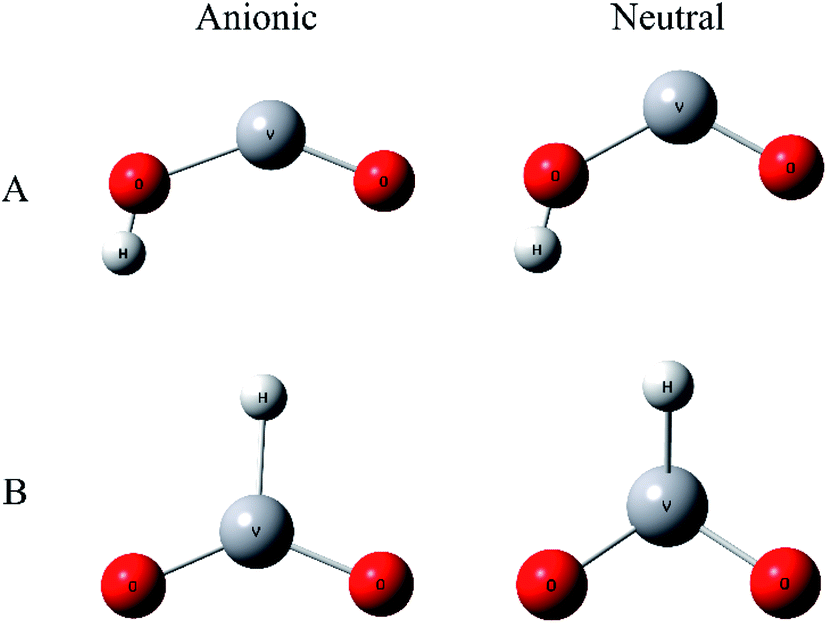 | ||
| Fig. 3 The structures scheme of A and B isomers of VO2H cluster in the anionic and neutral states. | ||
| Species | Isomer | Spin multiplicity | ΔE (eV) | EA (eV) | VDE (eV) |
|---|---|---|---|---|---|
| B3LYP/LANL2TZ | |||||
| VO2H− | A | 2 | 1.14 | 1.75 | 2.08 |
| 4 | 0.85 | 1.39 | 1.49 | ||
| B | 2 | 0.00 | 2.74 | 3.22 | |
| 4 | 2.55 | 2.10 | 2.43 | ||
| VO2H | A | 1 | 0.94 | ||
| 3 | 0.00 | ||||
| B | 1 | 0.15 | |||
| 3 | 2.21 | ||||
|
|||||
| BP86/LANL2TZ | |||||
| VO2H− | A | 2 | 1.14 | 1.99 | 2.13 |
| 4 | 0.85 | 1.33 | 1.49 | ||
| B | 2 | 0.00 | 2.33 | 2.62 | |
| 4 | 2.55 | 1.84 | 2.18 | ||
| VO2H | A | 1 | 0.94 | ||
| 3 | 0.00 | ||||
| B | 1 | 0.15 | |||
| 3 | 2.21 | ||||
The theoretical equilibrium geometries parameters of isomer A are listed in Table 3. It is necessary to note that the bond length of V–Oα, in which the oxygen atom is bonded to the hydrogen atom, is longer than that of V–Oβ, in which the oxygen atom is on the other side of the cluster, by 0.2–0.3 Å for both anionic and neutral VO2H cluster. That means the interaction between O and H atom much more weakens the strength of V–O bond. When electron was detached, H–O bond length is not changed obviously, but bond angle θ of OVO is changed in different trend for B3LYP and BP86 methods. In B3LYP method, the θ value is enlarged from 144.1° to 155.9°, while that is decreased from 137.5° to 122.9° under BP86 theory. This should be due to the different methods giving the different ground-state electronic configuration.
| Species | Spin multiplicity | RV–Oαa (Å) | RV–Oβa (Å) | RH–Oα (Å) | θb (deg) | φ (deg) |
|---|---|---|---|---|---|---|
| a The Oα is the oxygen atom which is adjacent to hydrogen atom. The Oβ is the oxygen atom on the other side.b Bond angle of OVO. | ||||||
| B3LYP/LANL2TZ | ||||||
| VO2H− | 4 | 1.905 | 1.657 | 0.956 | 144.1 | 0 |
| VO2H | 3 | 1.841 | 1.611 | 0.955 | 155.9 | 0 |
|
||||||
| BP86/LANL2TZ | ||||||
| VO2H− | 4 | 1.895 | 1.654 | 0.968 | 137.5 | 0 |
| VO2H | 3 | 1.801 | 1.605 | 0.968 | 122.9 | 0 |
With the aid of optimized ground-state geometries of the neutral and anionic V2OH clusters, we can theoretically predict the EA values of the V2OH− cluster, which can be used to compare with the experimentally determined data. Such a comparison is of great value to test the accuracy of the chosen theoretical method and optimized geometries. Additionally, as other investigations earlier, it is a challenge to precisely predict the EA of VO2H since there are relatively large differences between previous experiment and theory on VO and VO2 clusters.47–50 It has been demonstrated and emphasized that the energy levels of transition metal doped clusters are very sensitive to the choice of the level of theory and basis set.51 Therefore, apart from determining the ground state of VO2H−, another motivation of the present study is to explore the appropriate method and level that can better describe the electronic properties of hydride vanadium dioxide clusters. According to the present calculations, the theoretical EA of VO2H− cluster are 1.390 and 1.332 eV for B3LYP and BP86 methods, respectively, which are listed in Table 3. The calculated EA values under two methods are in good agreement with experimentally measure data deviating by just 5% and 1% for that of VO2H−, respectively. This demonstrates that the level of theory and basis set used here is appropriate to predict the electronic properties of hydride vanadium dioxide clusters.
To get more insights in the molecular orbitals (MOs) and bonding of the anionic VO2H− cluster, we have calculated the occupied valence Kohn–Sham MOs of the VO2H0/−1 clusters. As shown in Fig. 4, for both theoretical methods, there are 9 valence electronic MOs formed in the VO2H− cluster, including 3 singly occupied MOs (HOMO–HOMO-2) on vanadium atom, 5 bonding orbitals (HOMO-3–HOMO-7) on V–O bond and one bonding orbital (HOMO-8) of O–H bond. The only difference between B3LYP and BP86 method is the energy order of 17a′ and 16a′. For B3LYP method, the single electron occupied HOMO (17a′) is mainly 4s character on vanadium atom, this orbital symmetry is very similar with the 10a1 orbital of the VO2−. Under BP86 method, the HOMO (16a′) is mainly 3dz2 character on vanadium atom, this orbital symmetry is similar with the 4b1 orbital of the VO2−.48,52 It means the singly occupied orbital symmetries of anionic VO2H is very similar with that of VO2−. From the shapes of bonding orbitals on V–O, it induces that the V–O bond is more ionic character since the charge density is mainly distributed on the oxygen atoms. As shown in B3LYP method, the extra electron was detached from single occupied HOMO (17a′) of the anionic VO2H to form the neutral cluster, supporting the experimentally observed β value (1.63 ± 0.10) and the triplet character of the ground state of VO2H.
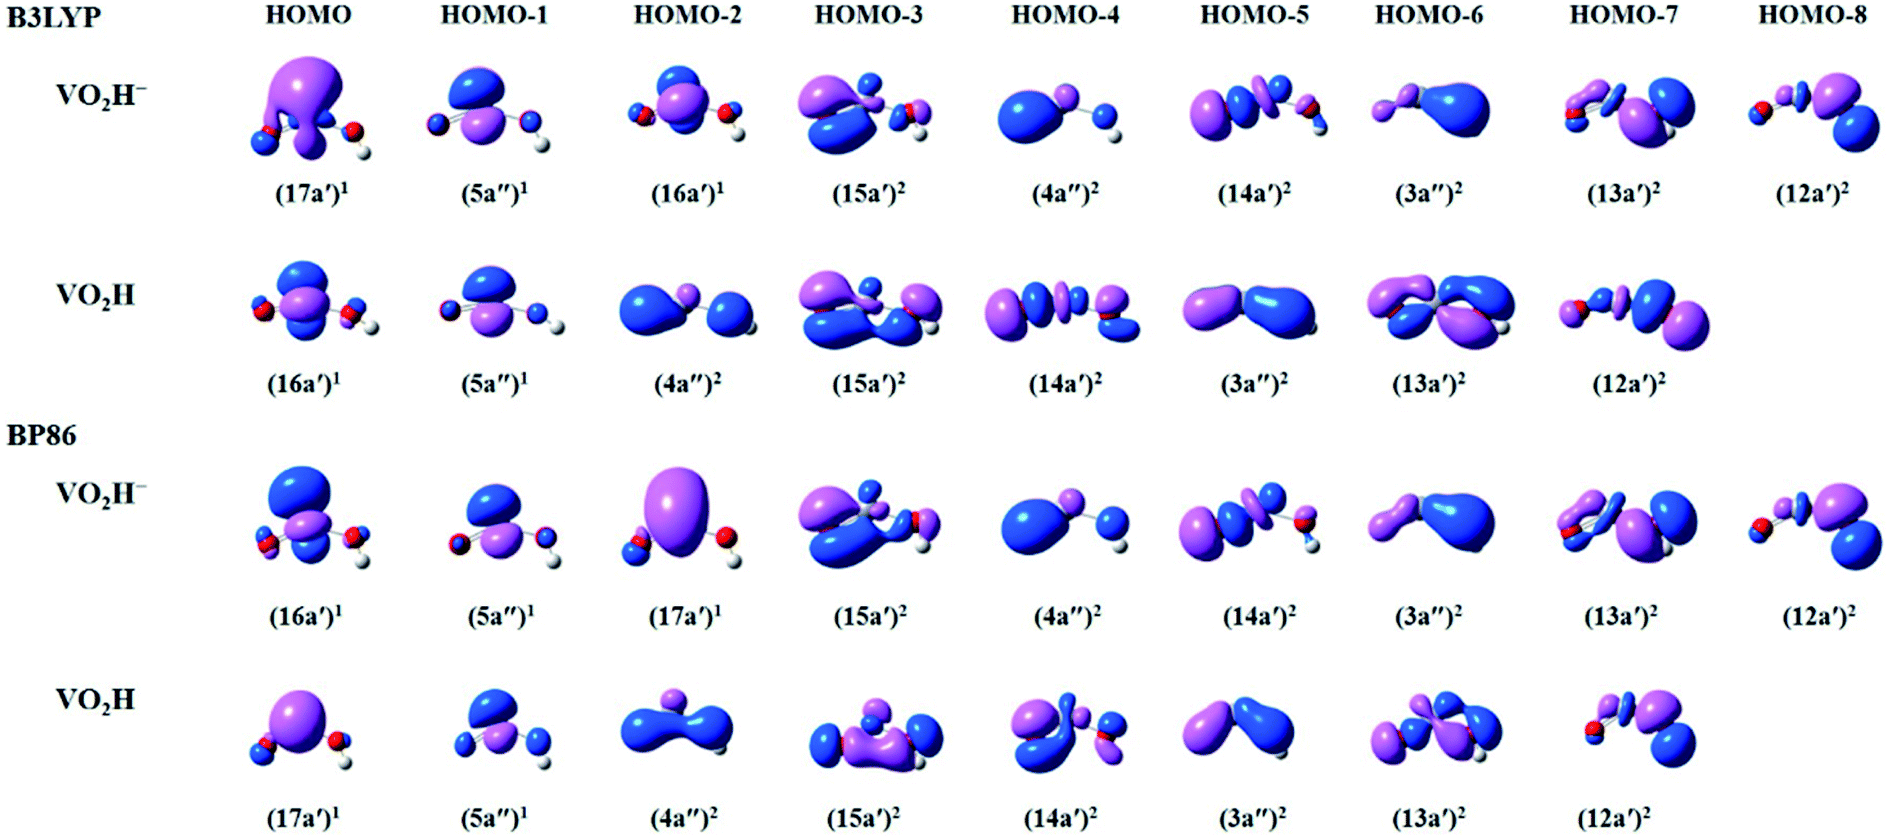 | ||
| Fig. 4 The plots of select occupied valence Kohn–Sham molecular orbitals (MOs) calculated by B3LYP (top) and BP86 (bottom) methods, describing the bonding in the anionic and neutral VO2H species. | ||
Vibration assignments
Assignments are made based on the measured peak position and the calculated frequencies. The vibrational progressions in Fig. 2 are characteristic of the electronically distinct photodetachment transition, with four active vibrational modes in the neutral ground state of the cluster. As above calculation results, the anionic and neutral VO2H clusters are planner and bent asymmetrical structure, respectively. For neutral VO2H cluster, there are six active vibrational modes: ν1 OVO in-plane molecular bending vibration, ν2 OH out of plane bending vibration, ν3 OH in-plane bending vibration, ν4 V–OH stretching vibration, ν5 V–O stretching vibration and ν6 OH stretching vibration. The ν2 mode is inactive because both geometries of anionic and neutral cluster in the ground electronic state are planar. And the frequency of ν6 is out of the photoelectron detachment laser energy region. The calculated vibrational frequencies of the neutral ground electronic state by B3LYP and BP86 methods are listed in Table 4, respectively.| Method | Vibrational frequencies (cm−1) | |||||
|---|---|---|---|---|---|---|
| ν1 | ν2 | ν3 | ν4 | ν5 | ν6 | |
| B3LYP | 80 | 417 | 440 | 690 | 1043 | 3940 |
| BP86 | 183 | 270 | 496 | 717 | 1022 | 3771 |
Peak X is assigned the vibrational origin of neutral ground state. Furthermore, the EAs are calculated to be 1.33 and 1.39 eV by the BP86 and B3LYP functional, respectively, in good agreement with the eBE of peak X at 1.304 eV. The first progression of ∼100 cm−1 consist of peaks X1–X3. The calculated frequency of the ν1 bending mode in the neutral ground state is 80 cm−1, lies within 20 cm−1 of this spacing (Table 1), so this set of peaks is assigned to 10n (n = 1–3) progression. Offset by 460 cm−1 from the peak X is the series of peaks X4 and X5. The calculated ν3 OH in-plane bending vibration frequency is 440 cm−1 for the neutral ground state, so this second series of peaks is assigned to the 10n310 (n = 0–1) progression. The third progression, which is offset by 734 cm−1 from the vibrational origin, consist of peaks X6–X8. The peaks spacing is about 60 cm−1. The calculated ν4 V–OH stretching vibration frequency is 690 cm−1, so this series of peaks is assigned to the 10n410 (n = 0–2) progression. The fourth progression, which consists of peaks X9–X11, is offset by 1065 cm−1 from the vibrational origin band. This value is in close agreement with the calculated frequency for ν5 V–O stretching vibration, which is 1043 cm−1, so this series of peaks is assigned to the 10n510 (n = 0–2) progression. The assigned EAs, adiabatic term energies, and vibrational frequencies are summarized in Table 1.
Franck–Condon simulations
According to the B3LYP method the singly occupied HOMO orbital is mainly 4s character on vanadium atom. Under BP86 method, the HOMO orbital is mainly 3dz2 character on vanadium atom. It means that the two methods give the different electronic configuration for the VO2H− ground state. It is difficult to confirm the electronic configuration by calculated EA values, because those values obtained from two methods are all close to the experimental value. Although the experimental β value support the results of B3LYP, it is still not a sufficient condition.To aid in the assignment of the photodetachment transitions, particularly the identification of the anion ground state, FC simulations are calculated from the two quartet anion states to the triplet neutral states. B3LYP and BP86 give different geometry changes upon electron detachment, thus the calculated FC spectra should be discriminatory with the results from either method. Both B3LYP and BP86 geometries, normal modes, and vibrational frequencies are used for an internally consistent set of FC simulations. FC simulations are generated using the ezSpectrum program,53 which calculates FC intensities in the harmonic oscillator approximation but with full Duschinsky mixing of the normal modes.54
The temperature in our molecular beam was estimated at about 200 K by FC simulation. The spectra curves of calculated FC intensities are displayed in Fig. 5, showing simulated detachment spectra from the quartet anion state to the triplet neutral state. All geometries, vibrational frequencies, and normal mode coordinates are those calculated at both B3LYP/LANL2TZ and BP86/LANL2TZ levels to make comparison. The horizontal scale is internal energy within a given electronic state, thus all vibrational origins are set to zero energy.
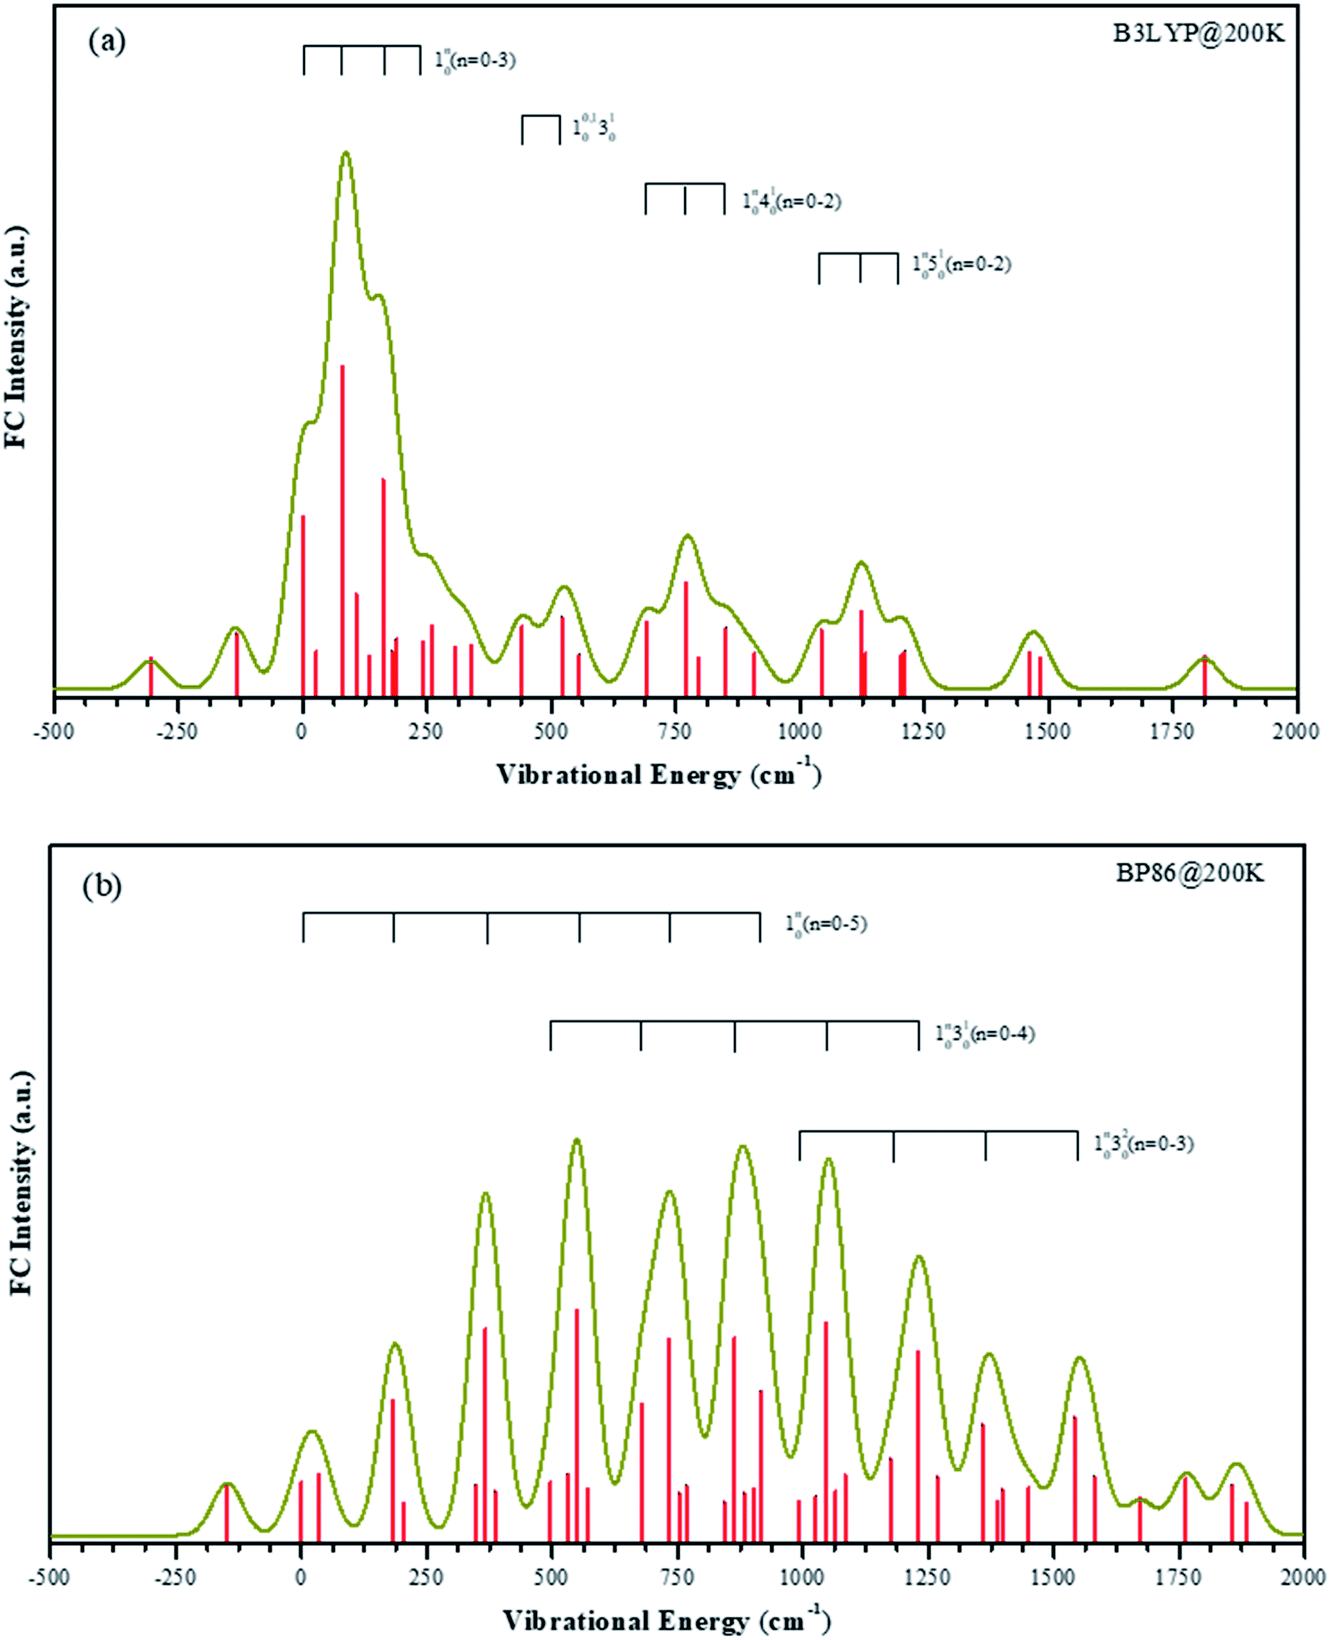 | ||
| Fig. 5 Calculated FC intensities for the transitions from the anion ground electronic states to the neutral ground electronic states of VO2H at about 200 K, the dark yellow line is the simulated spectra curves. Panel (a) is the simulated spectra using vibrational frequencies calculated by B3LYP method. Panel (b) is the simulated spectra using vibrational frequencies calculated by BP86 method. | ||
The FC profiles support the choice of the electronic state calculated by B3LYP method as the anion ground state. As shown in the experimental spectrum, there are four series vibrational progressions. The offsets from the original band are 105 cm−1, 460 cm−1, 734 cm−1 and 1065 cm−1, respectively. Under the B3LYP level, the FC profiles are in good agreement with the characters in the experimental bands, and the frequency lies within 30 cm−1 of the offset. The simulated four vibrational progressions are offset by 81 cm−1, 440 cm−1, 690 cm−1 and 1043 cm−1, corresponding to the ν1, ν2, ν3 and ν4 active modes, respectively. In the spectrum, the experimental 10n (n = 1–3) progression peak in intensity n = 1. The most intense transition in the simulated band by B3LYP level is also the 110 transition, while under BP86 method, this simulated band is assigned at 130 transition, which is offset by 550 cm−1. In the experimental result, the frequency of hot band X′ is less than original band X by 137 cm−1, which is the frequency of ν1 mode in the anionic ground state. Thus, frequency of ν1 mode in the VO2H− ground state is larger than in its corresponding neutral ground state. The simulated frequencies of 101 and 110 are 135 cm−1 and 81 cm−1 under B3LYP level, respectively. However, under BP86 level, these two values are 149 cm−1 and 183 cm−1, respectively. Obviously, the results given by B3LYP method is agreement with that in experiment.
According to the FC simulated profiles, we assigned the electronic configuration of anion ground state by B3LYP method. Henceforth refer to the single electron occupied HOMO orbital of VO2H− is mainly 4s character on vanadium atom, which is similar with the 10a1 orbital of the VO2−.
4. Conclusion
In conclusion, from the changes in mass spectrum when trace ethanol was carried, we induced that the VO2− combined very easily with the hydrogen atom in the ethanol to form VO2H−. The photoelectron imaging spectrum of anionic VO2H cluster was firstly reported at a photon energy of 1.52 eV (815 nm). The observed PES possesses obvious vibrational structures, from which the EA of VO2H was measured to be 1.304 ± 0.030 eV and VDE was 1.317 ± 0.030 eV. The ν1, ν3, ν4 and ν5 vibrational frequencies are also obtained for the ground state of neutral VO2H. The calculated energetics, FC profiles and observed PADs (β value), vibrational peaks all suggest that the ground state of VO2H− is X 4A′′ with the highest single occupied MO is mainly 4s components rather than 3d component on vanadium atom. Even relatively simple transition metal systems, such as neutral and anion VO2H, can have several uncertain electronic configurations, and disentangling them requires careful analysis by different theoretical methods, FC simulation and combining with the high-resolution experimental technique. Comparing with the accomplished level for main group chemistry, the theoretical methods of transition metal computational chemistry are still being developed. The electron VIM technique is still useful to explore the HOMO shape and is aided to assign the electronic configuration in this cluster system.Conflicts of interest
There are no conflicts to declare.Acknowledgements
This work was supported by the National Natural Science Foundation of China (21773289), Youth Innovation Promotion Association, Chinese Academy of Science (Grant No. 2021255) and “Strategic Priority Research Program” of the Chinese Academy of Sciences, Grant No. XDA02020000. H. T. Liu would like to acknowledge support of Hundred Talents Program (CAS).Notes and references
- B. M. Weckhuysen and D. E. Keller, Catal. Today, 2003, 78, 25–46 CrossRef CAS.
- G. C. Bond and S. F. Tahir, Appl. Catal., 1991, 71, 1–31 CrossRef CAS.
- M. Baltes, Synthesis and characterization of vanadium oxide catalysis, 2003 Search PubMed.
- B. Grzybowska-Świerkosz, Appl. Catal., A, 1997, 157, 263–310 CrossRef.
- G. Deo, I. Wachs and J. Haber, Crit. Rev. Surf. Chem., 1994, 4, 141–187 CAS.
- H. Knözinger and J. Weitkamp, Handbook of heterogeneous catalysis, 1997, vol. 3 Search PubMed.
- N. Armaroli and V. Balzani, Angew. Chem., Int. Ed., 2007, 46, 52–66 CrossRef CAS PubMed.
- G. Centi, F. Cavani and F. Trifirò, Selective oxidation by heterogeneous catalysis, Springer Science & Business Media, 2012 Search PubMed.
- D. Schröder, M. Engeser, H. Schwarz, E. C. E. Rosenthal, J. Döbler and J. Sauer, Inorg. Chem., 2006, 45, 6235–6245 CrossRef PubMed.
- D. Schröder, J. Loos, M. Engeser, H. Schwarz, H.-C. Jankowiak, R. Berger, R. Thissen, O. Dutuit, J. Döbler and J. Sauer, Inorg. Chem., 2004, 43, 1976–1985 CrossRef PubMed.
- L. Zhao, M. Tan, J. Chen, Q. Ding, X. Lu, Y. Chi, G. Yang, W. Guo and Q. Fu, J. Phys. Chem. A, 2013, 117, 5161–5170 CrossRef CAS PubMed.
- J. Döbler, M. Pritzsche and J. Sauer, J. Am. Chem. Soc., 2005, 127, 10861–10868 CrossRef PubMed.
- A. Fielicke, R. Mitrić, G. Meijer, V. Bonačić-Koutecký and G. von Helden, J. Am. Chem. Soc., 2003, 125, 15716–15717 CrossRef CAS PubMed.
- P. Boulet, A. Baiker, H. Chermette, F. Gilardoni, J. C. Volta and J. Weber, J. Phys. Chem. B, 2002, 106, 9659–9667 CrossRef CAS.
- N. A. Moore, R. Mitrić, D. R. Justes, V. Bonačić-Koutecký and A. Castleman, J. Phys. Chem. B, 2006, 110, 3015–3022 CrossRef CAS PubMed.
- M. Engeser, D. Schröder and H. Schwarz, Eur. J. Inorg. Chem., 2007, 2454–2464 CrossRef CAS.
- M. Engeser, D. Schröder and H. Schwarz, Chem.–Eur. J., 2005, 11, 5975–5987 CrossRef CAS PubMed.
- S. Feyel, L. Scharfenberg, C. Daniel, H. Hartl, D. Schröder and H. Schwarz, J. Phys. Chem. A, 2007, 111, 3278–3286 CrossRef CAS PubMed.
- T. Waters, A. G. Wedd and R. A. J. O'Hair, Chem.–Eur. J., 2007, 13, 8818–8829 CrossRef CAS PubMed.
- F. Dong, S. Heinbuch, Y. Xie, J. J. Rocca and E. R. Bernstein, J. Phys. Chem. A, 2009, 113, 3029–3040 CrossRef CAS PubMed.
- D. R. Justes, N. A. Moore and A. W. Castleman, J. Phys. Chem. B, 2004, 108, 3855–3862 CrossRef CAS.
- Y. Cao, X. Zhao, B. Xin, S. Xiong and Z. Tang, J. Mol. Struct.: THEOCHEM, 2004, 683, 141–146 CrossRef CAS.
- T. Feng and J. Vohs, J. Phys. Chem. B, 2005, 109, 2120–2127 CrossRef CAS PubMed.
- L. A. Gambaro, J. Mol. Catal. A: Chem., 2004, 214, 287–291 CrossRef CAS.
- T. Waters, G. N. Khairallah, S. A. Wimala, Y. C. Ang, A. Richard and A. G. Wedd, Chem. Commun., 2006, 4503–4505 RSC.
- J. B. Kim, M. L. Weichman and D. M. Neumark, J. Chem. Theory Comput., 2014, 10, 5235–5237 CrossRef CAS PubMed.
- M. F. A. Hendrickx and V. T. Tran, J. Chem. Theory Comput., 2014, 10, 4037–4044 CrossRef CAS PubMed.
- S. F. Vyboishchikov and J. Sauer, J. Phys. Chem. A, 2000, 104, 10913–10922 CrossRef CAS.
- H. Wu and L.-S. Wang, J. Chem. Phys., 1998, 108, 5310–5318 CrossRef CAS.
- J. B. Kim, M. L. Weichman and D. M. Neumark, J. Chem. Phys., 2014, 140, 034307 CrossRef PubMed.
- Y.-T. Wang, C.-C. Han, Z.-J. Fei, C.-W. Dong and H.-T. Liu, J. Phys. Chem. A, 2020, 124, 5590–5598 CrossRef CAS PubMed.
- W. Wiley and I. H. McLaren, Rev. Sci. Instrum., 1955, 26, 1150–1157 CrossRef CAS.
- B. Dick, Phys. Chem. Chem. Phys., 2014, 16, 570–580 RSC.
- J. Ho, K. M. Ervin and W. Lineberger, J. Chem. Phys., 1990, 93, 6987–7002 CrossRef CAS.
- M. J. Frisch, G. W. Trucks, H. B. Schlegel, G. E. Scuseria, M. A. Robb, J. R. Cheeseman, G. Scalmani, V. Barone, B. Mennucci and G. A. Petersson, et al., Gaussian 09, Revision A.1, Gaussian, Inc., Wallingford, CT, 2009 Search PubMed.
- A. D. Becke, Phys. Rev. A: At., Mol., Opt. Phys., 1988, 38, 3098–3100 CrossRef CAS PubMed.
- J. P. Perdew, Phys. Rev. B: Condens. Matter Mater. Phys., 1986, 33, 8822–8824 CrossRef PubMed.
- A. D. Becke, J. Chem. Phys., 1993, 98, 5648–5652 CrossRef CAS.
- T. H. Dunning Jr, J. Chem. Phys., 1989, 90, 1007–1023 CrossRef.
- P. J. Hay and W. R. Wadt, J. Chem. Phys., 1985, 82, 299–310 CrossRef CAS.
- L. E. Roy, P. J. Hay and R. L. Martin, J. Chem. Theory Comput., 2008, 4, 1029–1031 CrossRef CAS PubMed.
- J. Cooper and R. N. Zare, J. Chem. Phys., 1968, 48, 942–943 CrossRef CAS.
- K. L. Reid, Annu. Rev. Phys. Chem., 2003, 54, 397–424 CrossRef CAS PubMed.
- S. J. Peppernick, K. D. D. Gunaratne and A. W. Castleman Jr, Proc. Natl. Acad. Sci. U. S. A., 2010, 107, 975–980 CrossRef CAS PubMed.
- A. J. Mere, Annu. Rev. Phys. Chem., 1989, 40, 407–438 CrossRef.
- K. R. Asmis, G. Meijer, M. Brümmer, C. Kaposta, G. Santambrogio, L. Wöste and J. Sauer, J. Chem. Phys., 2004, 120, 6461–6470 CrossRef CAS PubMed.
- M. F. A. Hendrickx and V. T. Tran, J. Chem. Theory Comput., 2014, 10, 4037–4044 CrossRef CAS PubMed.
- J. B. Kim, M. L. Weichman and D. M. Neumark, J. Chem. Phys., 2014, 140, 0343071–0343079 Search PubMed.
- S. F. Vyboishchikov and J. Sauer, J. Phys. Chem. A, 2000, 104, 10913–10922 CrossRef CAS.
- M. Pykavy and C. van Wüllen, J. Phys. Chem. A, 2003, 107, 5566–5572 CrossRef CAS.
- J. F. Harrison, Chem. Rev., 2000, 100, 679–716 CrossRef CAS PubMed.
- J. B. Kim, M. L. Weichman and D. M. Neumark, J. Chem. Theory Comput., 2014, 10, 5235–5237 CrossRef CAS PubMed.
- V. A. Mozhayskiy and A. I. Krylov, ezSpectrum, 2009, see http://iopenshell.usc.edu/downloads Search PubMed.
- F. Duschinsky, Acta Physicochim. URSS, 1937, 7, 551 Search PubMed.
- Y.-L. Li, X.-G. Xiong and H.-T. Liu, Nucl. Sci. Tech., 2019, 30(5), 70 CrossRef.
| This journal is © The Royal Society of Chemistry 2021 |