DOI:
10.1039/D1RA02332B
(Paper)
RSC Adv., 2021,
11, 18708-18716
Inhibition effect of ZrF4 on UO2 precipitation in the LiF–BeF2 molten salt
Received
24th March 2021
, Accepted 18th May 2021
First published on 24th May 2021
Abstract
The dissolution–precipitation behavior of zirconium dioxide (ZrO2) in molten lithium fluoride–beryllium fluoride (LiF–BeF2, (2![[thin space (1/6-em)]](https://www.rsc.org/images/entities/char_2009.gif) :1 mol, FLiBe)) eutectic salt at 873 K was studied. The results of the dissolution experiment showed that the saturated solubility of ZrO2 in the FLiBe melt was 3.84 × 10⁻³ mol kg−1 with equilibrium time of 6 h, and its corresponding apparent solubility product (K′sp) was 3.40 × 10⁻⁵ mol3 kg−3. The interaction between Zr(IV) and O2− was studied by titrating lithium oxide (Li2O) into the FLiBe melt containing zirconium tetrafluoride (ZrF4), and the concentration of residual Zr(IV) in the melt gradually decreased due to precipitate formation. The precipitate corresponded to ZrO2, as confirmed by the stoichiometric ratio and X-ray diffraction analysis. The K′sp was 3.54 × 10⁻⁵ mol3 kg−3, which was highly consistent with that from the dissolution experiment. The obtained K′sp of ZrO2 was in the same order of magnitude as that of uranium dioxide (UO2), indicating that a considerable amount of ZrF4 could inhibit the UO2 formation when oxide contamination occurred in the melt containing ZrF4 and uranium tetrafluoride (UF4). Further oxide titration in the LiF–BeF2–ZrF4 (5 mol%)–UF4 (1.2 mol%) system showed that ZrO2 was formed first with O2− addition less than 1 mol kg−1, and the precipitation of UO2 began only after the O2− addition reached 1 mol kg−1 and the precipitation of ZrO2 decreased the ZrF4 concentration to 0.72 mol kg−1 (3 mol%). Lastly, UO2 and ZrO2 coprecipitated with further O2− addition of more than 1 mol kg−1. The preferential formation of ZrO2 effectively avoided the combination of UF4 and O2−. This study provides a solution for the control of UO2 precipitation in molten salt reactors.
:1 mol, FLiBe)) eutectic salt at 873 K was studied. The results of the dissolution experiment showed that the saturated solubility of ZrO2 in the FLiBe melt was 3.84 × 10⁻³ mol kg−1 with equilibrium time of 6 h, and its corresponding apparent solubility product (K′sp) was 3.40 × 10⁻⁵ mol3 kg−3. The interaction between Zr(IV) and O2− was studied by titrating lithium oxide (Li2O) into the FLiBe melt containing zirconium tetrafluoride (ZrF4), and the concentration of residual Zr(IV) in the melt gradually decreased due to precipitate formation. The precipitate corresponded to ZrO2, as confirmed by the stoichiometric ratio and X-ray diffraction analysis. The K′sp was 3.54 × 10⁻⁵ mol3 kg−3, which was highly consistent with that from the dissolution experiment. The obtained K′sp of ZrO2 was in the same order of magnitude as that of uranium dioxide (UO2), indicating that a considerable amount of ZrF4 could inhibit the UO2 formation when oxide contamination occurred in the melt containing ZrF4 and uranium tetrafluoride (UF4). Further oxide titration in the LiF–BeF2–ZrF4 (5 mol%)–UF4 (1.2 mol%) system showed that ZrO2 was formed first with O2− addition less than 1 mol kg−1, and the precipitation of UO2 began only after the O2− addition reached 1 mol kg−1 and the precipitation of ZrO2 decreased the ZrF4 concentration to 0.72 mol kg−1 (3 mol%). Lastly, UO2 and ZrO2 coprecipitated with further O2− addition of more than 1 mol kg−1. The preferential formation of ZrO2 effectively avoided the combination of UF4 and O2−. This study provides a solution for the control of UO2 precipitation in molten salt reactors.
1. Introduction
Molten salt reactors (MSRs) use molten fluoride mixtures, usually lithium fluoride–beryllium fluoride mixed melt (LiF–BeF2 (2:1 mol, FLiBe)) as the carrier solvent of fuel, with uranium tetrafluoride (UF4) or thorium tetrafluoride (ThF4) dissolved as fuel salt.1–3 However, these fluorides can absorb water due to their hygroscopic nature, and pyrohydrolysis commonly occurs upon melting, thus producing an active oxide impurity (O2−) (eqn (1)).4,5| | |
H2O + 2F− = 2HF + O2−
| (1) |
Unfortunately, UF4 has a high sensitivity toward O2− in fluoride melts and forms some insoluble compounds of oxides or oxyfluorides,6 e.g., uranium dioxide (UO2) according to our previous investigations (eqn (2)).7,8
| | |
UF4 + 2O2− = UO2(s) + 4F−.
| (2) |
The large accumulation of the fuel precipitate UO2 would generate a superheated area in the reactor and cause a criticality risk.7–11 Hence, the generation of UO2 in the fuel salt should be strictly controlled to ensure the safe operation of MSR. Two methods have been proposed to protect uranium from UO2 precipitate formation. One method is to remove the O2− impurity in the fuel salt before loaded into the reactor, whereas the other approach is to develop feasible additives to collect O2− or facilitate the solubility of UO2 in molten fluorides during the MSR operation. The Oak Ridge National Laboratory (ORNL) has proposed that bubbling hydrogen fluoride and hydrogen gas (HF/H2) mixtures into the salt is an effective means to remove O2− (eqn (3)).12–14
| | |
O2− + 2HF(g) = H2O(g) + 2F−.
| (3) |
However, the HF/H2 purification method has a limited capacity for oxide removal and cannot totally eliminate the O2− due to the chemical equilibrium. Moreover, the active oxygen still can be produced through the unexpected nuclear reaction and brought by the cover gas and the external environment.11,12,15 That means, the residual O2− impurity contained in fluorides is inevitable and the formation of UO2 during the MSR operation remains possible.
Therefore, the development of certain feasible additives to timely collect O2− or the improvement of the solubility of UO2 in the molten fluorides is more effective. Zirconium tetrafluoride (ZrF4) may be a good selection, which has a strong affinity toward oxide and is a good oxide getter that can easily capture O2− to form zirconium oxides (e.g., ZrO2) or zirconium oxy-fluoride species (e.g., ZrOF2 and Zr2OF104−) in the molten fluorides.16,17 In this manner, the combination of U(IV) and O2− can be effectively avoided. Shen et al.16 have studied the interactions between Zr(IV) and O2− in lithium fluoride–sodium fluoride–potassium fluoride (LiF–NaF–KF (46.5:11.5:42 mol%, FLiNaK)) molten salt and found that different products are formed at different molar ratios of nZr(IV)/nO2−. ZrO2 is first formed with nZr(IV)/nO2− ≤ 0.5, and the formed ZrO2 redissolves into the melt as Zr2OF104− when nZr(IV)/nO2− > 0.5. These results indicate that the free oxide ions (O2−) in the melt can be converted into oxyfluoride complex species (Zr2OF104−) with enough ZrF4 additive, which further prevents the UO2 generation successfully. Besides, Gibilaro18 has found that the addition of calcium oxide (CaO) into a ZrF4-containing lithium fluoride–calcium fluoride (LiF–CaF2) salt leads to the formation of a close to equimolar mixture of solid ZrO2 and ZrO1.3F1.4. Korenko et al.19 and our previous studies7,8,16,20 have used X-ray diffraction (XRD) phase analysis and electrochemical techniques and discovered the ZrO2 formation when oxide contamination occurs in the ZrF4-containing systems (i.e., LiF–NaF–KF–ZrF4 and LiF–NaF–KF–UF4–ZrF4), whereas only UO2 is observed in the systems without ZrF4 (i.e., LiF–NaF–KF–UF4 and LiF–BeF2–UF4). These studies demonstrate that O2− in zirconium-based systems can be reduced by forming Zr(IV) oxide or oxyfluorides, preventing the UO2 precipitation.
ZrF4 can also increase the solubility of oxides because of its strong affinity toward oxygen ions. Song et al.21 have studied the dissolution behavior of chromium sesquioxide (Cr2O3) in various molten fluorides and found that the ZrF4 additive remarkably increases the solubility of Cr2O3 by 19 and 2 times in FLiNaK and FLiBe molten salt, respectively, most likely yielding the dissolution product of [ZrOxFy]4−2x−y complex species. Peng et al.17 have studied the dissolution–precipitation behaviors of UO2 in molten fluorides and found that ZrF4 can also improve the solubility of UO2. Their results show that the maximum solubility of UO2 in FLiNaK melt increases by a factor of 5.76 (i.e., increase from 0.247 wt% to 1.422 wt%) when the added ZrF4 concentration is up to 2.91 wt% and the oxide is dissolved as UOF2 and ZrOF2 species. These studies demonstrate that ZrF4 can easily combine with oxygen ions and form soluble Zr(IV)–oxyfluorides to improve the solubility of oxides.
From the above, ZrF4 is probably an ideal additive for controlling the precipitation of UO2 in molten fluorides. Moreover, ZrF4 has a low neutron-absorption cross-section, which allows its use in the fuel of MSR. Based on this finding, ORNL10,11,22 adopts the LiF–BeF2–ZrF4–UF4 (65:29.1:5:0.9 mol%) as the fuel salt of the molten salt reactor experiment, and the use of 5 mol% ZrF4 successfully raises the oxide tolerance (the maximum allowable amount of O2− added without the production of UO2 in the molten salt) to above 100 ppm compared with that of 30 ppm in the molten salt breeder reactor by using a zirconium-free system, i.e., LiF–BeF2–ThF4–UF4 (71.7:16:12:0.3 mol%). At present, the thorium molten salt reactor-liquid fuel (type 1) (TMSR-LF1) program of China is being launched in the Shanghai Institute of Applied Physics, Chinese Academy of Sciences (SINAP@CAS), which also uses a zirconium-containing system composed of LiF–BeF2–ZrF4–UF4 (65.1:28.7:5:1.2 mol%) as the fuel salt.
In this paper, the dissolution–precipitation behaviors of ZrO2 and the interactions between Zr(IV) and O2− in the FLiBe melt are first studied. Then the apparent solubility product (K′sp) of ZrO2 is obtained and compared with that of UO2 to predict the generation of oxide precipitations in the fuel salt containing both UF4 and ZrF4. The oxide titration experiment is performed in the FLiBe–ZrF4 (5 mol%)–UF4 (1.2 mol%) system, and the evolutions for the equilibrium concentrations of U(IV), Zr(IV), and O2− with oxide additions are studied to further confirm above theoretical prediction. Finally, the inhibiting effect of ZrF4 on UO2 formation is further verified. This study provides an effective solution for controlling and monitoring the nuclear fuel precipitation (UO2) in molten fluorides, which is of great importance for the safe operation of MSR.
2. Experimental
2.1 Molten salt
The highly purified FLiBe (99.9%) eutectic salt with eutectic temperature of 733 K was prepared and supplied by the SINAP@CAS. The received FLiBe eutectic salt was stored in a glovebox and further dehydrated before use by heating under vacuum from ambient temperature to its melting point for 72 h, to guarantee the high-purity of salt and ensure the reliability of the experiments. During this process, the moisture absorbed by the salt was effectively removed. In order to avoid residual HF remaining in FLiBe, the melt was further purified by sparging the ultra-pure H2 for 8 h. The FLiBe–ZrF4 and FLiBe–ZrF4–UF4 melts were thus prepared by artificially adding ZrF4 (99.99%; Sigma-Aldrich) and UF4 (99.99%; China North Nuclear Fuel Co., Ltd) to the prepared FLiBe salt.
2.2 Experimental method
During the dissolution experiments, the excess of powdery ZrO2 (ca. 5 g, 99.99%; Sigma-Aldrich) was manufactured into sheets by tableting. The ZrO2 sheet was dissolved in 50 g FLiBe melt contained in a vitreous carbon crucible, and the saturated solution of FLiBe–ZrO2 was formed after equilibrium time. The ZrO2 sheet was immersed in the salt bath with a graphite pellet holder, as shown in Fig. 1(a). The melt was sampled after the extraction of the pellet from the bath. Thus, no ZrO2 compound would stick to the sampler, and all the zirconium in the sample was considered to be obtained from ZrO2 dissolution and could reflect the solubility of ZrO2.
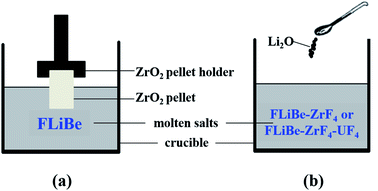 |
| | Fig. 1 Schematics of the (a) dissolution and the (b) oxide titration experiments. | |
During the oxide titration experiments, the oxide ions (O2−) were introduced to the FLiBe–ZrF4 and FLiBe–ZrF4–UF4 baths in the form of lithium oxide (Li2O, 99.99%; Sigma-Aldrich), as shown in Fig. 1(b). The interaction between M(IV) (M = Zr or U) and O2− in the melt would produce ZrO2 (ρ = 5.89 g cm−3) or UO2 (ρ = 10.96 g cm−3) precipitate and gradually deposit to the bottom of the bath (ρ ≈ 2 g cm−3). When the system reached equilibrium, the supernatant of the molten salt was sampled. The sampling process addressed the use of sintered nickel filter, which prevented the precipitates from sticking to the sampler as proposed by the ORNL,23 to ensure the accuracy of the experimental results.
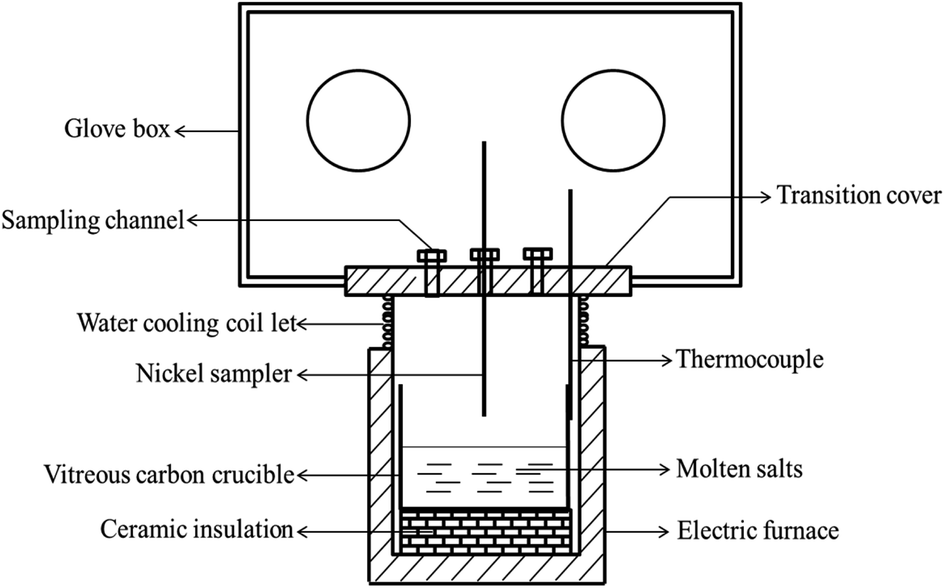
The schematic of the experimental apparatus used in present study was shown in Fig. 2, which was described in detail in our previous studies.7,8,16,17,20,21,24 The whole experiment was conducted in a glove box protected by dry argon atmosphere (99.999%), and the oxygen and water contents in the glove box were both strictly controlled below 0.5 ppm.
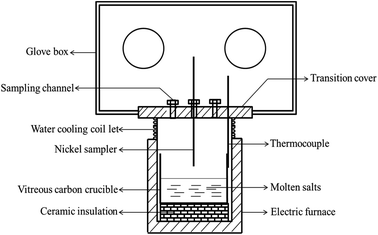 |
| | Fig. 2 Schematic of the experimental set-up. | |
2.3 Analytical techniques
The oxide concentration in molten fluorides was determined using the LECO oxygen detector (RO600, LECO Co., Ltd) through the carbothermal reduction technique, which was in accordance with the work of Mediaas25,26 and our previous studies.7,8,16,20 Herein, the result measured by LECO was the total oxide content including O2− and oxide in oxygenated anions. The oxygenated anions in the melts were determined using ICE ion chromatography (IC, ICS-2100, Dionex Co., Ltd.) with a valve-switching technology.8
The concentration of Zr(IV) or U(IV) ions in molten fluorides was determined using inductively coupled plasma optical emission spectroscopy (ICP-OES, Arcos, Spectro Co., Ltd). The detailed testing process has been described previously.7,8,17 The oxide precipitates formed in molten salt were analyzed using the XRD technique (DY3614, PANzlytical Co., Ltd).
3. Results
3.1 Concentration of free oxide ions (O2−) in molten fluorides
The oxygen in fluoride salt exists in two forms: (i) free oxide ions (O2−) and (ii) oxygenated anions (e.g., SO42−, NO3−, and PO43−). However, only O2− could form oxide precipitates (e.g., UO2 and ZrO2) due to its high sensitivity toward UF4 and ZrF4 in molten fluorides. Therefore, the O2− concentration in molten fluorides should be measured to clarify the dissolution–precipitation behavior of the fuel salt for MSR. The practical O2− concentration ([O2−]) in molten fluorides was determined by subtracting the oxide concentration in oxygenated anions ([O]IC) from the total oxide concentration ([O]LECO), as shown in eqn (4). Table 1 gives the oxide analysis results of two batches of FLiBe melts used in the present study. As shown in Table 1, the total oxygen content of 1# FLiBe was 145 ppm, and the oxygenated anions included NO3−, SO42−, and PO43− with content of 83, 55, and 6 ppm, respectively. According to the mass proportion of oxide in the oxygenated anion, the oxide concentrations in NO3−, SO42−, and PO43− were 64, 37, and 4 ppm, respectively. Thus, the sum of oxide concentration in these three oxygenated anions were up to 105 ppm, and the O2− content was 40 ppm in accordance with eqn (4). Likewise, the O2− content of 2# FLiBe was 1383 ppm.| | |
[O2−] = [O]LECO − [O]IC.
| (4) |
Table 1 Oxide analysis results of the FLiBe melts used in the present study
| Batch number of FLiBe |
Total oxide concentration ([O]LECO)/ppm |
Oxygenated anion concentration/ppm |
Oxide in oxygenated anions ([O]IC)/ppm |
O2− concentration ([O2−])/ppm |
| 1# (for oxide titration experiment) |
145 |
NO3− |
83 |
105 |
40 (2.5 × 10⁻³ mol kg−1) |
| SO42− |
55 |
| PO43− |
6 |
| 2# (for dissolution experiment) |
1500 |
NO3− |
135 |
117 |
1383 (8.64 × 10⁻² mol kg−1) |
| SO42− |
19 |
| PO43− |
— |
3.2 K′sp of ZrO2
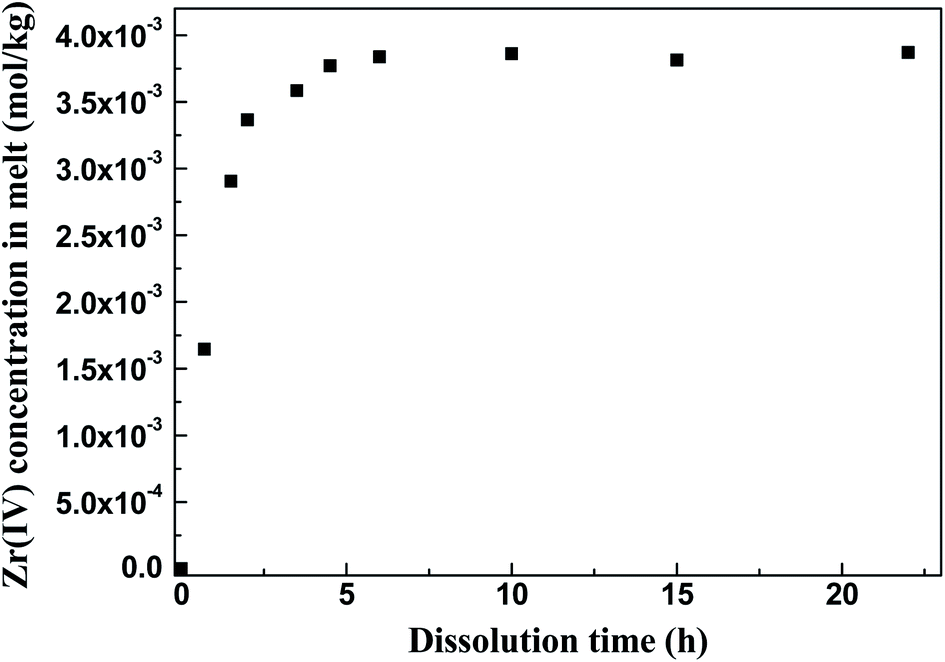
3.2.1 Dissolution method: FLiBe–ZrO2 system. The ZrO2 pellet was immersed into the FLiBe melt to determine the solubility of ZrO2 in this melt. The melt was sampled at different holding times at 873 K, and the Zr(IV) concentration in each sample was measured. Fig. 3 gives the plots of Zr(IV) concentration in the melt versus the dissolution time of ZrO2. Apparently, the initial zirconium concentration in the FLiBe melt was below the detection limit of ICP-OES (<0.01 ppm or 1 × 10⁻⁷ mol kg−1) and could not be detected. When the ZrO2 was dissolved for the first 2 h, the Zr(IV) concentration remarkably increased to 3.37 × 10⁻³ mol kg−1. Afterwards, the growth rate of Zr(IV) concentration slowed down, and its value gradually increased to 3.84 × 10⁻³ mol kg−1 when the dissolution time further increased to 6 h. Then, no remarkable difference was observed in the results of samples collected from 6 h to 22 h, and the Zr(IV) concentration finally maintained at approximately 3.84 × 10⁻³ mol kg−1, which corresponded to the solubility of ZrO2 with an equilibrium time of 6 h.
 |
| | Fig. 3 Zr(IV) concentration versus the dissolution time of ZrO2 in the FLiBe melt at 873 K. | |
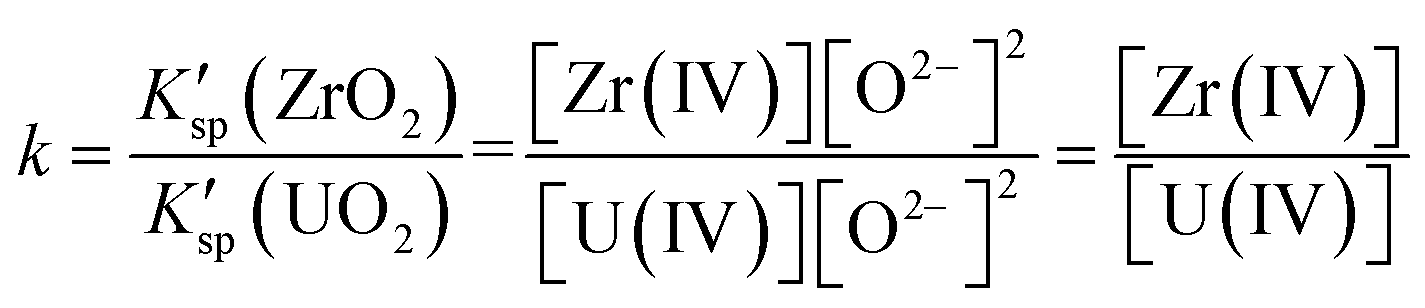
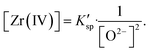
In the FLiBe–ZrO2 system, when the dissolution equilibrium of ZrO2 was achieved, the substances of ZrO2 compound, Zr(IV), and O2− ions, coexisted and equilibrated, as shown in eqn (5). Thus, the real solubility product (Ksp) of ZrO2 could be obtained by multiplying the equilibrium activity of Zr(IV) (aZr(IV)) and O2− (aO2−), as shown in eqn (6). Actually, a certain deviation existed between the activity (a) and the apparent concentration, and this deviation could be quantitatively expressed using the activity coefficient (γ) with the value less than 1, as shown in eqn (7) and (8). In fact, the [Zr(IV)] and [O2−] values obtained by ICP-OES, LECO, and IC techniques were the results of apparent concentrations. Thus, the real solubility product (Ksp) of ZrO2 could be calculated through eqn (6), where K′sp is the apparent solubility product that can be obtained using experimental methods, as shown in eqn (9). However, the measurement of a and γ (γ1 for Zr(IV) and γ2 for O2−, which can be considered as constant in this case) in molten fluorides is a challenging task and leads to a difficult determination of the real Ksp. Nevertheless, the present study only considered the apparent concentration to deal with this issue, and the K′sp calculation could also make sense in case of apparent concentration consideration (eqn (9)).
| | |
ZrO2(s) ↔ Zr(IV) + 2O2−.
| (5) |
| | |
Ksp = aZr(IV)·(aO2−)2 = γ1γ22·[Zr(IV)][O2−]2 = γ1γ22·K′sp.
| (6) |
| | |
aZr(IV) = γ1·[Zr(IV)].
| (7) |
| | |
K′sp = [Zr(IV)][O2−]2.
| (9) |
| | |
[O2−] = [O2−]ZrO2 + [O2−]FLiBe.
| (10) |
| | |
[O2−]ZrO2 = 2[Zr(IV)].
| (11) |
Then, the equilibrium [Zr(IV)] and [O2−] were measured to determine the value of K′sp. In accordance with the solubility of ZrO2 in FLiBe, as shown in Fig. 3, the equilibrium [Zr(IV)] in the bath was 3.84 × 10⁻³ mol kg−1, whereas the O2− concentration caused by ZrO2 dissolution ([O2−]ZrO2) was twice of the [Zr(IV)], i.e., 7.68 × 10⁻³ mol kg−1 (eqn (5) and (11)). Besides, the initial O2− content in the FLiBe melt ([O2−]FLiBe) was 8.64 × 10⁻² mol kg−1 (1383 ppm, Table 1). Thus, the equilibrium [O2−] was 9.41 × 10⁻² mol kg−1, which was obtained using the sum of [O2−]ZrO2 and [O2−]FLiBe (eqn (10)). Then, with the obtained values of [Zr(IV)] and [O2−], the K′sp was calculated to be 3.40 × 10⁻⁵ mol3 kg−3 (eqn (9)).
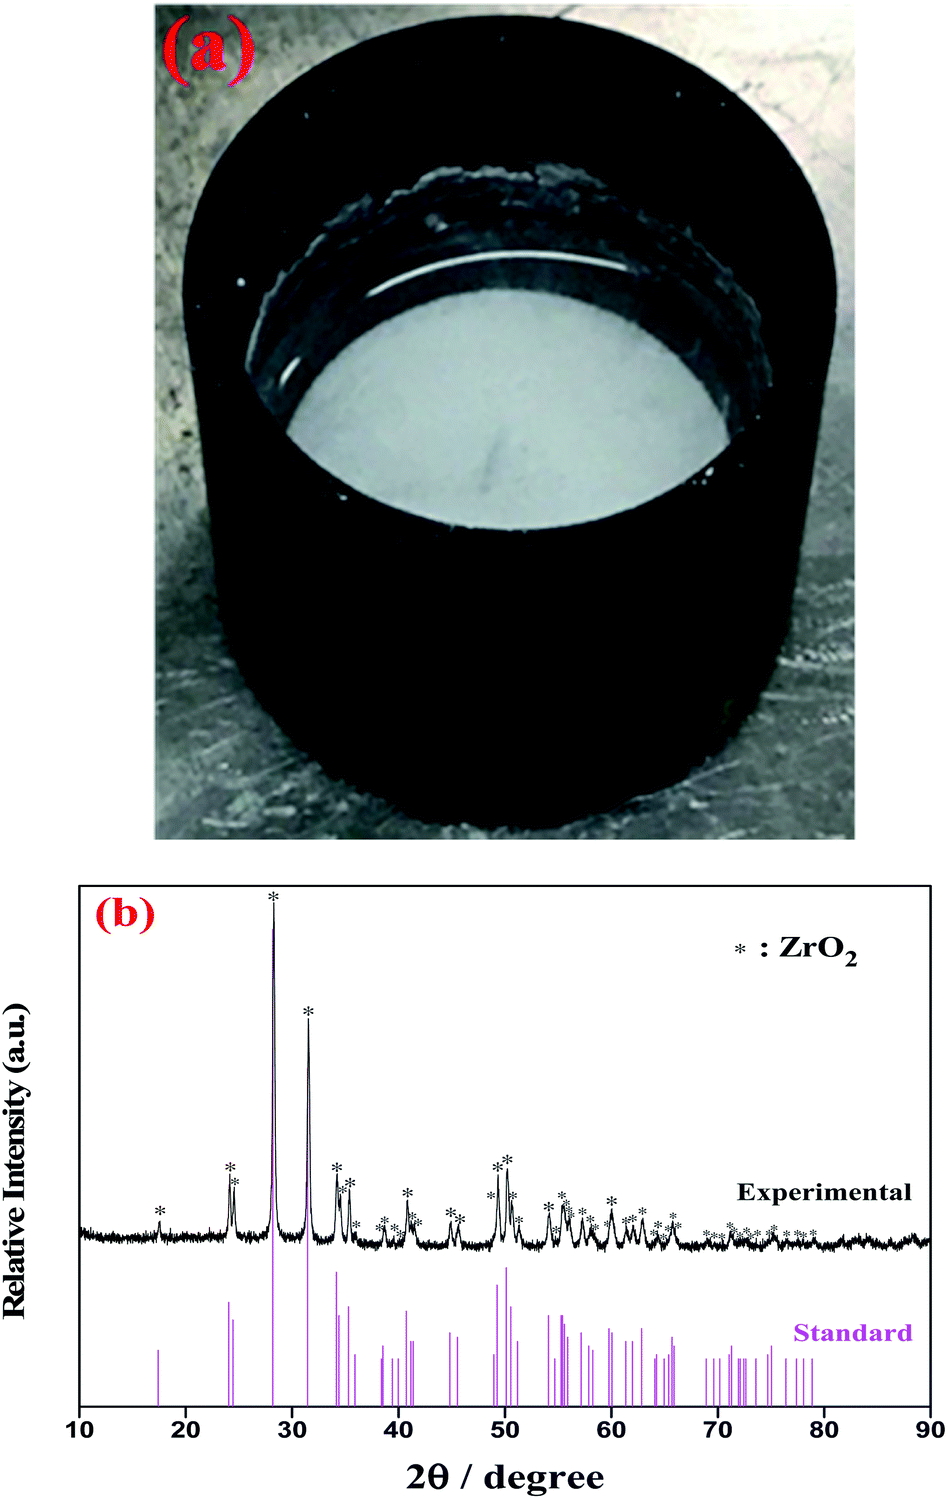
3.2.2 Oxide titration method: FLiBe–ZrF4–Li2O system. Oxide ions in the form of Li2O were gradually added to the FLiBe–ZrF4 (5 mol%) melt to investigate the interaction between Zr(IV) and O2− and its corresponding product. Then, the supernatant melt was sampled after the system reached equilibrium at 873 K, and the Zr(IV) concentration in each sample was analyzed. Table 2 shows the variation of Zr(IV) concentration with different oxide additions at 873 K. Apparently, the residual Zr(IV) concentration in the melt linearly decreased with increasing oxide addition, and the slope of this fitted straight line was 0.51, which approximately equaled to 0.5, as shown in Fig. 4. This result meant a zirconium-containing precipitate with the stoichiometry of 1Zr4+:2O2−, probably ZrO2 or ZrxO2xFy species, was formed. Moreover, a kind of white precipitate at the bottom of the melting bath was observed during oxide titration, as shown in Fig. 5(a). To identify the precipitated species, the bottom precipitate was sampled, distilled (to remove the residual matrix salt) and further transferred for XRD analysis. The result confirmed that this precipitate corresponded to ZrO2, as shown in Fig. 5(b).
Table 2 Residual Zr(IV) and O2− concentrations in the FLiBe–ZrF4 (5 mol%) melt with different oxide additions, and the variation of calculated K′sp (ZrO2) value (equilibrium time: 10 h; temperature: 873 K)
| Added O2− (mol kg−1) |
Equilibrium [Zr(IV)] in melt (mol kg−1) |
Equilibrium [O2−] in melt (mol kg−1) |
K′sp of ZrO2 (mol3 kg−3) |
| 0 |
1.33 |
— |
— |
| 0.11 |
1.29 |
5.20 × 10⁻³ (83 ppm) |
3.49 × 10⁻⁵ |
| 0.16 |
1.27 |
5.29 × 10⁻³ (85 ppm) |
3.55 × 10⁻⁵ |
| 0.26 |
1.23 |
5.43 × 10⁻³ (87 ppm) |
3.63 × 10⁻⁵ |
| 0.34 |
1.18 |
5.48 × 10⁻³ (88 ppm) |
3.54 × 10⁻⁵ |
| 0.47 |
1.08 |
5.71 × 10⁻³ (91 ppm) |
3.52 × 10⁻⁵ |
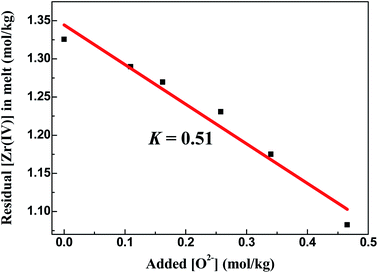 |
| | Fig. 4 Linear relationship between the residual [Zr(IV)] and the added [O2−] in the FLiBe–ZrF4 (5 mol%) melt at 873 K. | |
 |
| | Fig. 5 (a) The observed white precipitate formed at the bottom of the FLiBe–ZrF4 (5 mol%) melt with O2− addition at 873 K. (b) XRD pattern of this precipitate obtained after distillation treatment. | |
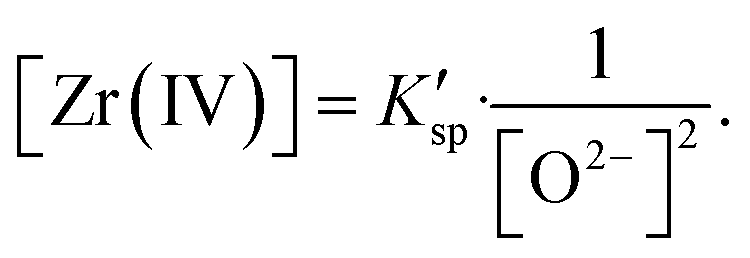
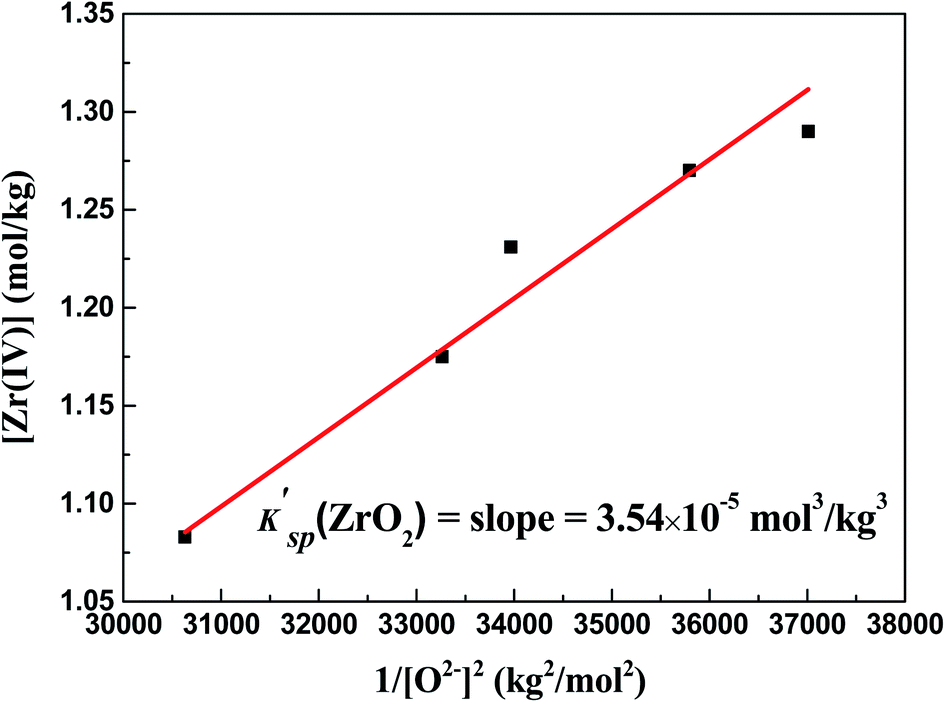
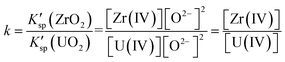
With the formation of ZrO2, its K′sp could be calculated by multiplying the equilibrium concentration of O2− by Zr(IV) (eqn (9)). As shown in Table 2, when the added O2− increased from 0 mol kg−1 to 0.47 mol kg−1, the remaining Zr(IV) in the melt gradually decreased from 1.33 mol kg−1 to 1.08 mol kg−1 whereas the equilibrium O2− concentration increased from 5.20 × 10⁻³ mol kg−1 to 5.71 × 10⁻³ mol kg−1. Thus, a set of K′sp values were obtained respectively during each oxide addition, and the results located within (3.49–3.63) × 10−5 mol3 kg−3. The slight variation in the K′sp may be attributed to the testing error caused by the chemical analysis. The eqn (9) could be written as:
| |
 | (12) |
The linear relationship between the residual [Zr(IV)] and 1/[O2−]2 was fitted (Fig. 6), and the slope of this straight line corresponded to the statistical result of K′sp. Thus, the final result of K′sp was determined to be 3.54 × 10⁻⁵ mol3 kg−3. This value was highly consistent with that obtained by the dissolution method in FLiBe–ZrO2 system (3.40 × 10⁻⁵ mol3 kg−3), as stated in Sect. 3.2.1.
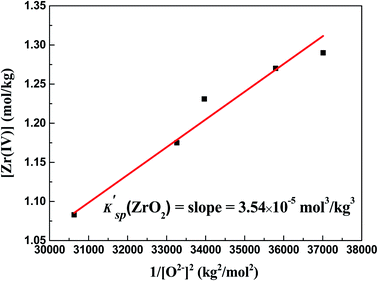 |
| | Fig. 6 Determination of K′sp (ZrO2) in the FLiBe–ZrF4 (5 mol%) melt with O2− additions at 873 K: linear relationship between the residual [Zr(IV)] and 1/[O2−]2. | |
3.3 Oxide titration to the molten FLiBe–ZrF4–UF4 system
Oxide ions in the form of Li2O were gradually added to the FLiBe–ZrF4 (5 mol%)–UF4 (1.2 mol%) melt to investigate the inhibiting effect of ZrF4 on UO2 formation. Then, the evolutions of the equilibrium concentrations of Zr(IV), U(IV), and O2− in the melt with oxide addition were determined, and the results could be shown in two stages, as shown in Fig. 7.
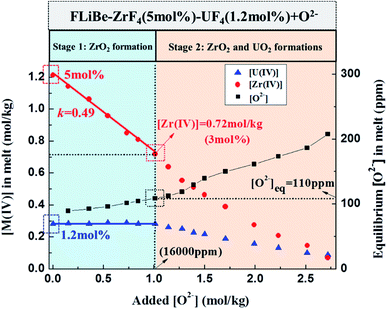 |
| | Fig. 7 Evolutions of the equilibrium [Zr(IV)], [U(IV)], and [O2−] in the FLiBe–ZrF4 (5 mol%)–UF4 (1.2 mol%) melt with oxide additions at 873 K. | |
3.3.1 Stage 1: ZrO2 formation (O2− addition <1 mol kg−1). The initial Zr(IV) and U(IV) contents of the molten salt were 5 mol% (1.21 mol kg−1) and 1.2 mol% (0.28 mol kg−1), respectively. Before the added O2− reached 1 mol kg−1, the residual Zr(IV) concentration in melt linearly decreased to 0.72 mol kg−1 and the U(IV) concentration almost remained invariable, whereas the equilibrium O2− increased from 90 ppm to 110 ppm. This result indicated that only zirconium-containing precipitate was formed in this period. The slope of the linear relationship between the residual [Zr(IV)] and the added [O2−] (0–1 mol kg−1) was fitted as 0.49, which approximately equaled to 0.5 (Fig. 7), presuming that insoluble ZrO2 or ZrxO2xFy species was formed in the melt. Moreover, a kind of white precipitate was observed at the bottom of the bath during experiment, and XRD analysis further proved that this precipitate corresponded to ZrO2 (Fig. 8). Therefore, only ZrO2 precipitate was formed with oxide addition less than 1 mol kg−1.
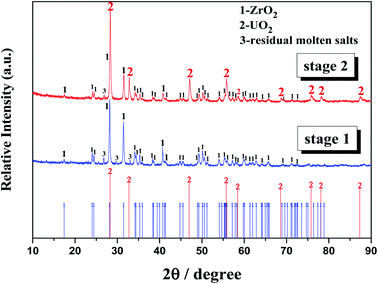 |
| | Fig. 8 XRD patterns of the bottom samples obtained in the FLiBe–ZrF4 (5 mol%)–UF4 (1.2 mol%) melt with oxide additions after distillation treatment. Stage 1: oxide addition <1 mol kg−1; stage 2: oxide addition >1 mol kg−1. | |
3.3.2 Stage 2: ZrO2 and UO2 formations (O2− addition ≥1 mol kg−1). When the added O2− reached 1 mol kg−1, the U(IV) concentration drop began, and the equilibrium O2− at this time was 110 ppm. When the added O2− exceeded 1 mol kg−1 and reached 2.72 mol kg−1, the Zr(IV) and U(IV) in melt were simultaneously consumed and finally decreased to 0.07 and 0.09 mol kg−1, respectively. Meanwhile the equilibrium O2− further increase to 208 ppm. These results indicated that both zirconium-containing and uranium-containing precipitates were formed in this stage. In addition, the stoichiometry of the total reacted metal ions M(IV) (M = Zr or U) and the added O2− was approximately 1:2 during this stage. After completion of the experiment, two kinds of precipitates were observed at the bottom of salt. The white one corresponded to ZrO2 and the rufous one corresponded to UO2, as confirmed by XRD (Fig. 8). Therefore, both ZrO2 and UO2 were formed with oxide addition more than 1 mol kg−1.
4. Discussion
4.1 K′sp: analysis of oxide precipitation behavior in the FLiBe melt
The K′sp of ZrO2 and UO2 in FLiBe melt were compared to clarify the precipitation law of these two oxides. According to our previous investigation,8 the K′sp (UO2) in the FLiBe melt obtained using the dissolution and the oxide titration methods at 873 K were 1.67 × 10⁻⁵ and 1.33 × 10⁻⁵ mol3 kg−3, respectively. In this work, the K′sp (ZrO2) using the dissolution and the oxide titration methods at 873 K were 3.40 × 10⁻⁵ and 3.54 × 10⁻⁵ mol3 kg−3, respectively. As an equilibrium constant, the Ksp theoretically depended on temperature only, and the present results also agreed well with those reported by ORNL at the same temperature,22 as summarized in Table 3.
Table 3 Comparison between K′sp (ZrO2) and K′sp (UO2) and their ratio K′sp (ZrO2)/K′sp (UO2) (k) in the FLiBe melt at 873 K
| |
K′sp by dissolution method (mol3 kg−3) |
K′sp by oxide titration method (mol3 kg−3) |
Ksp reported by ORNL22 (mol3 kg−3) |
| ZrO2 |
3.40 × 10⁻⁵ |
3.54 × 10⁻⁵ |
3.20 × 10⁻⁵ |
| UO2 |
1.67 × 10⁻⁵ (ref. 8) |
1.33 × 10⁻⁵ (ref. 8) |
1.20 × 10⁻⁵ |
| k |
2.04 |
2.66 |
2.67 |
Evidently, K′sp (ZrO2) and K′sp (UO2) were in the same order of 10−5 mol3 kg−3, and K′sp (ZrO2) was 2–3 times higher than K′sp (UO2). Based on these results, we can predict the formation of ZrO2 and UO2 precipitates in the FLiBe melt. (i) When the FLiBe melt only contained UF4, the reactive oxide resulted in UO2 precipitation. (ii) When the FLiBe melt contained equimolar ZrF4 and UF4, the oxide contamination should first yield the UO2 precipitate. (iii) In addition, when the FLiBe melt contained considerably more ZrF4 than UF4, the oxide contamination should first yield the ZrO2 precipitate. The precipitation of UO2 began only after the precipitation of ZrO2 had dropped the ZrF4 concentration to near 2–3 times as high as that of UF4. With further oxide addition, UO2 and ZrO2 would precipitate simultaneously. Therefore, excessive ZrF4 with more than 3 times higher than UF4 can effectively avoid the formation of UO2 precipitate in the FLiBe melt.
4.2 Oxide precipitation behavior of the MSR fuel salt system FLiBe–ZrF4–UF4
The oxide titration experiment in the FLiBe–ZrF4–UF4 melt with considerably more ZrF4 than UF4 was conducted to validate the above theoretical prediction and further clarify the influence of ZrF4 on UO2 generation, as shown in Fig. 7. At first, the ZrF4 in the system was consumed by forming ZrO2, thereby protecting uranium from being precipitated. Until the ZrF4 concentration dropped to 0.72 mol kg−1 (3 mol%), precipitation of UO2 began to form. At this point, the Zr(IV) concentration was about 2.5 times as high as that of U(IV). This result was highly consistent with the theoretical prediction, as stated in Sect. 4.1.
With the measured equilibrium concentrations of M(IV) (M = Zr or U) and O2−, a set of K′sp values for ZrO2 and UO2 could be respectively obtained after each oxide addition, as shown in Table 4. The K′sp results were basically consistent with that obtained in the FLiBe melt (Table 3) but varied with O2− addition. This was caused by the concentration change of M(IV) in the melt. The K′sp (ZrO2) showed no great difference when the added O2− was less than 1.71 mol kg−1, but decreased from 3.45 × 10⁻⁵ mol3 kg−3 to 1.19 × 10⁻⁵ mol3 kg−3 when the added O2− further increased from 1.71 mol kg−1 to 2.72 mol kg−1. At this time, the concentration of Zr(IV) was below 0.39 mol kg−1. Whereas the K′sp (UO2) had no remarkable change except some slight fluctuations. The variation of K′sp (ZrO2) probably arose from the deviation between the apparent concentration (c) and the activity (a) for Zr(IV) in the melt, as shown in eqn (7). The extent of this deviation (γ ≤ 1) was correlated to the concentration of ions. γ increased and decreased when the solute concentration decreased and increased, respectively. In this case, the initial Zr(IV) concentration was about four times greater than the initial U(IV) concentration, and the decrement in [Zr(IV)] varied in a wide range during oxide titration. Thus, when the residual Zr(IV) concentration continued decreasing to a low extent (the added O2− was more than 1.71 mol kg−1 and [Zr(IV)] was below 0.39 mol kg−1, which was 1/3 of the initial one), the γ1 for Zr(IV) would increase. Meanwhile, [O2−] changed slightly (only about 100 ppm change), indicating that γ2 for O2− remained virtually unchanged. According to eqn (6) and (9), the calculated K′sp (ZrO2) gradually decreased under low [Zr(IV)] when the added O2− was more than 1.71 mol kg−1 and [Zr(IV)] was below 0.39 mol kg−1. With regard to U(IV), whose concentration still stayed at a relatively low level, and the decrement occurred on a smaller scale compared with that of Zr(IV). Herein, the γU(IV) might change slightly, so did the γ2 for O2−. Thus, no remarkable variation in K′sp (UO2) was observed in the whole oxide titration procedure.
Table 4 Variation in K′sp for ZrO2 and UO2 in the FLiBe–ZrF4 (5 mol%)–UF4 (1.2 mol%) melt with oxide addition at 873 K
| Added [O2−] (mol kg−1) |
[O2−] (mol kg−1) |
[Zr(IV)] (mol kg−1) |
[U(IV)] (mol kg−1) |
K′sp (ZrO2) (mol3 kg−3) |
K′sp (UO2) (mol3 kg−3) |
| 0.15 |
5.59 × 10⁻³ (89 ppm) |
1.14 |
0.29 |
3.57 × 10⁻⁵ |
— (no UO2 formed) |
| 0.36 |
5.79 × 10⁻³ (93 ppm) |
1.06 |
0.28 |
3.56 × 10⁻⁵ |
— (no UO2 formed) |
| 0.54 |
6.01 × 10⁻³ (96 ppm) |
0.96 |
0.29 |
3.47 × 10⁻⁵ |
— (no UO2 formed) |
| 0.73 |
6.35 × 10⁻³ (102 ppm) |
0.85 |
0.29 |
3.43 × 10⁻⁵ |
— (no UO2 formed) |
| 0.84 |
6.53 × 10⁻³ (105 ppm) |
0.81 |
0.28 |
3.46 × 10⁻⁵ |
— (no UO2 formed) |
| 1.01 |
6.80 × 10⁻³ (109 ppm) |
0.72 |
0.28 |
3.33 × 10⁻⁵ |
1.31 × 10⁻⁵ |
| 1.14 |
7.03 × 10⁻³ (113 ppm) |
0.64 |
0.26 |
3.16 × 10⁻⁵ |
1.30 × 10⁻⁵ |
| 1.28 |
7.44 × 10⁻³ (119 ppm) |
0.55 |
0.25 |
3.07 × 10⁻⁵ |
1.40 × 10⁻⁵ |
| 1.39 |
8.10 × 10⁻³ (130 ppm) |
0.51 |
0.23 |
3.36 × 10⁻⁵ |
1.50 × 10⁻⁵ |
| 1.50 |
8.73 × 10⁻³ (140 ppm) |
0.46 |
0.22 |
3.53 × 10⁻⁵ |
1.66 × 10⁻⁵ |
| 1.71 |
9.40 × 10⁻³ (150 ppm) |
0.39 |
0.19 |
3.45 × 10⁻⁵ |
1.68 × 10⁻⁵ |
| 1.99 |
1.01 × 10⁻² (161 ppm) |
0.28 |
0.16 |
2.81 × 10⁻⁵ |
1.61 × 10⁻⁵ |
| 2.23 |
1.08 × 10⁻² (173 ppm) |
0.21 |
0.13 |
2.47 × 10⁻⁵ |
1.56 × 10⁻⁵ |
| 2.51 |
1.17 × 10⁻² (186 ppm) |
0.15 |
0.10 |
1.99 × 10⁻⁵ |
1.36 × 10⁻⁵ |
| 2.72 |
1.30 × 10⁻² (208 ppm) |
0.07 |
0.09 |
1.19 × 10⁻⁵ |
1.50 × 10⁻⁵ |
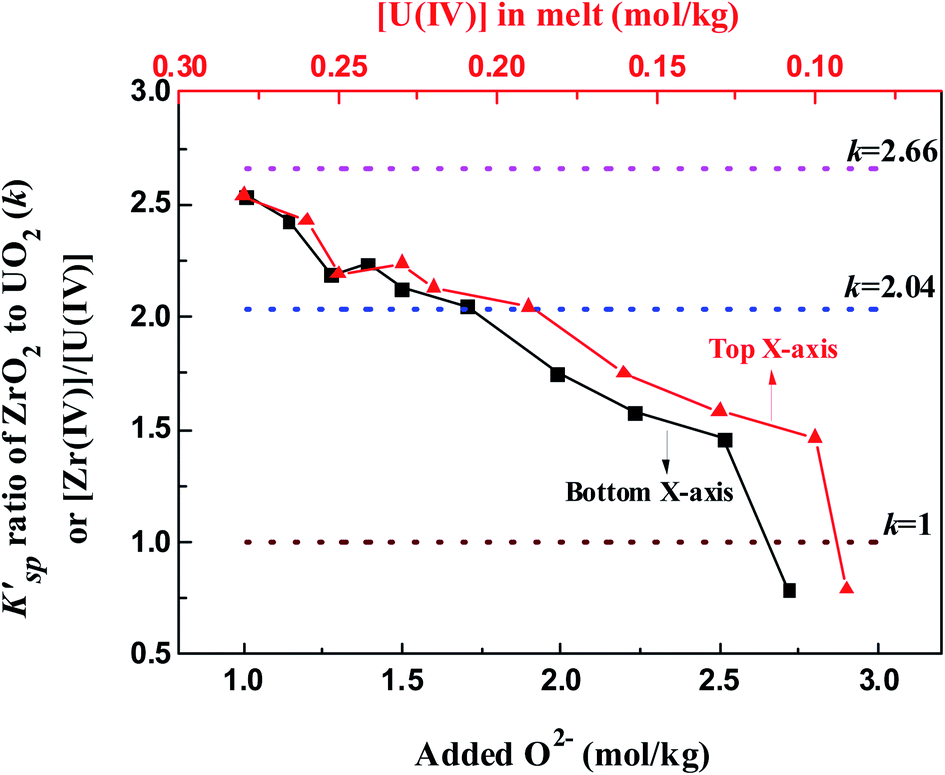
Fig. 9 illustrates the evolution of K′sp (ZrO2)/K′sp (UO2) ratio (k) in the oxide titration duration. The k value was also equal to the ratio of [Zr(IV)]/[U(IV)] because the O2− was simultaneously equilibrated by ZrO2 and UO2, as shown in eqn (13). Apparently, K′sp (ZrO2) was 2.54–1.46 times greater than K′sp (UO2) when the added O2− was in the range of 1.01–2.51 mol kg−1. However, the difference between them narrowed (decreasing k) with oxide addition, and K′sp (ZrO2) < K′sp (UO2) happened when the oxide addition reached 2.72 mol kg−1 (Fig. 9, bottom X-axis). Meanwhile, the decrease in [Zr(IV)]/[U(IV)] ratio with decreasing uranium concentration was also found (Fig. 9, top X-axis). These results reveal two important information: (i) proposing a solution for monitoring the generation of UO2 by measuring the k value in the melt with known [U(IV)]. For example, in this case the FLiBe–ZrF4 (5 mol%)–UF4 (1.2 mol%) melt, as long as k > 2.5, namely the Zr(IV) concentration remains more than 2.5 times that of U(IV), the oxide contamination will not cause UO2 precipitation; (ii) when [U(IV)] is different, the required [Zr(IV)] (actually, the ratio of [Zr(IV)]/[U(IV)], k) which can prevent UO2 precipitation also changes. The lower the [U(IV)] is, the lower the required k value will be. For example, when [U(IV)] is 0.29 mol kg−1, k ≥ 2.5 is needed to prevent UO2 precipitation. However, when [U(IV)] is 0.09 mol kg−1, it only requires k ≥ 0.8. That means the required [Zr(IV)] decreased with decreasing [U(IV)]. These results provide reference data for fuel salt design of MSR with different uranium content.
| |
 | (13) |
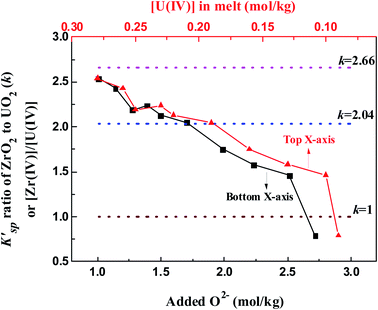 |
| | Fig. 9 K′sp ratio of ZrO2 to UO2 (k) during the oxide titration of FLiBe–ZrF4 (5 mol%)–UF4 (1.2 mol%) melt at 873 K. k = 2.66 obtained by oxide titration method; k = 2.04 obtained by dissolution method; k = 1 means K′sp (ZrO2) = K′sp (UO2). | |
5. Conclusion
The formation of the UO2 precipitate would lead to a superheated area in MSR and cause a critical risk. Developing appropriate additives for oxide ion capture is an effective way to protect uranium from forming the UO2 precipitate in the fuel of MSR. This study focused on the dissolution–precipitation behavior of ZrO2 in the FLiBe melt, and the inhibition of UO2 generation by the ZrF4 additive was also clarified.
First, the results of the dissolution experiment showed that the saturated solubility of ZrO2 in the FLiBe melt at 873 K was 3.84 mol kg−1 with the equilibrium time of 6 h. Then, the interactions between Zr(IV) and oxide ions was studied by adding O2− into the FLiBe–ZrF4 melt. The Zr(IV) concentration in the melt linearly decreased with O2− addition because of ZrO2 precipitation, which was confirmed by the stoichiometric ratio (chemical analysis) and XRD. Moreover, the K′sp of ZrO2 were determined to be 3.40 × 10⁻⁵ and 3.54 × 10⁻⁵ mol3 kg−3 in these two processes, which showed good conformity and were highly consistent with that reported by ORNL.
The obtained K′sp of ZrO2 was in the same order of 10−5 mol3 kg−3 and 2–3 times higher than that of UO2. Based on this result, the formation of ZrO2 and UO2 precipitates in the FLiBe melt can be predicted. If the FLiBe melt contained considerably more ZrF4 than UF4, the oxide contamination first yielded the ZrO2 precipitate, and the precipitation of UO2 began only when the precipitation of ZrO2 had dropped the ZrF4 concentration to near 2–3 times as high as that of UF4. The oxide titration experiment of the FLiBe–ZrF4 (5 mol%)–UF4 (1.2 mol%) melt was further carried out, showing that only ZrO2 was formed when the O2− addition was less than 1 mol kg−1. When the added O2− reached 1 mol kg−1 and the [Zr(IV)] reduced to 0.72 mol kg−1 (3 mol%), UO2 began to form and the [Zr(IV)]/[U(IV)] ratio was 2.5 at this point. Afterwards, ZrO2 and UO2 coprecipitated with further O2− addition. Experimental results agreed well with the theoretical prediction from the obtained K′sp (ZrO2) and K′sp (UO2).
The results of present work clarified the inhibiting effect of ZrF4 on the UO2 generation in the FLiBe melt and further affirmed the approach of ZrF4 additive for the control of nuclear fuel precipitation (UO2) in MSR. When oxide contamination occurred, the considerable amount of ZrF4 first formed ZrO2, which prevented the combination between UF4 and O2−. Thus, the precipitation of UO2 could be effectively avoided. The critical ratio of [Zr(IV)]/[U(IV)] to prevent the precipitation of UO2 was more than 2.5 in the FLiBe–ZrF4 (5 mol%)–UF4 (1.2 mol%) melt, and it decreased with decreasing initial uranium concentration. The precipitation mechanism of ZrO2 and UO2 in the FLiBe molten salt can provide the following inspirations: (i) a solution for monitoring the generation of UO2 precipitation in the MSR fuel salt can be proposed by measuring the [Zr(IV)]; (ii) the required [Zr(IV)]/[U(IV)] ratio which can prevent UO2 precipitation changes with different uranium content. All of these will be helpful for the safe operation and fuel salt design of MSR.
Conflicts of interest
There are no conflicts to declare.
Acknowledgements
This work was supported by the National Natural Science Foundation of China (Grant No. 22006150), Shanghai Sailing Program (Grant No. 19YF1458200), “Strategic Priority Research Program” and the “Frontier Science Key Program” of the Chinese Academy of Sciences (Grant No. XDA02030000 and QYZDYSSW-JSC016).
References
- M. Rosenthal, P. Kasten and R. Briggs, Molten-salt reactorsd history, status, and potential, Nucl. Appl. Technol., 1970, 8, 107–117 CrossRef CAS.
- W. R. Grimes, F. F. Blankenship, G. W. Keilholtz, H. F. Poppendiek and M. T. Robinson, Chemical aspects of molten fluoride reactors, in Progress in Nuclear Energy, Series IV, Pergamon Press, London, 1960, vol. 2 Search PubMed.
- A. Nuttin, D. Heuer, A. Billebaud, R. Brissot, C. Le Brun, E. Liatard, J.-M. Loiseaux, L. Mathieu, O. Meplan and E. Merle-Lucotte, Potential of thorium molten salt reactors: detailed calculations and concept evolution with a view to large scale energy production, Prog. Nucl. Energy, 2005, 46, 77–99 CrossRef CAS.
- F. Lantelme and H. Groult, Molten Salts Chemistry: from Lab to Applications, Elsevier, 2013 Search PubMed.
- S. Delpech, C. Cabet, C. Slim and G. S. Picard, Molten fluorides for nuclear applications, Mater. Today, 2010, 13, 34–41 CrossRef CAS.
- P. A. Haas and P. Cooper, Solubility of uranium oxides in fluoride salts at 1200 °C, J. Chem. Eng. Data, 1993, 38, 26–30 CrossRef CAS.
- H. Peng, M. Shen, Y. Zuo, X. X. Tang, R. Tang and L. D. Xie, Electrochemical technique for detecting the formation of uranium-containing precipitates in molten fluorides, Electrochim. Acta, 2016, 222, 1528–1537 CrossRef CAS.
- H. Peng, W. Huang, L. D. Xie and Q. N. Li, Solubility and precipitation investigations of UO2 in LiF–BeF2 molten salt, J. Nucl. Mater., 2020, 531, 152004 CrossRef CAS.
- ORNL-3812, Molten-salt Reactor Program: Semiannual Progress Report for Period Ending, Oak Ridge National Laboratory, 1965 Search PubMed.
- ORNL-3936, Molten-salt Reactor Program: Semiannual Progress Report for Period Ending, Oak Ridge National Laboratory, 1966 Search PubMed.
- ORNL-4812, Molten-salt Reactor Program: the Development Status of Molten-Salt Breeder Reactors, Oak Ridge National Laboratory, 1972 Search PubMed.
- ORNL-3708, Molten-salt Reactor Program: Semiannual Progress Report for Period Ending, Oak Ridge National Laboratory, 1964 Search PubMed.
- ORNL-4616, Reactor Chemistry Division: Preparation and Handling of Salt Mixtures for the Molten Salt Reactor experiment, Oak Ridge National Laboratory, 1971 Search PubMed.
- A. L. Mathews and C. F. Baes Jr., Oxide chemistry and thermodynamics of molten lithium fluoride-beryllium fluoride solutions, Inorg. Chem., 1968, 7, 373–382 CrossRef CAS.
- ORNL-TM-0728, report, MSRE Design and Operations Report: Part I. Description of Reactor Design, Oak Ridge National Laboratory, 1965 Search PubMed.
- M. Shen, H. Peng, M. Ge, C. Y. Wang, Y. Zuo and L. D. Xie, Chemical interactions between zirconium and free oxide in molten fluorides, RSC Adv., 2015, 5, 40708–40713 RSC.
- H. Peng, M. Shen, Y. Zuo, H. Y. Fu and L. D. Xie, Chemical and electrochemical studies on the solubility of UO2 in molten FLINAK with ZrF4 additive, J. Nucl. Mater., 2018, 510, 256–264 CrossRef CAS.
- M. Gibilaro, L. Massot, P. Chamelot, L. Cassayre and P. Taxil, Investigation of Zr(IV) in LiF–CaF2: stability with oxide ions and electroreduction pathway on inert and reactive electrodes, Electrochim. Acta, 2013, 95, 185–191 CrossRef CAS.
- M. Korenko, M. Straka, J. Uhlíř, L. Szatmáry, M. Ambrová and M. Šimurda, Phase analysis of the solidified KF–(LiF–NaF–UF4)–ZrF4 molten electrolytes for the electrowinning of uranium, J. Radioanal. Nucl. Chem., 2014, 302, 549–554 CrossRef CAS.
- M. Shen, H. Peng, M. Ge, Y. Zuo and L. D. Xie, Use of square wave voltammeter for online monitoring of O2− concentration in molten fluorides at 600 °C, J. Electroanal. Chem., 2015, 748, 34–39 CrossRef CAS.
- Y. L. Song, M. Shen, H. Peng, C. Y. Wang, S. F. Zhao, Y. Zuo and L. D. Xie, Solubility of Cr2O3 in Molten Fluorides with Different ZrF4 Contents and Fluoroacidities, J. Electrochem. Soc., 2020, 167, 023501 CrossRef CAS.
- ORNL-3419, Molten-salt Reactor Program: Semiannual Progress Report for Period Ending, Oak Ridge National Laboratory, 1963 Search PubMed.
- ORNL-1771, Aircraft Nuclear Propulsion Project: Quarterly Progress Report for Period Ending, Oak Ridge National Laboratory, 1954 Search PubMed.
- H. Peng, M. Shen, C. Y. Wang, T. Su, Y. Zuo and L. D. Xie, Electrochemical investigation of the stable chromium species in molten FLINAK, RSC Adv., 2015, 5, 76689–76695 RSC.
- H. Mediaas, J. Vinstad and T. Østvold, Solubility of MgO in MgCl2–NaCl–NaF Melts, Minerals, Metals and Materials Society, Warrendale, PA (United States), 1996 Search PubMed.
- G. Kipouros, H. Mediaas, J. Vindstad, T. Oestvold and O. Tkatcheva, Oxide Solubilities and Phase Relations in the System Mg–Nd–O–Cl, Minerals, Metals and Materials Society, Warrendale, PA (United States), 1996 Search PubMed.
|
| This journal is © The Royal Society of Chemistry 2021 |
Click here to see how this site uses Cookies. View our privacy policy here. 
 Open Access Article
 This Open Access Article is licensed under a Creative Commons Attribution-Non Commercial 3.0 Unported Licence
 *a and
Yu Gong
*a and
Yu Gong