 Open Access Article
Fabrication of a novel magnetic metal–organic framework functionalized with 2-aminothiophenol for preconcentration of trace silver amounts in water and wastewater†
Seyyed Hossein Mousavia,
Mahboobeh Manoochehri *a and
Faramarz Afshar Taromib
aDepartment of Chemistry, Central Tehran Branch, Islamic Azad University, Tehran, 1467686831, Iran. E-mail: dr.manoochehri@yahoo.com; Fax: +98 2188385798; Tel: +98 9127242698
bDepartment of Polymer Engineering and Color Technology, Amirkabir University of Technology, 424 Hafez Avenue, P. O. Box: 15875-4413, Tehran, Iran
First published on 14th April 2021
Abstract
Herein, a novel magnetic metal–organic framework functionalized (MMOF) with 2-aminothiophenol (2-ATP) was fabricated and employed for separation/preconcentration of trace silver amounts. At first magnetite nanoparticles (Fe3O4 NPs) were synthesized and then coated with SiO2. Thereafter, the Fe3O4@SiO2 nanoparticles were modified with 2-ATP. Finally, the functionalized MMOF was prepared by the fabrication of MIL-101(Cr) in the presence of Fe3O4@SiO2@2-ATP NPs. MIL-101(Cr)/Fe3O4@SiO2@2-ATP nanocomposite was characterized with FT-IR, SEM, elemental analysis, XRD and VSM and then utilized in the separation/determination of silver ions in various real samples. The effects of diverse experimental variables such as pH, uptake time, adsorbent amount, desorption time, eluent concentration and volume were studied comprehensively employing experimental design methodology. After optimization, LOD and linearity were 0.05 ng mL−1 and 0.2–200 ng mL−1, respectively. Repeatability of the new method was determined based on RSD value for 5, 50, 150 ng mL−1 (n = 5) concentrations which was 9.3%, 6.8% and 4.5%, respectively. Ultimately, the outlined method was utilized in the separation/determination of silver ions in various water and wastewater samples satisfactorily.
1. Introduction
Silver is a commercially important metal which is utilized in the fabrication of high strength/corrosion resistant alloys as well as in jewelry. Moreover, silver alloys and compounds are widely utilized in pharmaceutical/dental preparations and in implanted prostheses owing to their well-known antibacterial nature.1,2 Besides, silver is extensively applied in imaging and photographic applications.1,2 The wide utilization of silver compounds and silver containing procedures in industry has led to the increase of silver in environmental samples.2,3 Silver can enter into the environmental samples via industrial discharges owing to the fact that it often occurs as an impurity in Cu, Sb, As and Zn ores. Besides, exposure to low levels of silver compounds is common because of the use of its soluble compounds for disinfection of drinking water.2,4,5 Accordingly, the accurate determination of silver ions in wastewater and environmental water samples is important and challenging in analytical6 and developing new separation/extraction method is vital.7,8 Flame atomic absorption spectrometry (FAAS),2,3,7,9,10 flame furnace atomic absorption spectrometry11 and inductively coupled plasma-atomic emission spectrometry12,13 are popular techniques for quantification of silver. These analytical techniques are not suitable for quantification of silver in environmental samples due to the low sensitivity as well as the matrix complexity. Accordingly, performing a separation/preconcentration step before the instrumental analysis is mandatory.10Various extraction/preconcentration methods such as solid-phase extraction (SPE),14 liquid–liquid extraction,15 solvent-assisted dispersive-SPE,16 hollow fiber liquid phase microextraction,17 single drop microextraction,18 and cloud point extraction19 have been reported for silver determination. Among these sample preparation methods, SPE is extensively employed approach for the extraction of metals ions. The SPE benefits from the advantages such as low consumption of solvent, high sensitivity, simplicity and rapidity.2 Different types of adsorbent materials have been reported for the extraction of silver such as chelating resin,2 modified silica gel,4 cellulose nitrate membrane,6 modified magnetic nanoparticles9,13 modified magnetic graphene oxide,10 carbon nanotubes,20 Amberlite XAD-16 resin21 and modified magnetic halloysite nanotubes.22
MOFs, a class of hybrid porous crystalline materials, are fabricated by the metal ion centers and organic linkers. The excellent structural diversity of MOFs as well as their inimitable features, led to their wide application in the analytical chemistry.23,24 MOFs have effectively been applied as adsorbents in diverse extraction approaches.25–27 Various types of MOFs have been reported for the extraction of heavy metal ions such MOF-199,28,29 MIL-101(Fe),30,31 MIL-96(Al)32 and aluminium-fumarate MOF.33 Among divers type of MOFs, MIL-101(Cr) is one of the widely utilized adsorbent owing to its high chemical stability in the wide range of pH, large specific high surface area and high metal content.34
Herein, a novel MMOF functionalized with 2-aminothiophenol (2-ATP) was fabricated and employed for the separation/preconcentration of trace silver amounts. At first magnetite nanoparticles (Fe3O4 NPs) was synthesized and then coated with SiO2. Thereafter, the Fe3O4@SiO2 nanoparticles were modified with 2-ATP. Finally, the functionalized MMOF was fabricated by the fabrication of MIL-101(Cr) in the presence of Fe3O4@SiO2@2-ATP NPs. MIL-101(Cr)/Fe3O4@SiO2@2-ATP nanocomposite was characterized with various methods and then utilized to separation/quantification of silver ions in various real matrixes. Modification of MIL-101 with Fe3O4@2-aminothiophenol NPs not only improves the selectivity of this sorbent toward silver ions but also facilitates the separation and extraction process.
2. Experimental
2.1 Reagents and solutions
All reagents (Cr(NO3)2·9H2O, (NH4)2Fe(SO4)2·6H2O, FeCl3, hydrochloric acid, nitric acid, sodium hydroxide, (3-chloropropyl)-triethoxysilane (3-CPTS), 1,4-benzene dicarboxylic acid (H2BDC), methanol, tetraethyl orthosilicate (TEOS), N,N-dimethylformamide (DMF), ammonium hydroxide (28% w/v), toluene, triethylamine (TEA), 2-aminothiophenol (2-ATP), and ethanol) were of analytical grade and purchased from Merck (Darmstadt, Germany) or Fluka (Seelze, Germany). Stock solution (1000 mg L−1) of Ag(I) was supplied from Merck. All working solutions were prepared in deionized water. Stock solutions of other species were prepared in deionized water containing 2% (v/v) nitric acid.River water and well water samples (Tehran, Iran) were collected in clean polyethylene bottles. Radiological wastewater sample was collected in clean polyethylene bottles from a hospital (Karaj, Iran). Photographic and electroplating wastewater samples were collected in clean polyethylene bottles (local workshops, Karaj, Iran). All the samples were filtered via cellulose membrane (Millipore, 0.45 μm) and then were stored in cleaned polyethylene bottles.
2.2 Instrumentation
An AA-680 flame atomic absorption spectrometer (FAAS) from Shimadzu (Kyoto, Japan) consists of an air-acetylene flame; a silver hollow cathode lamp (radiation source) with the wavelength of 328.1 nm was used for silver quantification. The instrument was set according to the manufacturer's guides. The morphology of nanocomposite was explored via a MIRA3 TESCAN field emission scanning electron microscope (FESEM, Czech Republic). FT-IR spectrum of the sorbent was recorded using KBr pellet method and by employing a Bomem MB-Series spectrophotometer (USA). Magnetic features of the fabricated materials were studied using a vibrating sample magnetometer (VSM) model AGFM/VSM117 3886 (Kashan, Iran).The pH was measured utilizing a Metrohm pH-meter model 827 consist of a glass calomel electrode. X-ray diffraction (XRD) pattern of MIL-101/Fe3O4@SiO2@2-ATP nanocomposite was recorded using a Philips-PW 12C diffractometer (Amsterdam, The Netherlands) consist of a copper Kα radiation source. CHNS content of MIL-101/Fe3O4@SiO2@2-ATP nanocomposite was explored using a Thermo Finnigan Flash EA112 elemental analyzer (Okehampton, UK).2.3 Sorbent fabrication
Fabrication of Fe3O4@SiO2 NPs was conducted according to our previously reported works.8,34 To functionalize the Fe3O4@SiO2 NPs, 2.0 g fabricated Fe3O4@SiO2 NPs were added to 150 mL dried toluene, and stirred for 30 min. Then, 3.0 mL 3-CPTS was added to the mixture and it was refluxed for 15 h at 130 °C. Thereafter, the product was magnetically separated and then washed with ethanol and acetone. Finally, the product was dried at room temperature. In the next step, 1.0 g Fe3O4@SiO2@CPTS was suspended in 100 mL of triethylamine and methanol mixture (1![[thin space (1/6-em)]](https://www.rsc.org/images/entities/char_2009.gif) :
:![[thin space (1/6-em)]](https://www.rsc.org/images/entities/char_2009.gif) 1 v/v), then 1.5 g 2-ATP was added and the mixture was refluxed for 20 h. Ultimately, Fe3O4@SiO2@2-ATP NPs were washed with ethanol, and dried at ambient temperature. A scheme for the synthesis process is exhibited in Fig. 1a.
1 v/v), then 1.5 g 2-ATP was added and the mixture was refluxed for 20 h. Ultimately, Fe3O4@SiO2@2-ATP NPs were washed with ethanol, and dried at ambient temperature. A scheme for the synthesis process is exhibited in Fig. 1a.
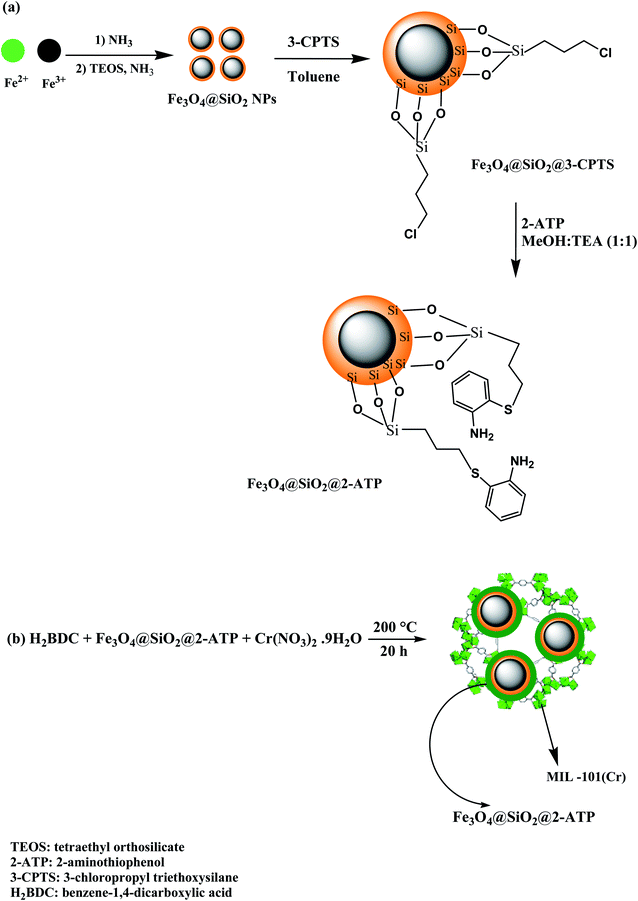 | ||
| Fig. 1 A scheme for the synthesis of (a) Fe3O4@SiO2@2-ATP nanoparticles, and (b) MIL-101(Cr)/Fe3O4@SiO2@2-ATP nanocomposite. | ||
To synthesize MIL-101/Fe3O4@SiO2@2-ATP nanocomposite, 2.0 mmol H2BDC was added to 20 mL of DI water (solution 1). After that, 0.5 g Fe3O4@SiO2@2-ATP NPs was added to 30 mL aquatic solution containing 2.0 mmol Cr(NO3)3·9H2O (solution 2). Afterward, two mixtures (1 and 2) were transferred into an autoclave and it was heated at 200 °C for 20 h.8,34 Finally, MIL-101(Cr)/Fe3O4@SiO2@2-ATP NPs was isolated magnetically and washed with deionized water (4 × 25 mL) and ethanol (5 × 25 mL), respectively, and then dried at ambient temperature. MIL-101(Cr)/Fe3O4@SiO2@2-ATPwas characterized by FT-IR spectroscopy, VSM, CHNS, FESEM, and XRD techniques. A scheme of the fabrication process is illustrated in Fig. 1b.
2.4 Separation/preconcentration procedure
At first, the pH of sample was fixed at 6.2 by using and 0.1 mol L−1 HCl and NH4OH solutions. Then, MIL-101(Cr)/Fe3O4@SiO2@2-ATP adsorbent (21 mg) was added to the sample and the suspension was stirred for 13 min. After that, the solution was magnetically separated from the adsorbent and the uptake percentage determined after FAAS quantification. To desorb Ag(I) ions, the adsorbent was suspended in 1.7 mL 0.56 mol L−1 nitric acid solution and the mixture was stirred for 16 min. Afterward, the adsorbent was isolated from the extraction medium and the supernatant was introduced to FAAS into determine its silver content.3. Results and discussion
3.1 Characterization studies
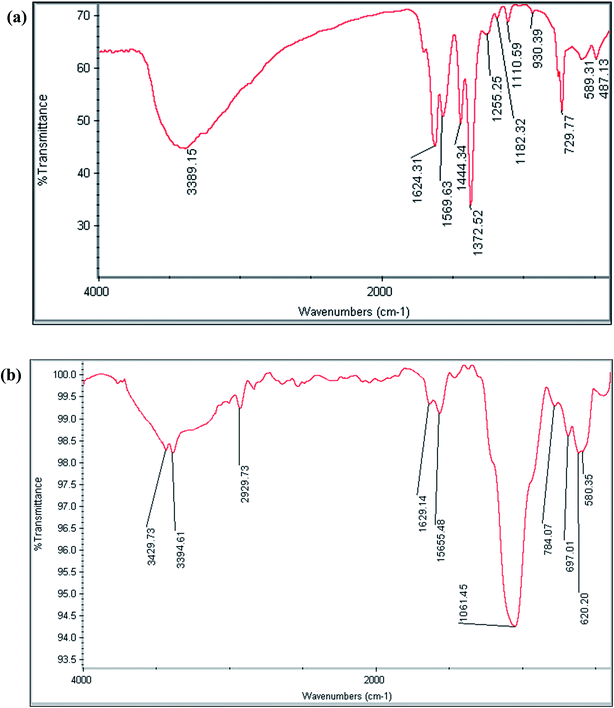
The FT-IR spectra of MIL-101(Cr) and MIL-101(Cr)/Fe3O4@SiO2@2-ATP NPs composite were recorded to specify the functional moieties of these materials. The characteristics peaks of MIL-101(Cr) are observable at 1372 and 1569 cm−1 (O–C–O, dicarboxylate groups), 1624 cm−1 (C![[double bond, length as m-dash]](https://www.rsc.org/images/entities/char_e001.gif) O), and 3389 cm−1 (O–H of adsorbed water) (Fig. 2a). In the spectrum of the MIL-101(Cr)/Fe3O4@SiO2@2-ATP composite, the characteristics bands at 588 cm−1 (Fe–O), 1046 cm−1 (Si–O–Si), 2929 cm−1 (C–H aliphatic), 1500–1650 cm−1 (C
O), and 3389 cm−1 (O–H of adsorbed water) (Fig. 2a). In the spectrum of the MIL-101(Cr)/Fe3O4@SiO2@2-ATP composite, the characteristics bands at 588 cm−1 (Fe–O), 1046 cm−1 (Si–O–Si), 2929 cm−1 (C–H aliphatic), 1500–1650 cm−1 (C![[double bond, length as m-dash]](https://www.rsc.org/images/entities/char_e001.gif) N, C
N, C![[double bond, length as m-dash]](https://www.rsc.org/images/entities/char_e001.gif) C), 3394 cm−1 (O–H), and 3429 cm−1 (N–H) proved the modification of MIL-101(Cr) with 2-ATP (Fig. 2b).
C), 3394 cm−1 (O–H), and 3429 cm−1 (N–H) proved the modification of MIL-101(Cr) with 2-ATP (Fig. 2b).
Elemental analysis was accomplished to study the CHNS composition of the MIL-101(Cr)/Fe3O4@SiO2@2-ATP composite. The results showed 29.5% C, 2.1% N, 2.7% S and 1.5% H for MIL-101(Cr)/Fe3O4@SiO2@2-ATP NPs composition. The advent of nitrogen and sulfur elements in the composition of MIL-101(Cr)/Fe3O4@SiO2@2-ATP approved the functionalization of the nanocomposite with 2-APT because only this reagent contain N and S elements among the utilized materials.
The surface and dimension of MIL-101(Cr)/Fe3O4@SiO2@2-ATP was explored by FESEM method (Fig. 3a). The SEM micrograph of MIL-101(Cr)/Fe3O4@SiO2@2-ATP nanocomposite exhibited a rough surface which can be attributed to the presence of Fe3O4@SiO2@2-ATP NPs. Fe3O4@SiO2@2-ATP NPs are spherical in shape as it is observable in the SEM micrograph the average size of these particles is 25 nm that is in good agreement with the previous reported MMOFs.28,34
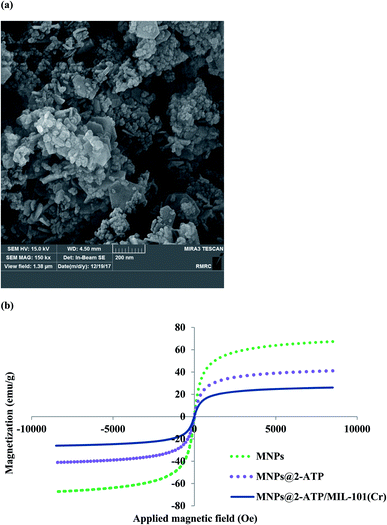 | ||
| Fig. 3 (a) FESEM of MIL-101(Cr)/Fe3O4@SiO2@2-ATP nanocomposite and (b) VSM curves Fe3O4 NPs, Fe3O4@SiO2@2-ATP NPs and MIL-101(Cr)/Fe3O4@SiO2@2-ATP composite. | ||
To explore magnetic characteristics of MNPs, Fe3O4@SiO2@2-ATP and MIL-101(Cr)/Fe3O4@SiO2@2-ATP nanocomposites, VSM plots of these materials were recorded as are show in Fig. 3b. Saturation magnetization value for MNPs, Fe3O4@SiO2@2-ATP and MIL-101(Cr)/Fe3O4@SiO2@2-ATP composite was 67, 41 and 26 emu g−1, respectively. The obtained plots and values exhibit that these materials are superparamagnetic and can be magnetically isolated by a common external magnetic field.23
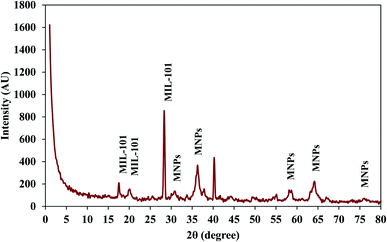
The structure of MIL-101(Cr)/Fe3O4@SiO2@2-ATP composite was characterized by XRD method and the obtained pattern is exhibited in Fig. 4. Five characteristic peaks at 2θ = 30.8°, 36°, 58°, 64° and 75.1° are attributed to of Fe3O4@SiO2@2-ATP NPs and approve the presence of these particles in the composite structure. Besides, four characteristic peaks which are corresponded to MIL-101(Cr) are observable at 2θ = 2°, 17.6°, 20° and 28.3° prove the presence of MOF in the composite.34 These results confirm that the fabricated material is a hybrid of MIL-101(Cr) and Fe3O4@SiO2@2-ATP NPs. Moreover, the average crystallite size of Fe3O4@SiO2@2-ATP NPs in the MIL-101(Cr)/Fe3O4@SiO2@2-ATP composite was determined from the XRD pattern by using Scherrer equation and this value was about 20 nm, which is in good agreement with the value of FESEM method.
3.2 Optimization of the affecting factors
| Level | ||||
|---|---|---|---|---|
| Lower | Central | Upper | ||
| Sorption step | A: pH of sample | 3.0 | 5.0 | 7.0 |
| B: uptake time (min) | 8.0 | 12.0 | 16.0 | |
| C: sorbent dosage (mg) | 10.0 | 17.5 | 25.0 | |
| Elution step | A: elution time (min) | 10.0 | 15.0 | 20.0 |
| B: HNO3 concentration (mol L−1) | 0.25 | 0.5 | 0.75 | |
| C: HNO3 volume (mL) | 1.0 | 1.5 | 2.0 | |
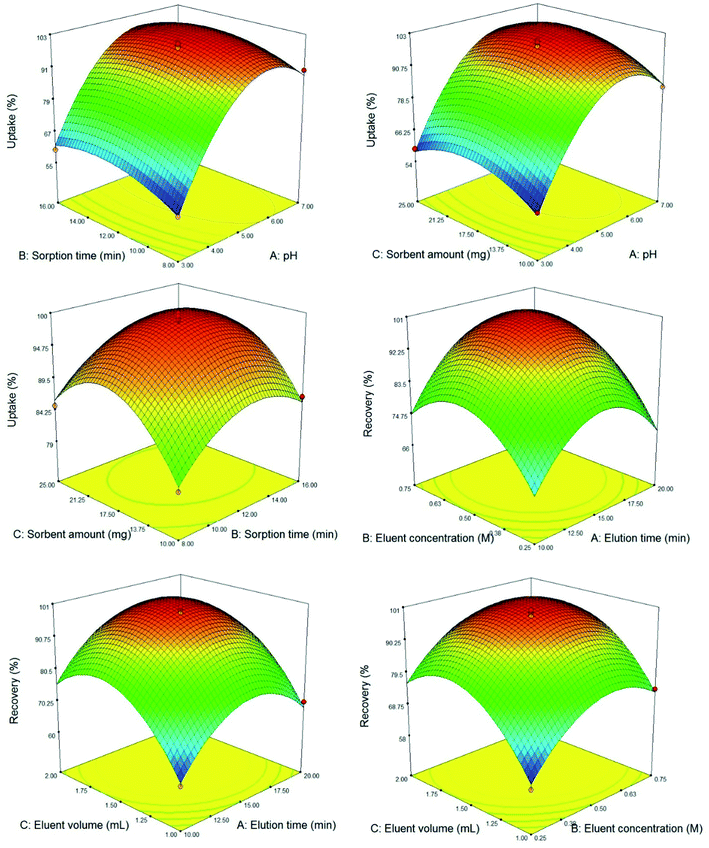
After selection of desorbing solution, the effect of elution time, HNO3 concentration, and eluent volume were investigated and opted via BBD. Accordingly, 17 tests were designed and performed (Table 1). The ANOVA results (Table S2, ESI†) exhibited that the model is significant due to the p-value lower than (0.0001). The lack of fit p-value is 0.0528 that implies there is no pure error. The eluent volume exhibited the most significant positive effect on the recovery and the two other parameters showed a significant positive effect too. The R-squared, and adjusted R-squared were 0.9877 and 0.9719, respectively that are suitable value for a constructed model. Besides, the predicted R-squared of 0.8342 is in good agreement with the adjusted R-squared. Adequate precision as the S/N measurement tool was 21.485. A ratio greater than 4 is desirable and exhibits the adequate signal. As a result the suggested model can be employed to navigate the design space. To explore the concurrent effect of the variables; response surface plots (Fig. 5) were utilized. As depicted in 3D plots, all the studied variables are optimized properly with a curvature surface. Finally, the best silver ions recovery was observed by employing 1.7 mL 0.56 mol L−1 nitric acid solution as the eluent and an elution time of 16 min.
3.3 Effect of possible interferences and durability study
To determine the possible interfering species, effect of various species on the extraction recovery of silver ions was studied. The tolerance limit of the various species is tabulated in Table 2. The species concentration causing ±5% deviation in the recovery of silver ions was assumed as the tolerance limit. As summarized in Table 2, the presence of other constituent has no significant effect on the extraction recovery of Ag(I) ions. It can be concluded that the MIL-101(Cr)/Fe3O4@SiO2@2-ATP has good selectivity towards silver ions under the opted extraction conditions.| Species | Tolerance ratio | Recovery (%) ± SDa |
|---|---|---|
| a Standard deviation. Conditions: pH, 6.2; uptake time, 13 min; adsorbent dosage, 21 mg; elution time, 16 min; 1.7 mL 0.56 mol L−1 nitric acid as the eluent. | ||
| Na+ | 15![[thin space (1/6-em)]](https://www.rsc.org/images/entities/char_2009.gif) 000 000 |
101.2 ± 4.3 |
| K+ | 15![[thin space (1/6-em)]](https://www.rsc.org/images/entities/char_2009.gif) 000 000 |
99.4 ± 5.1 |
| Ca2+ | 5000 | 98.0 ± 3.7 |
| Mg2+ | 5000 | 96.9 ± 3.5 |
| Cr3+ | 1500 | 95.2 ± 5.0 |
| Fe3+ | 1500 | 98.5 ± 6.2 |
| Mn2+ | 1500 | 97.8 ± 4.5 |
| Al3+ | 1500 | 99.2 ± 6.0 |
| Au3+ | 1000 | 95.3 ± 3.9 |
| Zn2+ | 1000 | 96.4 ± 4.6 |
| Ni2+ | 1000 | 95.7 ± 5.6 |
| Cd2+ | 1000 | 97.7 ± 5.1 |
| Pb2+ | 1000 | 98.5 ± 4.8 |
| Hg2+ | 750 | 95.0 ± 4.0 |
| Pd2+ | 400 | 95.6 ± 3.6 |
The durability of MIL-101(Cr)/Fe3O4@SiO2@2-ATP sorbent was studied by investigating the decrease in the Ag(I) ions recovery by performing several uptake–elution cycles under the opted condition. The results revealed that the MIL-101(Cr)/Fe3O4@SiO2@2-ATP can be employed up to 6 times without notable decrease in the silver ions recovery.
3.4 Adsorption capacity and breakthrough volume
The adsorption capacity of MIL-101(Cr)/Fe3O4@SiO2@2-ATP composite toward silver ions was explored by employing a standard solution containing appropriate concentration of Ag(I) ions. The maximum adsorption capacity (MAC) was obtained as the adsorbed amount of silver ions (mg) per MIL-101(Cr)/Fe3O4@SiO2@2-ATP weight (g). Accordingly, the MAC for adsorption of silver ions on MIL-101(Cr)/Fe3O4@SiO2@2-ATP adsorbent is 103 mg g−1.Effect of breakthrough was explored by varying the solution volume in the range of 50–600 which contains 0.01 mg silver ions. Thereafter, the extraction process was accomplished to determine the breakthrough. The results exhibited that up to 500 mL the recovery of silver ions is quantitative and the dilution effect has no significant. Thereby, an enrichment factor of 294 fold is attained regarding the breakthrough (600 mL) and eluent (1.7 mL) volumes.
3.5 Analytical characteristics and comparison
The analytical characteristics of new method including linear range, LOD and precision were evaluated under the opted condition. The instrument response was linear in the range of 0.2–200 ng mL−1 with the r2 value of 0.9963. LOD was obtained by 3Sb/m equation that was 0.05 ng mL−1. In this equation, Sb is the standard deviation of 6 replicate signal of blank and m represents the slope of calibration plot. Precision of the new method was explored as RSD% value at three concentration of 5, 50, 150 ng mL−1 (n = 5) and which was 9.3%, 6.8% and 4.5%, respectively.In order to explore the accuracy of the current method, ore polymetallic gold Zidarovo-PMZrZ (206 BG 326) was analyzed by the recommended extraction procedure. The experimental value (16.9 ± 0.3 mg kg−1) is in good accordance with the certified value of silver (17.2 mg kg−1). To confirm the accuracy of new method, t-test was accomplished. The texperimental for the three replicates is 1.7 that is lower than tcritical (t0.05, 2 = 4.30).The results affirm that there is no significant difference between the experimental value and the real value. Accordingly, the new method can be employed as a reliable procedure for the extraction of silver ions form complex matrices.
The analytical characteristics of the new method including LOD, linearity, precision, MAC and enrichment factor was compared to the former reported methods for separation/determination of silver (Table 3). As summarized in Table 3, LOD and precision of the new method are better than or comparable those of the reported methods. A high MAC of 103 mg g−1 and an excellent enrichment factor as high as 294 was achieved for this method which is higher than the previously methods. Herein, FAAS was employed as the detection system which is a well-known, relatively inexpensive, widely used, and simple to operate instrument.
| Analytical instrument | Adsorbent | LOD (ng mL−1) | Linear range (ng mL−1) | EFa | MACb | RSD (%) | Ref. |
|---|---|---|---|---|---|---|---|
| a Enrichment factor.b Maximum adsorption capacity in mg g−1.c Inductively coupled plasma optical emission spectrometry.d Flow injection.e Polypyrrole–polythiophene. | |||||||
| ICP-OESc | Polythiophene-coated Fe3O4 NPs | 0.2–2.0 | 0.75–100 | 114 | — | 4.2 | 13 |
| ICP-OES | Modified magnetic NPs | 0.12 | — | 194 | 10 | 5.31 | 36 |
| FId-FAAS | Silica gel based chelating sorbent | 1.3 | — | 15 | 24 | 3.0 | 37 |
| FAAS | mGO@SiO2@PPy–PThe nanocomposite | 0.1 | 0.5–500 | 125 | 49 | 2.7 | 10 |
| FAAS | Fe3O4 NPs@murexide | 0.15 | 0.5–400 | 225 | 48 | 5.0 | 9 |
| FAAS | MIL-101(Cr)/Fe3O4@SiO2@2-ATP nanocomposite | 0.05 | 0.2–200 | 294 | 103 | <9.4 | Current research |
3.6 Applicability to real matrixes
To explore the analytical applicability of the optimized procedure to real matrixes various real samples such as river water, well water and electroplating, radiological and photographical wastewaters were analyzed. The results of this assay (recoveries and RSD values) are summarized in Table 4. The RSD and recovery values were located in the range of 89–103% and 5.0–9.7%, respectively. These results affirm that the new method is the reliable and accurate for the determination of silver ions in real matrixes and MIL-101(Cr)/Fe3O4@SiO2@2-ATP NPs sorbent has the high performance for preconcentration/separation of Ag(I).| Sample | Real value | Added value | Found value | Recovery (%) |
|---|---|---|---|---|
| a Standard deviation (n = 3). All concentrations are based on ng mL−1. | ||||
| Radiological wastewater | 190 ± 10 | 200 | 381 ± 28 | 95.5 |
| Photographical wastewater | 210 ± 13 | 200 | 390 ± 38 | 90.0 |
| Electroplating wastewater | 158 ± 8 | 200 | 345 ± 23 | 93.5 |
| River water | 10.2 ± 0.6 | 10.0 | 20.5 ± 1.7 | 103 |
| Well water | 21.8 ± 1.5 | 20.0 | 39.6 ± 2.5 | 89.0 |
4. Conclusion
In this research, a MMOF functionalized with 2-aminothiophenol (2-ATP) was fabricated and employed for separation/preconcentration of trace silver amounts. At first magnetite nanoparticles (Fe3O4 NPs) was synthesized and then coated with SiO2. Thereafter, the Fe3O4@SiO2 NPs were modified with 2-ATP. Finally, the functionalized MOF fabricated by the synthesis of MIL-101(Cr) in the presence of Fe3O4@SiO2@2-ATP NPs. MIL-101(Cr)/Fe3O4@SiO2@2-ATP nanocomposite was characterized with various methods and then utilized to separation/quantification of silver ions in various real samples. Modification of MIL-101 with Fe3O4@2-APT NPs not only improves the selectivity of this sorbent toward silver ions but also facilitates the separation and extraction process. A high adsorption capacity (103 mg g−1), a low LOD (0.05 ng mL−1) and an excellent enrichment factor as high as 294 was achieved. The method was validated by analyzing as a certified reference material and performing t-test. Also, the precision of method was located in the range of 4.5–9.3%. As a result, the analytical features of the new extraction method are acceptable. Ultimately, the outlined method was employed for extraction/quantification of silver ions in various water and wastewater samples satisfactorily.Conflicts of interest
There are no conflicts to declare.References
- T. Rohani and M. A. Taher, Talanta, 2010, 80, 1827–1831 CrossRef CAS PubMed.
- T. Çetin, S. Tokalıoğlu, A. Ülgen, S. Şahan, İ. Özentürk and C. Soykan, Talanta, 2013, 105, 340–346 CrossRef PubMed.
- C. K. Christou and A. N. Anthemidis, Talanta, 2009, 78, 144–149 CrossRef CAS PubMed.
- T. Madrakian, A. Afkhami, M. A. Zolfigol and M. Solgi, J. Hazard. Mater., 2006, 128, 67–72 CrossRef CAS PubMed.
- T. W. Purcell and J. J. Peters, Environ. Toxicol. Chem., 1998, 17, 539–546 CrossRef CAS.
- M. Soylak and R. S. Cay, J. Hazard. Mater., 2007, 146, 142–147 CrossRef CAS PubMed.
- A. A. Asgharinezhad, N. Jalilian, H. Ebrahimzadeh and Z. Panjali, RSC Adv., 2015, 5, 45510–45519 RSC.
- S. Rezabeyk and M. Manoochehri, RSC Adv., 2020, 10, 36897–36905 RSC.
- S. Karami, H. Ebrahimzadeh and A. A. Asgharinezhad, Anal. Methods, 2017, 9, 2873–2882 RSC.
- N. Jalilian, H. Ebrahimzadeh, A. A. Asgharinezhad and K. Molaei, Microchim. Acta, 2017, 184, 2191–2200 CrossRef CAS.
- F. Gerondi and M. A. Z. Arruda, Talanta, 2012, 97, 395–399 CrossRef CAS PubMed.
- Y. S. Chung and R. M. Barnes, J. Anal. At. Spectrom., 1988, 3, 1079–1082 RSC.
- E. Tahmasebi and Y. Yamini, Microchim. Acta, 2014, 181, 543–551 CrossRef CAS.
- H. Ebrahimzadeh, N. Shekari, N. Tavassoli, M. M. Amini, M. Adineh and O. Sadeghi, Microchim. Acta, 2010, 170, 171–178 CrossRef CAS.
- O. Ortet and A. P. Paiva, Sep. Sci. Technol., 2010, 45, 1130–1138 CrossRef CAS.
- J. A. López-López, J. A. Jönsson, M. García-Vargas and C. Moreno, Anal. Methods, 2014, 6, 1462–1467 RSC.
- M. Chamsaz, M. H. Arbab-Zavar and J. Akhondzadeh, Anal. Sci., 2008, 24, 799–801 CrossRef CAS PubMed.
- G. Absalan, M. Akhond, L. Sheikhian and D. M. Goltz, Anal. Methods, 2011, 3, 2354–3259 RSC.
- J. B. Chao, J. F. Liu, S. J. Yu, Y. D. Feng, Z. Q. Tan, R. Liu and Y. G. Yin, Anal. Methods, 2011, 83, 6875–6882 CAS.
- Q. Ding, P. Liang, F. Song and A. Xiang, Sep. Sci. Technol., 2006, 41, 2723–2732 CrossRef CAS.
- A. Tunçeli and A. R. Türker, Talanta, 2000, 51, 889–894 CrossRef.
- M. Amjadi, A. Samadi, J. L. Manzoori and N. Arsalani, Anal. Methods, 2015, 7, 5847–5853 RSC.
- N. Jalilian, H. Ebrahimzadeh and A. A. Asgharinezhad, J. Chromatogr. A, 2019, 1608, 460426 CrossRef CAS PubMed.
- N. Jalilian, H. Ebrahimzadeh and A. A. Asgharinezhad, Microchim. Acta, 2019, 186, 597 CrossRef PubMed.
- S. Rezabeyk and M. Manoochehri, Microchim. Acta, 2018, 185, 365 CrossRef PubMed.
- Z. Li, M. Qi, C. Tu, W. Wang, J. Chen and A. J. Wang, Food Anal. Methods, 2017, 10, 4094–4103 CrossRef.
- T. Liang, S. Wang, L. Chen and N. Niu, Food Anal. Methods, 2019, 12, 217–228 CrossRef.
- A. Tadjarodi and A. Abbaszadeh, Microchim. Acta, 2016, 183, 1391–1399 CrossRef CAS.
- M. Taghizadeh, A. A. Asgharinezhad, M. Pooladi, M. Barzin, A. Abbaszadeh and A. Tadjarodi, Microchim. Acta, 2013, 180, 1073–1084 CrossRef CAS.
- M. Babazadeh, R. Hosseinzadeh-Khanmiri, J. Abolhasani, E. Ghorbani-Kalhor and A. Hassanpour, RSC Adv., 2015, 5, 19884–19892 RSC.
- E. Ghorbani-Kalhor, R. Hosseinzadeh-Khanmiri, J. Abolhasani, M. Babazadeh and A. Hassanpour, J. Sep. Sci., 2015, 38, 1179–1186 CrossRef CAS PubMed.
- A. Mehdinia, D. Jahedi Vaighan and A. Jabbari, ACS Sustainable Chem. Eng., 2018, 6, 3176–3186 CrossRef CAS.
- R. Kashanaki, H. Ebrahimzadeh and M. Moradi, New J. Chem., 2018, 42, 5806–5813 RSC.
- M. Mehraban, M. Manoochehri and F. A. Taromi, New J. Chem., 2018, 42, 17636–17643 RSC.
- A. A. Asgharinezhad and H. Ebrahimzadeh, J. Chromatogr. A, 2015, 1412, 1–11 CrossRef CAS PubMed.
- M. H. Mashhadizadeh and Z. Karami, J. Hazard. Mater., 2011, 190, 1023–1029 CrossRef CAS PubMed.
- P. Liu, Q. Pu and Z. Su, Analyst, 2000, 125, 147–150 RSC.
Footnote |
| † Electronic supplementary information (ESI) available. See DOI: 10.1039/d1ra00420d |
| This journal is © The Royal Society of Chemistry 2021 |

