 Open Access Article
Conductive chitosan/polyaniline hydrogel with cell-imprinted topography as a potential substrate for neural priming of adipose derived stem cells†
Behnaz Sadat Eftekhari ab,
Mahnaz Eskandari
 *a,
Paul A. Janmey
 *b,
Ali Samadikuchaksaraeic and
Mazaher Gholipourmalekabadi
 dce
dce
aDepartment of Biomedical Engineering, Amirkabir University of Technology, 424 Hafez Ave, Tehran, 15875-4413, Iran. E-mail: eskandarim@aut.ac.ir; Tel: +98 21 6454 23 62
bDepartment of Physiology, Institute for Medicine and Engineering, University of Pennsylvania, 1010 Vagelos Research Laboratories, 3340 Smith Walk, Philadelphia, PA 19104-6383, USA. E-mail: janmey@mail.med.upenn.edu; Fax: +1 215 573 6815; Tel: +1 215 573 7380
cCellular and Molecular Research Centre, Iran University of Medical Sciences, Tehran, Iran
dDepartment of Medical Biotechnology, Faculty of Allied Medicine, Iran University of Medical Sciences, Tehran, Iran
eDepartment of Tissue Engineering & Regenerative Medicine, Faculty of Advanced Technologies in Medicine, Iran University of Medical Sciences, Tehran, Iran
First published on 28th April 2021
Abstract
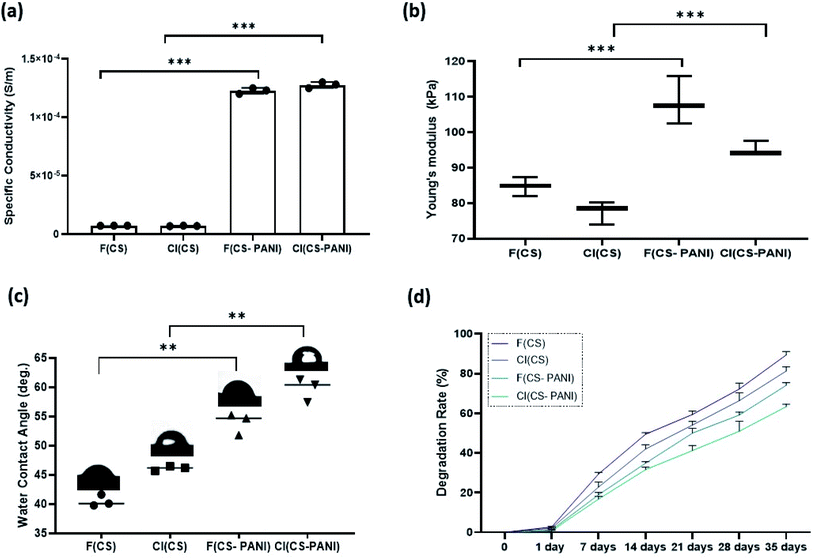
Biophysical characteristics of engineered scaffolds such as topography and electroconductivity have shown potentially beneficial effects on stem cell morphology, proliferation, and differentiation toward neural cells. In this study, we fabricated a conductive hydrogel made from chitosan (CS) and polyaniline (PANI) with induced PC12 cell surface topography using a cell imprinting technique to provide both topographical properties and conductivity in a platform. The engineered hydrogel's potential for neural priming of rat adipose-derived stem cells (rADSCs) was determined in vitro. The biomechanical analysis revealed that the electrical conductivity, stiffness, and hydrophobicity of flat (F) and cell-imprinted (CI) substrates increased with increased PANI content in the CS/PANI scaffold. The conductive substrates exhibited a lower degradation rate compared to non-conductive substrates. According to data obtained from F-actin staining and AFM micrographs, both CI(CS) and CI(CS–PANI) substrates induced the morphology of rADSCs from their irregular shape (on flat substrates) into the elongated and bipolar shape of the neuronal-like PC12 cells. Immunostaining analysis revealed that both CI(CS) and CI (CS–PANI) significantly upregulated the expression of GFAP and MAP2, two neural precursor-specific genes, in rADSCs compared with flat substrates. Although the results reveal that both cell-imprinted topography and electrical conductivity affect the neural lineage differentiation, some data demonstrate that the topography effects of the cell-imprinted surface have a more critical role than electrical conductivity on neural priming of ADSCs. The current study provides new insight into the engineering of scaffolds for nerve tissue engineering.
1. Introduction
Neurodegenerative disorders in the brain and spinal cord, traumatic injuries, and stroke influence the quality of life of 2 million people in the United States of America (USA) each year, and this number grows by an estimated 11![[thin space (1/6-em)]](https://www.rsc.org/images/entities/char_2009.gif) 000 cases annually.1,2 The regeneration of injured neurons is limited under normal conditions due to two main factors: post-damage scar formation and unguided axonal regrowth.3 Due to the ineffectiveness of numerous strategies for the regeneration of neural defects, the damaged nerves' full recovery remains challenging.4
000 cases annually.1,2 The regeneration of injured neurons is limited under normal conditions due to two main factors: post-damage scar formation and unguided axonal regrowth.3 Due to the ineffectiveness of numerous strategies for the regeneration of neural defects, the damaged nerves' full recovery remains challenging.4
New studies suggest stem cells' potential for the treatment of catastrophic diseases such as neurodegeneration and cancer.5–7 ADSCs have many advantages over other stem cells, such as the ease and low-cost procedure to harvest, abundance of tissues, low rates of aging and senescence8,9 and the ability to release neurotrophic factors such as nerve growth factor (NGF), glial-derived neurotrophic factor (GDNF), brain-derived neurotrophic factor (BDNF), ciliary neurotrophic factor (CNTF), and fibroblast growth factor (FGF) to promote the survival of motor neurons in vitro.10 Several reports have affirmed ADSCs' capability to differentiate toward neural lineage, boost axonal regeneration, myelination, and functional recovery, and protect oligodendrocytes in vivo.11–15
The stem cell environment (niche) controls the natural regeneration of damaged tissue by providing biochemical (e.g., growth factors and other soluble factors) as well as biophysical cues (e.g., shear stress, elastic modulus, geometry, and conductivity). Fundamental developments in tissue engineering have improved methods to control stem cell behaviors such as proliferation, migration, and differentiation by applying biophysical signals.16 In particular, nerve tissue engineering scaffolds must present appropriate physical characteristics supplying the proper topography, mechanical elasticity, and electrical conductivity to accelerate axonal growth during regeneration.17
Conductive scaffolds that mimic the electrical conductivity of native tissue have shown the promising ability to promote stem cell plasticity and differentiation into specific lineages by altering their membrane depolarization.18 Because of the involvement of endogenous electrical signals in neurogenesis, nerve growth, and axon guidance, biophysical studies of electrical signals are increasingly used to direct stem cell differentiation toward neuron-like cells.19 Electrically conducting polymers such as polypyrrole, polyaniline (PANI), polythiophene, and their derivatives (mainly aniline oligomers and poly(3,4-ethylene dioxythiophene)) are bioactive biomaterials for controlled delivery of electrical signals to cells.20 Despite these polymers' biocompatibility, their weak mechanical properties and poor processability require blending these polymers with other biomaterials.20 Chitosan (CS), as a biocompatible, biodegradable, non-immunogenic, and antibacterial biomaterial, is frequently considered as a promising candidate for the fabrication of electroactive hydrogels.21–26 It was reported previously that the biocompatibility of CS has a direct relationship with its degree of deacetylation (DD).27,28 Films of chitosan with high DD between 74 and 90% have shown a mild inflammatory response after implantation.29,30
Most studies have also indicated that nanopatterned surfaces activate cell-surface proteins such as integrins, which are responsible for cell surface signal transduction, cluster assembly, and formation of focal adhesion complexes containing vinculin, paxillin, and focal adhesion kinase (FAK), which alter the arrangement and mechanical tension of the cytoskeleton.31,32 Ultimately, the mechanotransduction pathway activated by mechanical tension changes the nucleus shape and the expression profile of genes involved in stem cell differentiation.33 Despite much progress to attain precise control of stem cell behavior using engineered patterned substrates, high yield, reliable, safe, and cost-effective control of stem cell fate remains a challenge.
In 2013, Mahmoudi et al., reported the cell imprinting method as a repeatable, valid, and cost-effective procedure for controlling stem cell fate.34 In the cell imprinting method, a hierarchically patterned substrate (HPS) is obtained by molding substrates on a surface containing chemically fixed cells as a template to mimic the cell shape.35 Furthermore, cell shape topography can act as a powerful regulator of cell behavior such as adhesion, differentiation, growth.
In most previous studies, silicone (i.e., PDMS) was the shaping material due to its transparency, capacity to form nano/micro-structures, and rubber-like elastic properties. The application of PDMS as a tissue engineering scaffold has several limitations, including non-biodegradability, poor electrical properties, complicated processes for improving this polymer's electrical conductivity, and undesirable mechanical properties.36
In the current study, an optimum amount of PANI (2.5% w/w) was incorporated into the chitosan matrix to obtain the desired conductivity while maintaining the flexibility and biocompatibility of chitosan.37,38 The cell imprinting technique was then used to induce the PC12 cell morphology and topography directly on the surface of a conductive CS–PANI based hydrogel. The effects of cell-imprinted topography and conductivity, alone or in combination, on the CS–PANI substrate's biomechanical properties, as well as the morphology and induction of a pro-neural state in rat adipose-derived stem cells (rADSCs) is the focus of this study.
2. Materials and methods
2.1 Materials
Polyaniline emeraldine base (PANI EB, Mw average = 65![[thin space (1/6-em)]](https://www.rsc.org/images/entities/char_2009.gif) 000), chitosan (%DD = 80, medium molecular weight), and 3-(4,5-dimethylthiazol-2-yl)-2,5-diphenyl tetrazolium bromide (MTT) were purchased from Sigma-Aldrich (St. Louis, MO, USA). Glutaraldehyde (50% w/w, analytical grade) and paraformaldehyde were acquired from Fluka (Chemie GmbH, Switzerland). AR grade N-methyl-2-pyrrolidone (NMP) (Sigma-Aldrich, St. Louis, MO, USA), acetic acid (Merck, Darmstadt, Germany), and methanol (Merck, Darmstadt, Germany) were used as received.
000), chitosan (%DD = 80, medium molecular weight), and 3-(4,5-dimethylthiazol-2-yl)-2,5-diphenyl tetrazolium bromide (MTT) were purchased from Sigma-Aldrich (St. Louis, MO, USA). Glutaraldehyde (50% w/w, analytical grade) and paraformaldehyde were acquired from Fluka (Chemie GmbH, Switzerland). AR grade N-methyl-2-pyrrolidone (NMP) (Sigma-Aldrich, St. Louis, MO, USA), acetic acid (Merck, Darmstadt, Germany), and methanol (Merck, Darmstadt, Germany) were used as received.
2.2 Fabrication of flat and cell-imprinted CS–PANI substrates
![[thin space (1/6-em)]](https://www.rsc.org/images/entities/char_2009.gif) :
:![[thin space (1/6-em)]](https://www.rsc.org/images/entities/char_2009.gif) 2.5 w/w), the desired amount of PANI/NMP solution was mixed with the chitosan solution. Then the mixture was stirred at room temperature for 24 h. Also, 0.8 ml glycerol was added to each mixture as a plasticizer while stirring. Flat CS (F(CS)) and flat conductive CS–PANI (F(CS–PANI)) substrates were fabricated by casting prepared CS and CS–PANI solutions on glass coated with PDL and Lam and dried in a vacuum oven at 37 °C for 24 h. Crosslinking the samples was carried out by immersing the film in a 0.0025% glutaraldehyde (0.5 mM) at room temperature. The prepared substrates were neutralized by washing them with 1 M NaOH solution. Subsequently, the excess acid and any trace of glutaraldehyde were removed by washing samples with PBS (pH = 7.2) and the substrates dried under vacuum for more than 24 h.
2.5 w/w), the desired amount of PANI/NMP solution was mixed with the chitosan solution. Then the mixture was stirred at room temperature for 24 h. Also, 0.8 ml glycerol was added to each mixture as a plasticizer while stirring. Flat CS (F(CS)) and flat conductive CS–PANI (F(CS–PANI)) substrates were fabricated by casting prepared CS and CS–PANI solutions on glass coated with PDL and Lam and dried in a vacuum oven at 37 °C for 24 h. Crosslinking the samples was carried out by immersing the film in a 0.0025% glutaraldehyde (0.5 mM) at room temperature. The prepared substrates were neutralized by washing them with 1 M NaOH solution. Subsequently, the excess acid and any trace of glutaraldehyde were removed by washing samples with PBS (pH = 7.2) and the substrates dried under vacuum for more than 24 h.2.3 Characterization of prepared substrates
 | (1) |
| Degradation (%) = (W0 − Wd)/W0 × 100% | (2) |
2.4 CS–PANI substrates/rADSCs interaction
| Absorbance value (OD) = average OD of the samples − average OD of the negative control |
The cell culture media without substrates and cells was considered as a negative control. The cells cultured on the cell culture plate's plastic surface served as a positive control (considered 100% cell viability). All data of the test were expressed as means ± standard deviation (SD) for n = 4. The Kolmogorov–Smirnov test was applied to investigate the normal distribution of each group of samples. Finally, a one-way ANOVA and Duncan test (GraphPad Prism 7 software) was performed to compare the data. P < 0.05 was considered a significant difference.
2.4.6.1 Immunostaining. The cell morphology and expression of neuron cell-specific markers were investigated using optical and fluorescence microscopy (Nikon, Japan) to evaluate the neural differentiation capability of rADSCs on prepared substrates. After 8 days from neural induction, the cells seeded on substrates were rinsed with PBS and fixed with 4% PFA in PBS (pH 7.4) for 20 min. In the next step, the cells were permeabilized in a solution containing 0.5% Triton X-100 in PBS for 10 min. To block non-specific antibodies, the cells were incubated with 10% normal goat serum for 1 h at room temperature (0.05% Tween 20 and 1% (w/v) bovine serum albumin (BSA)). Detection and characterization of neuronal cells were carried out by staining the cells with antibodies against GFAP and MAP2. Antibodies to GFAP (1:100; Abcam) and MAP 2 (1:50; Millipore) were added to the cell medium for staining overnight at 4 °C. After cells were washed with PBS, the secondary antibody, including Alexa 488-conjugated goat anti-mouse and anti-rabbit antibodies, was added to cells and incubated for 1 h. Finally, the nuclei of cells were counterstained with DAPI. An Olympus BX51 fluorescence microscope was used to obtain fluorescence images.
2.5 Statistical analysis
Statistical analyses were performed using SPSS. Data are expressed as the mean – SD, and p < 0.05 was considered statistically significant.3. Results and discussion
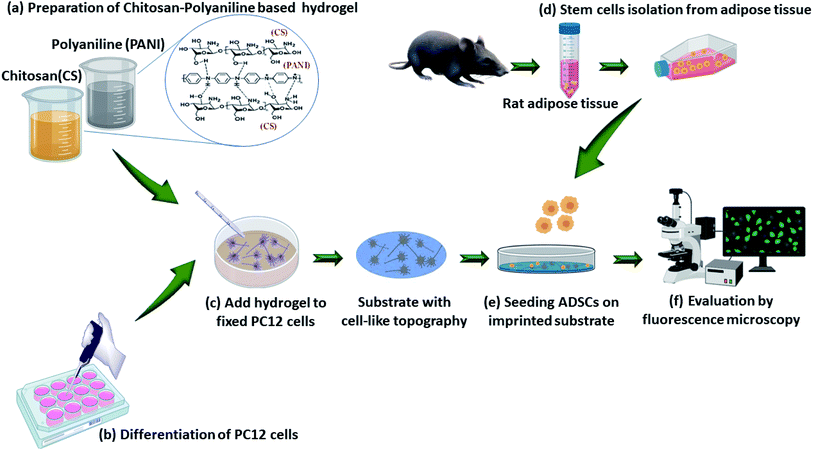
In the current study, the influences of cell-imprinted topography and conductivity, alone or in combination, of the CS–PANI substrates on the morphology and neural differentiation of rADSCs were evaluated. Fig. 1 represents the method of this study.3.1 Characterization of CS–PANI substrates
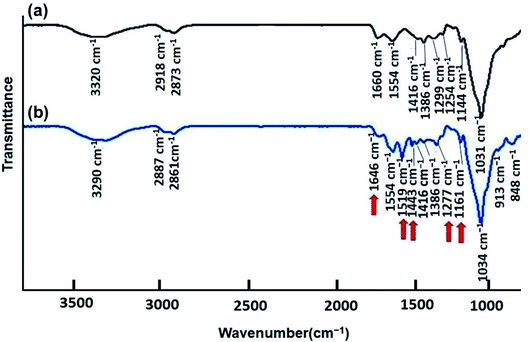
![[double bond, length as m-dash]](https://www.rsc.org/images/entities/char_e001.gif) O in amide groups (NHCOCH3) because of the partial deacetylation of CS. N–H bending is observed at 1554 and 1416 cm−1. The transmission peak at 1386 cm−1 is due to the C–OH vibration of the alcohol groups in CS. Other main peaks observed in CS spectra involving 1299 cm−1, 1254 cm−1, and 1144 cm−1 are ascribed to anti-symmetric stretching of the C–O–C bridge and the C–O stretching, respectively.42,43 After blending PANI with CS, a small shift of peaks can be seen for the PANI–CS composite with N–H stretching vibrations at 3290 cm−1, C–H stretching, and vibrations at 2887/2861 cm−1, respectively. A slight shift of peaks is also indicated with the amide I and II vibrations at 1646 cm−1 for the CS–PANI composite. Because of interactions between CS and PANI and conformational changes, small shifts occurred on the C–H bending vibration of the amide methyl group (1386 cm−1) and the C–O stretching vibrations at 1161–1034 cm−1. The characteristic transmission bands of PANI are also authenticated in the CS–PANI blend spectrum. The transmission peaks corresponding to the C
O in amide groups (NHCOCH3) because of the partial deacetylation of CS. N–H bending is observed at 1554 and 1416 cm−1. The transmission peak at 1386 cm−1 is due to the C–OH vibration of the alcohol groups in CS. Other main peaks observed in CS spectra involving 1299 cm−1, 1254 cm−1, and 1144 cm−1 are ascribed to anti-symmetric stretching of the C–O–C bridge and the C–O stretching, respectively.42,43 After blending PANI with CS, a small shift of peaks can be seen for the PANI–CS composite with N–H stretching vibrations at 3290 cm−1, C–H stretching, and vibrations at 2887/2861 cm−1, respectively. A slight shift of peaks is also indicated with the amide I and II vibrations at 1646 cm−1 for the CS–PANI composite. Because of interactions between CS and PANI and conformational changes, small shifts occurred on the C–H bending vibration of the amide methyl group (1386 cm−1) and the C–O stretching vibrations at 1161–1034 cm−1. The characteristic transmission bands of PANI are also authenticated in the CS–PANI blend spectrum. The transmission peaks corresponding to the C![[double bond, length as m-dash]](https://www.rsc.org/images/entities/char_e001.gif) N stretching vibration of the quinonoid ring and the C
N stretching vibration of the quinonoid ring and the C![[double bond, length as m-dash]](https://www.rsc.org/images/entities/char_e001.gif) C stretching vibration of the benzenoid ring can be seen at 1554 and 1519 cm−1, respectively.44,45 The presence of these peaks confirms that the synthesized composite samples contained PANI.
C stretching vibration of the benzenoid ring can be seen at 1554 and 1519 cm−1, respectively.44,45 The presence of these peaks confirms that the synthesized composite samples contained PANI.
γsv = γsl + γlv![[thin space (1/6-em)]](https://www.rsc.org/images/entities/char_2009.gif) cos cos![[thin space (1/6-em)]](https://www.rsc.org/images/entities/char_2009.gif) θY, θY,
| (3) |
cos![[thin space (1/6-em)]](https://www.rsc.org/images/entities/char_2009.gif) θm = r θm = r![[thin space (1/6-em)]](https://www.rsc.org/images/entities/char_2009.gif) cos cos![[thin space (1/6-em)]](https://www.rsc.org/images/entities/char_2009.gif) θY, θY,
| (4) |
3.2 Characterization of rat adipose-derived stem cells (rADSCs)
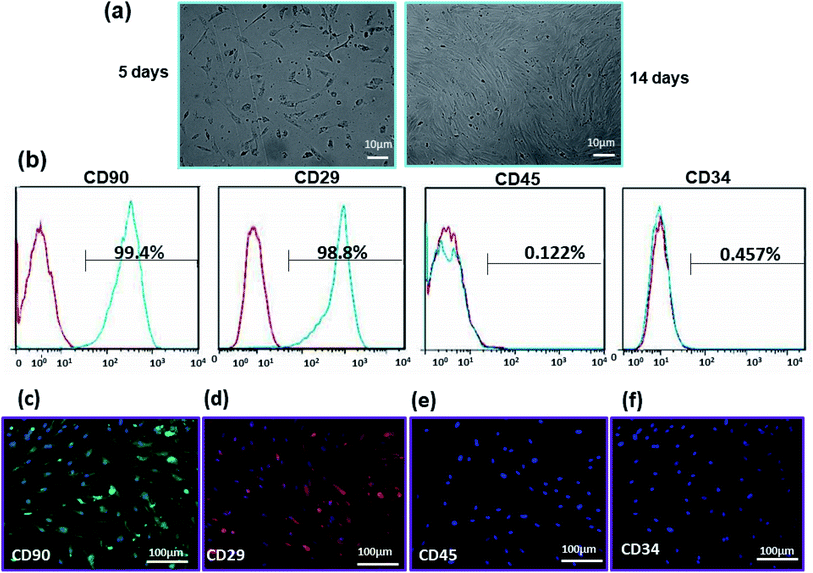
Fibroblast-like morphology and specific CD markers on the cell surface are the most important criteria for the characterization of ADSCs.54,55 These cells are positive for mesenchymal specific markers such as CD29 and CD90 and negative for hematopoietic stems cell markers such as CD34 and CD45.56 The morphology of ADSCs after 5 and 14 days after isolation is shown in Fig. 5(a). These cells display the adherent and typical fibroblast-like morphology under optical microscopy. Flow cytometry results demonstrate that 99.4% and 98.85% of the cell population are positive for CD90 and CD29, while only 0.122% and 0.457% of them are positive for CD34 and CD45, respectively (Fig. 5(b)). Immunostaining by CD surface markers was also performed (Fig. 5(c)–(f)). These results reveal that more than 98% of rADSCs positively express the mesenchymal stem cell markers CD29 and CD90 but do not express the hematopoietic stem cell marker CD45 and CD34 (<1%).3.3 Cell attachment and morphology on substrates
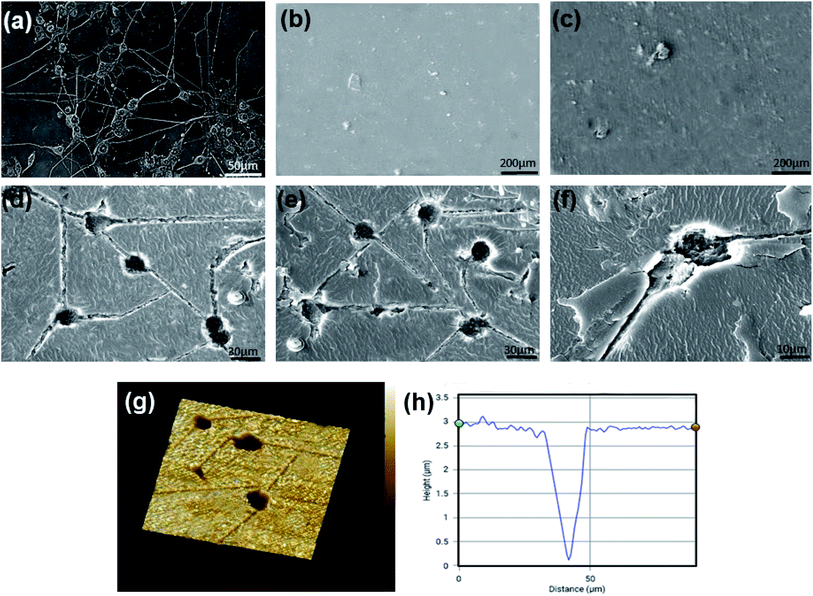
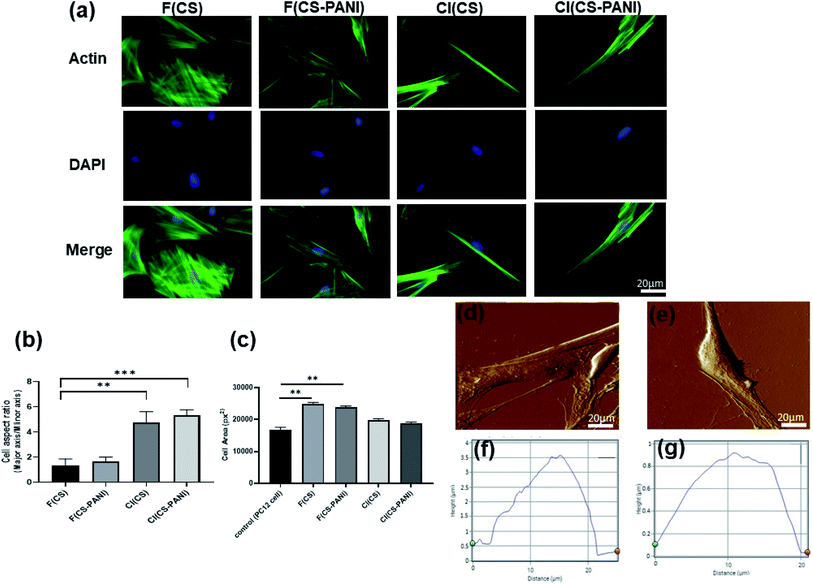
An optimal biomimetic scaffold should support a microenvironment for cell attachment, growth, and migration.57,58 The morphology of the rADSCs grown on the substrates was observed using F-actin staining and AFM imaging, and the results are shown in Fig. 6. F-actin staining of ADSCs cultured on flat and imprinted substrates to visualize cytoskeleton is seen in Fig. 6(a). The flattened irregular morphology of rADSCs on flat substrates and stretched bipolar shape of cells on imprinted substrates are visible in these figures. The ADSCs become slightly elongated on flat conductive CS–PANI substrates compared to flat pure CS substrates. In particular, the cell aspect ratio (which denotes the ratio of the major axis to the minor axis) (Fig. 6(b)) indicates that rADSCs cultured on cell-imprinted substrates exhibit obvious elongation and different morphology after adhering to the PC12-imprinted pattern. The measurement of rADSCs cell area on different substrates demonstrates that the cultured cells on the cell-imprinted substrate have surface areas closest to those of the PC12 cells used as control.Fig. 6(d) and (e) display the different morphology of rADSCs grown on the cell-imprinted substrate and flat substrate as visualized by AFM. The cells' morphology on all substrates confirms the excellent cell adhesion property of prepared substrates for rADSCs. Also, it can be seen that the flattened irregular shape of ADSCs converts into the more elongated, bipolar shape on cell-imprinted substrates compared with flat substrates. These results support the results of F-actin staining. Height profiles of cells attached on substrates, Fig. 6(f) and (g), show the differences in the height of cultured cells on flat substrates and on cell-imprinted substrates. These findings indicate the power of the cell-imprinted topography to induce cell morphology. Although attachment and morphology of cells can be adjusted by surface chemistry, attachment forces mediated by topography might play an important role upon extended contact over time. Previous studies have shown that cells tend to adhere to rough surfaces better than smooth surfaces.59,60
3.4 Cell viability study (MTT assay)
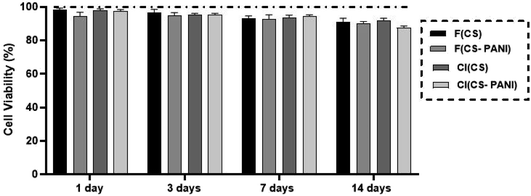
The biocompatibility of pure CS substrates and CS–PANI substrates was evaluated by MTT assay to define the PANI concentration's effect on rADSCs proliferation on 1, 3, 7, 14 days after cells seeding. The determination of proliferation rate (Fig. 7) shows no significant difference between cells in the different experimental groups (p ≥ 0.05). These results confirm the biocompatibility and supporting role of flat and cell-imprinted CS and CS–PANI substrates for the adhesion and growth of rADSCs. As PANI has concentration-dependent cytotoxicity, it is important to optimize the PANI containing conductive scaffolds in their biocompatible dose.61 Our cell viability assay shows no sign of cytotoxicity in the CS–PANI substrates for ADSCs, indicating the optimal concentration of PANI in our constructs.3.5 Neural lineage induction and differentiation
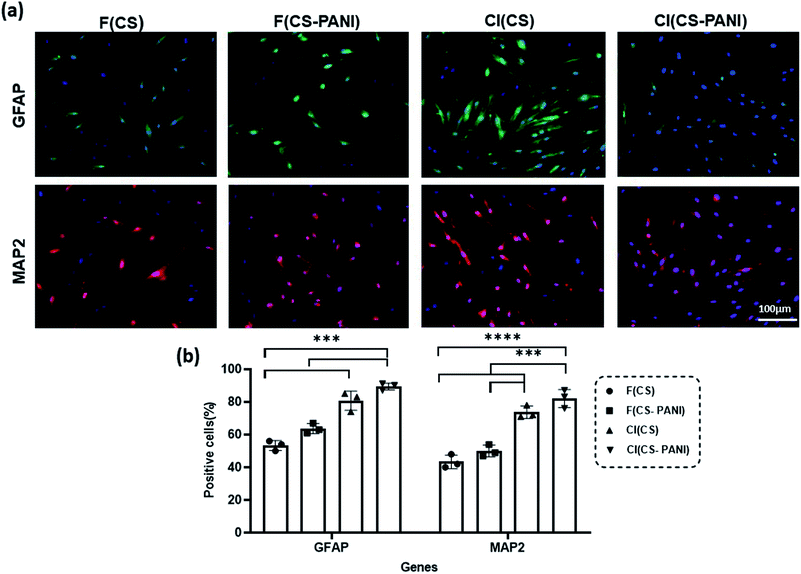
Several studies reported that the biophysical characteristics of scaffolds such as topographic features at the micro- and nanoscale62 and conductivity63 can regulate the behavior of the mammalian cells.64,65 Micro- and nanoscale topography can direct cell fate by activating mechanotransduction pathways, rearranging the cytoskeleton and nuclear shape alignment, and ultimately altering transcription programs and protein expression.66–68 Endogenous electric fields in tissues such as nerve, heart, and bone dictate stem cell differentiation toward a specific lineage of native tissue by altering the membrane depolarization.69–71 Therefore, recent studies investigate the synergetic effect of these two factors on guiding stem cells' differentiation into specific cell lineage. In the current study, we explored the effects of these two biophysical cues together on the guidance of neural differentiation of rADSCs.After treatment of rADSCs with neurosphere induction media, neurosphere formation was confirmed by light microscopy (ESI Fig. 2a†) and immunostaining with Oct4 (ESI Fig. 2b†).41 The substrates' potential for neural priming of the ADSCs was determined by immunostaining of neural precursor cell specific markers (MAP2 and GFAP) (Fig. 8). MAP2 and GFAP markers are expressed in differentiated neurons and astrocytes, respectively. The conductive samples exhibit a slight increase in the number of GFAP and MAP2 positive cells in comparison with cell-imprinted substrates with the same composition (F(CS–PANI) vs. F(CS), and CI (CS–PANI) vs. CI (CS)), but the increase is not statistically significant. On the other hand, all the cell-imprinted substrates show a significant increase in the GFAP and MAP2 positive cell number when compared with flat substrates with the same composition (CI (CS–PANI) vs. F (CS–PANI), and CI (CS) vs. F(CS)).
All the immunostaining data reveal the higher impact of cell-imprinting topography on the neural priming of rADSCs compared with PANI-induced conductive substrates. The results obtained from immunostaining indicate that the percentage of the cells expressing MAP2 and GFAP in the CI (CS–PANI) group (82.1 ± 5.5% MAP2 positive cells and 89.3 ± 2.1% GFAP positive cells) is higher than other experimental groups (Fig. 8(b)). The lowest percentage of GFAP (53.3 ± 3.1%) and MAP2 (43.3 ± 4.2%) positive cells is observed in the F (CS) sample when compared with other experimental groups. These results reveal the greater importance of the PC 12 cell-imprinting topography than conductivity induced with PANI on neural priming of rADSCs. Earlier studies demonstrated that cell-imprinted topography imitates the plasma membrane's surface morphology of the respective mature cell types used as templates. This topography could regulate stem cell differentiation through selective activation of the printed matured cells' genes, which lead to the autoactivation of specific complex cell signaling pathways.34,35,72
Also, a slight increase in the number of GFAP and MAP2 positive cells in conductive samples compared with pure CS substrates with the same surface topographical feature (F(CS–PANI) vs. F(CS), and CI (CS–PANI) vs. CI (CS)) suggests an additional role of electrical conduction in inducing of a pro-neural phenotype in ADSCs. However, we suggest that to determine better the effects of electrical conductivity induced by PANI on the cell, it is the best to apply an exogenous electrical signal to the stem cells cultured on the prepared substrate in future studies. Several studies infer that electrical stimulation is able to enhance the NGF-induced neuronal differentiation through activation of the mitogen-activated protein kinase (MEK)–extracellular signal regulated kinase (ERK1/2)–Egr1 pathway.73–75
Our results demonstrate that morphology and the neural priming of ADSCs are modulated by cell-imprinted topography and electrical conductivity. In our case, surface topography effects of the cell-imprinted surface have a more important role than electrical conductivity. It must be noted that although neural priming, as assessed by gene expression level (protein expression), has been observed from the induction of conductive cell-imprinted topography, the mechanisms that contribute to the changes in stem cell behaviors remain to be determined in future experiments.
4. Conclusion
The substrates produced for neurogenic differentiation effectively simulate the natural ECM of neuron cells in multiple aspects. According to our findings, the conductive cell-imprinted substrates can mimic nerve tissue's topography and conductivity, which can physically direct the stem cells' differentiation toward neuron like cells. PC12-imprinted CS–PANI substrates exhibit desirable characteristics such as appropriate mechanical properties, degradation rate, and good wettability, representing effective parameters required for neural differentiation. In conclusion, this work prepares a pioneered design of the PC12 cells morphology directly imprinted to a conductive hydrogel for controlling the morphology and neural priming of ADSCs.Ethics approval
This article does not contain any studies with human or animal subjects performed by any of the author.Author contributions
Behnaz Sadat Eftekhari: conceptualization, methodology, writing – original draft, data curation. Mahnaz Eskandari: supervision, formal analysis, writing – review & editing, project administration. Paul Janmey: supervision, validation, formal analysis, writing – review & editing, project administration. Ali Samadikuchaksaraei: validation and visualization. Mazaher Gholipourmalekabadi: writing – review & editing, validation and visualization.Conflicts of interest
The authors declare that there is no conflict of interest.Acknowledgements
The authors would like to thank the support from Amirkabir University of Technolody and the US National Science Foundation. Grants NSF DMR-1720530 and CMMI-154857.References
- W. A. Rocca, R. C. Petersen, D. S. Knopman, L. E. Hebert, D. A. Evans, K. S. Hall, S. Gao, F. W. Unverzagt, K. M. Langa and E. B. Larson, Alzheimer's Dementia, 2011, 7, 80–93 CrossRef PubMed.
- J. M. Ketchum, J. P. Cuthbert, A. Deutsch, Y. Chen, S. Charlifue, D. Chen, M. P. Dijkers, J. E. Graham, A. W. Heinemann and D. P. Lammertse, Spinal Cord, 2018, 56, 126–132 CrossRef PubMed.
- K. Jessen and R. Mirsky, J. Physiol., 2016, 594, 3521–3531 CrossRef CAS PubMed.
- Y. Wu, L. Wang, B. Guo, Y. Shao and P. X. Ma, Biomaterials, 2016, 87, 18–31 CrossRef CAS PubMed.
- O. Lindvall and Z. Kokaia, Nature, 2006, 441, 1094–1096 CrossRef CAS PubMed.
- A. Hasan, G. Deeb, R. Rahal, K. Atwi, S. Mondello, H. E. Marei, A. Gali and E. Sleiman, Front. Neurol., 2017, 8, 28 Search PubMed.
- N. Poovaiah, Z. Davoudi, H. Peng, B. Schlichtmann, S. Mallapragada, B. Narasimhan and Q. Wang, Nanoscale, 2018, 10, 16962–16983 RSC.
- J. Y. Chung, W. Kim, W. Im, D. Y. Yoo, J. H. Choi, I. K. Hwang, M.-H. Won, I. B. Chang, B. M. Cho and H. S. Hwang, J. Neurol. Sci., 2012, 317, 40–46 CrossRef CAS PubMed.
- S. M. Moon, W. Kim, J. Y. Chung, W. Im, D. Y. Yoo, H. Y. Jung, M.-H. Won, J. H. Choi and I. K. Hwang, BioMed Res. Int., 2012, 317(1–2), 40–46 Search PubMed.
- C. A. Tobias, S. S. Han, J. S. Shumsky, D. Kim, M. Tumolo, N. O. Dhoot, M. A. Wheatley, I. Fischer, A. Tessler and M. Murray, J. Neurotrauma, 2005, 22, 138–156 CrossRef PubMed.
- J.-L. Boulland, M. Mastrangelopoulou, A. C. Boquest, R. Jakobsen, A. Noer, J. C. Glover and P. Collas, Stem Cells Dev., 2013, 22, 1042–1052 CrossRef CAS PubMed.
- S. Gao, P. Zhao, C. Lin, Y. Sun, Y. Wang, Z. Zhou, D. Yang, X. Wang, H. Xu and F. Zhou, Tissue Eng., Part A, 2014, 20, 1271–1284 CrossRef CAS PubMed.
- S. Jang, J.-S. Park and H.-S. Jeong, Stem Cells Int., 2015, 2015, 178618 Search PubMed.
- Y. Liqing, G. Jia, C. Jiqing, G. Ran, C. Fei, K. Jie, W. Yanyun and Z. Cheng, NeuroReport, 2011, 22, 370–373 CrossRef PubMed.
- S. Gao, X. Guo, S. Zhao, Y. Jin, F. Zhou, P. Yuan, L. Cao, J. Wang, Y. Qiu and C. Sun, Cell Death Dis., 2019, 10, 1–15 CrossRef PubMed.
- W. F. Liu and C. S. Chen, Mater. Today, 2005, 8, 28–35 CrossRef.
- M. Georgiou, J. P. Golding, A. J. Loughlin, P. J. Kingham and J. B. Phillips, Biomaterials, 2015, 37, 242–251 CrossRef CAS PubMed.
- W. Zhu, T. Ye, S.-J. Lee, H. Cui, S. Miao, X. Zhou, D. Shuai and L. G. Zhang, Nanomedicine, 2018, 14, 2485–2494 CrossRef CAS PubMed.
- R. Zhu, Z. Sun, C. Li, S. Ramakrishna, K. Chiu and L. He, Exp. Neurol., 2019, 319, 112963 CrossRef PubMed.
- B. Guo and P. X. Ma, Biomacromolecules, 2018, 19, 1764–1782 CrossRef CAS PubMed.
- S. M. Ahsan, M. Thomas, K. K. Reddy, S. G. Sooraparaju, A. Asthana and I. Bhatnagar, Int. J. Biol. Macromol., 2018, 110, 97–109 CrossRef CAS PubMed.
- M. Rodríguez-Vázquez, B. Vega-Ruiz, R. Ramos-Zúñiga, D. A. Saldaña-Koppel and L. F. Quiñones-Olvera, BioMed Res. Int., 2015, 2015, 821279 Search PubMed.
- N. Rezaei, H. G. Hamidabadi, S. Khosravimelal, M. Zahiri, Z. A. Ahovan, M. N. Bojnordi, B. S. Eftekhari, A. Hashemi, F. Ganji and S. Darabi, Int. J. Biol. Macromol., 2020, 164, 855–862 CrossRef CAS PubMed.
- Z. A. Ahovan, S. Khosravimelal, B. S. Eftekhari, S. Mehrabi, A. Hashemi, S. Eftekhari, P. B. Milan, M. Mobaraki, A. M. Seifalian and M. Gholipourmalekabadi, Int. J. Biol. Macromol., 2020, 164, 4475–4486 CrossRef PubMed.
- X. Wei, J. Liao, Z. Davoudi, H. Zheng, J. Chen, D. Li, X. Xiong, Y. Yin, X. Yu and J. Xiong, Mar. Drugs, 2018, 16, 439 CrossRef CAS PubMed.
- B. Yang, J. Jiang, L. Jiang, P. Zheng, F. Wang, Y. Zhou, Z. Chen, M. Li, M. Lian and S. Tang, Int. J. Biol. Macromol., 2020, 149, 108–115 CrossRef CAS PubMed.
- R. Hu, H. Zheng, J. Cao, Z. Davoudi and Q. Wang, J. Biomed. Nanotechnol., 2017, 13, 1097–1105 CrossRef CAS PubMed.
- Q. Wang, Y. Du, L. Fan, H. Liu and X. Wang, Wuhan Univ. J. Nat. Sci., 2003, 6, 013 Search PubMed.
- S. Sapru, A. K. Ghosh and S. C. Kundu, Carbohydr. Polym., 2017, 167, 196–209 CrossRef CAS PubMed.
- M. Rodríguez-Vázquez, B. Vega-Ruiz, R. Ramos-Zúñiga, D. A. Saldaña-Koppel and L. F. Quiñones-Olvera, BioMed Res. Int., 2015, 2015, 821279 Search PubMed.
- Y. Zhang, A. Gordon, W. Qian and W. Chen, Adv. Healthcare Mater., 2015, 4, 1900–1914 CrossRef CAS PubMed.
- M. Ermis, E. Antmen and V. Hasirci, Bioact. Mater., 2018, 3, 355–369 CrossRef PubMed.
- M. Ventre and P. A. Netti, ACS Appl. Mater. Interfaces, 2016, 8, 14896–14908 CrossRef CAS PubMed.
- M. Mahmoudi, S. Bonakdar, M. A. Shokrgozar, H. Aghaverdi, R. Hartmann, A. Pick, G. Witte and W. J. Parak, ACS Nano, 2013, 7, 8379–8384 CrossRef CAS PubMed.
- S. Bonakdar, M. Mahmoudi, L. Montazeri, M. Taghipoor, A. Bertsch, M. A. Shokrgozar, S. Sharifi, M. Majidi, O. Mashinchian and M. Hamrang Sekachaei, ACS Appl. Mater. Interfaces, 2016, 8, 13777–13784 CrossRef CAS PubMed.
- A. Mata, A. J. Fleischman and S. Roy, Biomed. Microdevices, 2005, 7, 281–293 CrossRef CAS PubMed.
- H. Baniasadi, A. R. SA and S. Mashayekhan, Int. J. Biol. Macromol., 2015, 74, 360–366 CrossRef CAS PubMed.
- V. Guarino, M. A. Alvarez-Perez, A. Borriello, T. Napolitano and L. Ambrosio, Adv. Healthcare Mater., 2013, 2, 218–227 CrossRef CAS PubMed.
- A. Orlowska, P. T. Perera, M. Al Kobaisi, A. Dias, H. K. D. Nguyen, S. Ghanaati, V. Baulin, R. J. Crawford and E. P. Ivanova, Materials, 2018, 11, 60 CrossRef PubMed.
- J. Sun, W. H. Liu, F. M. Deng, Y. H. Luo, K. Wen, H. Zhang, H. R. Liu, J. Wu, B. Y. Su and Y. L. Liu, Exp. Ther. Med., 2018, 15, 1424–1432 CAS.
- M. Darvishi, T. Tiraihi, S. A. Mesbah-Namin, A. Delshad and T. Taheri, Cell. Mol. Neurobiol., 2017, 37, 275–289 CrossRef CAS PubMed.
- J. Nunthanid, M. Laungtana-Anan, P. Sriamornsak, S. Limmatvapirat, S. Puttipipatkhachorn, L. Y. Lim and E. Khor, J. Controlled Release, 2004, 99, 15–26 CrossRef CAS PubMed.
- Z. Osman and A. K. Arof, Electrochim. Acta, 2003, 48, 993–999 CrossRef CAS.
- M. R. Gizdavic-Nikolaidis, D. R. Stanisavljev, A. J. Easteal and Z. D. Zujovic, J. Phys. Chem. C, 2010, 114, 18790–18796 CrossRef CAS.
- A. G. Yavuz, A. Uygun and V. R. Bhethanabotla, Carbohydr. Polym., 2010, 81, 712–719 CrossRef CAS.
- W. Zhao, W. Cui, S. Xu, L.-Z. Cheong, D. Wang and C. Shen, Nanoscale Adv., 2019, 1, 537–545 RSC.
- D. E. Discher, P. Janmey and Y.-l. Wang, Science, 2005, 310, 1139–1143 CrossRef CAS.
- S. K. Seidlits, Z. Z. Khaing, R. R. Petersen, J. D. Nickels, J. E. Vanscoy, J. B. Shear and C. E. Schmidt, Biomaterials, 2010, 31, 3930–3940 CrossRef CAS PubMed.
- H. Valentová and J. Stejskal, Synth. Met., 2010, 160, 832–834 CrossRef.
- R. N. Palchesko, L. Zhang, Y. Sun and A. W. Feinberg, PLoS One, 2012, 7(12), e51499 CrossRef CAS PubMed.
- C. Yang, U. Tartaglino and B. Persson, Phys. Rev. Lett., 2006, 97, 116103 CrossRef CAS PubMed.
- M. L. Carman, T. G. Estes, A. W. Feinberg, J. F. Schumacher, W. Wilkerson, L. H. Wilson, M. E. Callow, J. A. Callow and A. B. Brennan, Biofouling, 2006, 22, 11–21 CrossRef CAS PubMed.
- F. Guilak, D. M. Cohen, B. T. Estes, J. M. Gimble, W. Liedtke and C. S. Chen, Cell Stem Cell, 2009, 5, 17–26 CrossRef CAS PubMed.
- L. Jiang, J.-K. Zhu, X.-L. Liu, P. Xiang, J. Hu and W.-H. Yu, NeuroReport, 2008, 19, 1015–1019 CrossRef PubMed.
- M. J. Lopez and N. D. Spencer, in Adipose-Derived Stem Cells, Springer, 2011, pp. 37–46 Search PubMed.
- M. Sgodda, H. Aurich, S. Kleist, I. Aurich, S. König, M. M. Dollinger, W. E. Fleig and B. Christ, Exp. Cell Res., 2007, 313, 2875–2886 CrossRef CAS PubMed.
- S. S. Negah, Z. Khaksar, H. Aligholi, S. M. Sadeghi, S. M. M. Mousavi, H. Kazemi, A. J. Jahan-Abad and A. Gorji, Mol. Neurobiol., 2017, 54, 8050–8062 CrossRef PubMed.
- M. L. Muerza-Cascante, A. Shokoohmand, K. Khosrotehrani, D. Haylock, P. D. Dalton, D. W. Hutmacher and D. Loessner, Acta Biomater., 2017, 52, 145–158 CrossRef CAS PubMed.
- F. Gentile, L. Tirinato, E. Battista, F. Causa, C. Liberale, E. M. di Fabrizio and P. Decuzzi, Biomaterials, 2010, 31, 7205–7212 CrossRef CAS PubMed.
- H. Amani, H. Arzaghi, M. Bayandori, A. S. Dezfuli, H. Pazoki-Toroudi, A. Shafiee and L. Moradi, Adv. Mater. Interfaces, 2019, 6, 1900572 CrossRef.
- G. Kaur, R. Adhikari, P. Cass, M. Bown and P. Gunatillake, RSC Adv., 2015, 5, 37553–37567 RSC.
- G. Abagnale, A. Sechi, M. Steger, Q. Zhou, C.-C. Kuo, G. Aydin, C. Schalla, G. Müller-Newen, M. Zenke and I. G. Costa, Stem Cell Rep., 2017, 9, 654–666 CrossRef CAS PubMed.
- K. Yang, S. J. Yu, J. S. Lee, H.-R. Lee, G.-E. Chang, J. Seo, T. Lee, E. Cheong, S. G. Im and S.-W. Cho, Nanoscale, 2017, 9, 18737–18752 RSC.
- L. Tian, M. P. Prabhakaran, J. Hu, M. Chen, F. Besenbacher and S. Ramakrishna, Colloids Surf., B, 2016, 145, 420–429 CrossRef CAS PubMed.
- B. S. Eftekhari, M. Eskandari, P. A. Janmey, A. Samadikuchaksaraei and M. Gholipourmalekabadi, Adv. Funct. Mater., 2020, 1907792 CrossRef CAS.
- K. Metavarayuth, P. Sitasuwan, X. Zhao, Y. Lin and Q. Wang, ACS Biomater. Sci. Eng., 2016, 2, 142–151 CrossRef CAS PubMed.
- M. J. Dalby, N. Gadegaard and R. O. Oreffo, Nat. Mater., 2014, 13, 558–569 CrossRef CAS PubMed.
- L. E. McNamara, R. J. McMurray, M. J. Biggs, F. Kantawong, R. O. Oreffo and M. J. Dalby, J. Tissue Eng., 2010, 1, 120623 CrossRef PubMed.
- S. Sundelacruz, M. Levin and D. L. Kaplan, Sci. Rep., 2015, 5, 18279 CrossRef CAS PubMed.
- K. Lynch, O. Skalli and F. Sabri, J. Funct. Biomater., 2018, 9, 30 CrossRef PubMed.
- G. Thrivikraman, G. Madras and B. Basu, Biomaterials, 2014, 35, 6219–6235 CrossRef CAS PubMed.
- Y. Zhu, X. Liu, J. Wu, T. M. Wong, X. Feng, C. Yang, S. Wu, Y. Zheng, X. Liu and K. M. Cheung, ACS Appl. Mater. Interfaces, 2019, 11, 35513–35524 CrossRef CAS PubMed.
- C. Fu, S. Pan, Y. Ma, W. Kong, Z. Qi and X. Yang, Artif. Cells, Nanomed., Biotechnol., 2019, 47, 1867–1876 CrossRef CAS PubMed.
- D. P. Bhattarai, T. I. Hwang, J. I. Kim, J. H. Lee, S. Chun, B.-S. Kim, C. H. Park and C. S. Kim, Mater. Sci. Eng., C, 2020, 107, 110325 CrossRef CAS PubMed.
- E. Tomaskovic-Crook, P. Zhang, A. Ahtiainen, H. Kaisvuo, C. Y. Lee, S. Beirne, Z. Aqrawe, D. Svirskis, J. Hyttinen and G. G. Wallace, Adv. Healthcare Mater., 2019, 8, 1900425 CrossRef PubMed.
Footnote |
| † Electronic supplementary information (ESI) available. See DOI: 10.1039/d1ra00413a |
| This journal is © The Royal Society of Chemistry 2021 |

