 Open Access Article
Investigation of the dissolution and diffusion properties of interstitial oxygen at grain boundaries in body-centered-cubic iron by the first-principles study
Zhijie Liuab,
Yange Zhang*b,
Xiangyan Lib,
Yichun Xu*b,
Xuebang Wub,
Changsong Liub,
Xiangshan Kongc,
Cunfeng Yaod and
Zhiguang Wangd
aInstitutes of Physical Science and Information Technology, Anhui University, Hefei 230601, China
bKey Laboratory of Materials Physics, Institute of Solid State Physics, HFIPS, Chinese Academy of Sciences, Hefei 230031, China. E-mail: yangezhang@issp.ac.cn; xuyichun@issp.ac.cn
cKey Laboratory for Liquid-Solid Structural Evolution and Processing of Materials, Ministry of Education, Shandong University, Jinan, Shandong 250061, China
dInstitute of Modern Physics, Chinese Academy of Sciences, Lanzhou 730000, P. R. China
First published on 24th February 2021
Abstract
Oxidation corrosion of steel is a universal problem in various industries and severely accelerated in nuclear reactors. First-principles calculations are performed to explore the dissolution and diffusion properties of interstitial oxygen in the body-centered-cubic iron grain boundaries Σ3〈110〉(111) and Σ5〈001〉(310). Solution energies indicate that interstitial oxygen atoms prefer to dissolve in body-centered-cubic iron, and energetically segregate to grain boundaries. Energy barriers show that oxygen atoms would segregate towards Σ3〈110〉(111) with a low energy barrier. However, they concentrate to the transition region of Σ5〈001〉(310) due to the high-energy barrier in the transition zone. When O atoms arrive at grain boundaries, they would stay there due to the larger solution energy and diffusion energy barrier in grain boundaries compared to that in the defect-free Fe bulk. These results indicate that O atoms would prefer to diffuse through the bulk, and oxidize grain boundaries. This study provides insight into oxidation phenomena in experiments and necessary parameters for future studies on the oxidation of steel under irradiation in nuclear reactors.
1 Introduction
Ferritic/martensitic (F/M) steel is generally applied in industries, and is a promising candidate for application as structural material in the Generation IV nuclear power.1,2 They would suffer severe oxidation corrosion when exposed to air and oxygen-controlled liquid metals or water (H2O) in high temperature. The oxidation corrosion accelerates the oxidation growth, leading to the degradation of heat conduction and the risk of the slag precipitation. Therefore, it is vital to study oxidation properties for understanding the oxidation mechanism and provide fundamental parameters for the prediction of oxidation thickness.Relevant experimental research studies have shown different constituents in oxidation on the F/M steel contact with air, oxygen-controlled liquid metals and H2O. It consists of a porous outer layer enriched in iron (Fe), dense inner layer enriched in chromium (Cr),3,4 and an internal oxidation zone (IOZ) enriched in silicon (Si) or nickel (Ni), depending on alloys in steel.5,6 One general explanation for oxidation is that oxygen (O) and Fe/alloy atoms diffuse along nano-channels that are mainly formed and grown at grain boundaries of the oxide layer.7 However, people can neither observe the migration processes of O atoms, nor the nano-channel formation in experiments. Therefore, it is necessary to study the dissolution and diffusion properties of interstitial O around the grain boundaries to explore the initial stage of oxidation formation.
The dissolution and diffusion properties of O atoms in the body-centered cubic (bcc) Fe have been explored in some theoretical simulations.8–10 In the defect-free bcc Fe, an O atom prefers the octahedral interstitial site (OCT) with a solution energy of −3.84 eV,8,9 and diffuses from the stable OCT to the nearest one with a diffusion barrier of 0.54 eV.10–13 In the vacancy-included bcc Fe, both O–Fe interaction and interstitial- or vacancy-induced volume effect result in the preference of interstitial O to occupy the off-centered site.8,9,11,12 Meanwhile, a vacancy possesses an extremely high affinity for O in bcc Fe. Therefore, it dramatically increases the energy barrier for O migration (∼80%) compared with that in defect-free Fe. The increased energy barrier makes the predicted diffusion coefficient of O in bcc-Fe in favourable accord with experiments. Besides, the effects of alloys on the solubility and diffusion of O in iron alloys were explored to investigate the picture of interstitial O diffusion in dilute ferritic iron alloys.13,14 O is known to be an embrittlement element when it is located at the grain boundary.15 However, few works consider the dissolution and diffusion properties of interstitial O atoms around grain boundaries, which have shown strong attractions to hydrogen (H), carbon (C), nitrogen (N),8,9,16–18 irradiation defects and solutes in nano-crystalline Fe.19
In this paper, we aim to acquire the dissolution and diffusion properties of interstitial O around grain boundaries with a focus on the effects of grain boundaries on the oxidation process. Based on the first-principles calculations, we first investigate the basic properties of clean grain boundaries, such as their structures and magnetic moments. Then, the solution energies of O atoms on each atomic layer are calculated to explore the dissolution properties of O around the grain boundaries. Consequently, the dissolution property is discussed via the local deformed structures, corresponding to the coordination number, distortion energy, deformation of the unit volume, and charge distribution. Finally, the diffusion property is explored by comparing the energy barriers of the O atoms in the grain boundary and transition region with that in the bulk region.
2 Computational details
2.1. Computational methods
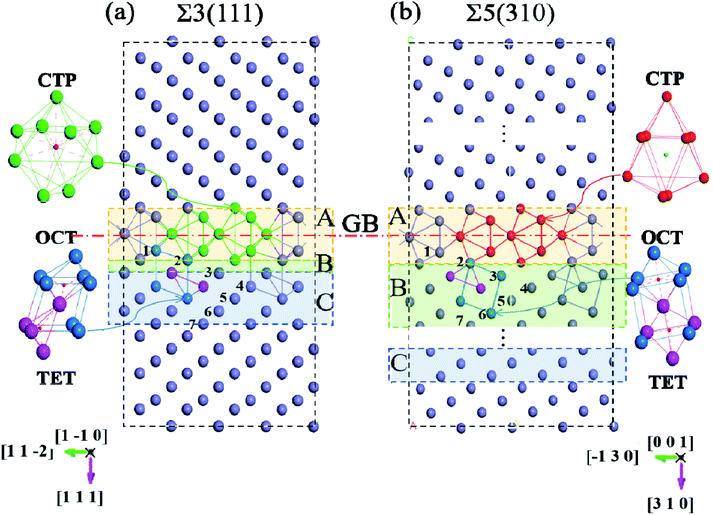
The first-principles spin-polarized calculations were carried out using density functional theory (DFT), as implemented in the Vienna Ab initio Simulation Package (VASP).20 The interaction between the ions and electrons is expressed by the projector augmented wave potential (PAW) method,21 where the 3d7 and 4s1 are treated as valence electrons for Fe. The exchange–correlation energy is described within the generalized gradient approximation (GGA) as parameterized by Perdew–Burke–Ernzerhof (PBE).22 To get the suitable models, the lattice properties of bcc-bulk Fe were first checked by optimizing a 4 × 4 × 4 super-cell containing 128 atoms with a series of tests. During the ionic relaxation, the self-consistent Kohn–Sham equations are expanded on the basis of the plane wave with a cut-off energy of 500 eV. The spin polarization is performed due to the ferromagnetism of Fe. Meanwhile, the k-point mesh is 5 × 5 × 5, and the convergence force on each atom is 0.01 eV Å−1. The equilibrium lattice constant for bcc-Fe is optimized to be 2.83 Å, which is consistent with previous experimental results23 and DFT calculations.16,24,25 Meanwhile, the vacancy formation energy calculated in bulk bcc-Fe is 2.15 eV, which is consistent with previous calculation (2.18 eV) and experiment (2.0 eV) values.26–28Based on the lattice parameter, the symmetrical tilted grain boundaries of Σ3〈110〉(111) and Σ5〈001〉(310) are constructed according to the coincidence site lattice model.29 Two grain boundaries are periodically presented in one model, as described in Fig. 1.30 The structures of these grain boundaries are described as three types of packing of polyhedrons,31 tetrahedron (TET), octahedron (OCT), and cap trigonal prism (CTP), as illustrated in Fig. 1. The volume and atoms of the grain boundary models are fully relaxed by the conjugate gradient method with k-points of 5 × 5 × 1 and the above parameters. According to the effect intensity of the grain boundaries, the structure models are divided into three areas along the direction of (111) and (310), the GB region (zone-A), transition (zone-B) and bulk-like (zone-C) region. Zone-A is mostly composed of stacks of cap trigonal prism structural units along [001]. Zone-B consists of a deformed cubic lattice, while zone-C possesses a cubic lattice as the bulk Fe. Based on the clean grain boundaries, O atoms are introduced into the grain boundary models at different zones. As shown in Fig. 1, the O atoms locate the high symmetric sites in the CTP structural unit in the grain boundary plane, while they are at the OCT and TET sites in the cubic lattice unit.
2.2. Analysis methods
The GB energy, γGB, is determined from the difference in energy between the GB-supercell and the bulk-supercell with the same number of atoms, divided by the cross section of the GB-supercell. The γGB is written as:
 | (1) |
To obtain the most stable site of the O atom around GBs, the solution energy of the O atom, EGBsol represents the energy needed for dissolving an O atom, and is calculated by the following definition:
| EGBsol = EnFe+OGB − EnFeGB − μO, | (2) |
3 Results and discussion
3.1. Basic properties of clean grain boundaries
To verify the reliability of our calculations, the grain boundary energies are first investigated for the models with different numbers of atomic layers to avoid the periodic effects of the grain boundaries. The grain boundary energies increase with increasing number of atomic layers until the atomic layers are greater than 32 for Σ3(111) and 40 for Σ5(310). Moreover, the larger model containing 60 atomic layers for Σ5(310) are also checked due to its large transition zone, as discussed later. The grain boundary energy is 1.61 J m−2 for Σ3(111) and 1.55 J m−2 for Σ5(310). These two values are consistent with previous DFT calculations.16,30,32,33 The accuracy for the calculations is also tested through different k-points sampling and cut-off energy, and the deviation in the total system energy is within 0.05 eV.The stable grain boundaries are obtained from fully relaxed configurations with lowest energies. The changes in the optimal volume and interlayer distances are consistent with previous studies.24,32 Both optimized Σ5(310) and Σ3(111) remain mirror symmetry structures with an expansion of 0.24 Å in the [310] direction and 0.30 Å in the [111] direction. The changes in the [001] and [![[1 with combining macron]](https://www.rsc.org/images/entities/char_0031_0304.gif) 30] directions for Σ5(310) and in the [
30] directions for Σ5(310) and in the [![[1 with combining macron]](https://www.rsc.org/images/entities/char_0031_0304.gif) 0] and (11
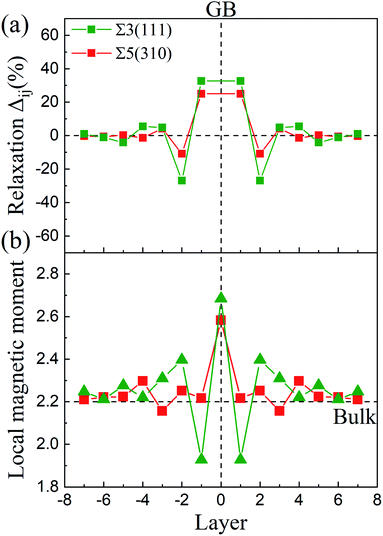
0] and (11![[2 with combining macron]](https://www.rsc.org/images/entities/char_0032_0304.gif) ) directions for Σ3(111) are negligible. The changes in the interlayer distances are defined as the percentage change in the vertical positions of the atoms of two subsequent atomic layers, i and j, in the optimized models with respect to the inter-planar distance in the bulk crystal, d, and can be written as Δij = [(dj − di) − d]/d. As shown in Fig. 2(a), the relaxations are very large for the first two layers, and show an oscillation toward the bulk layer as previous studies.32 The expansion of Δ12 is up to ∼32% for Σ3(111) and ∼25% for Σ5(310), while the contraction of Δ23 reaches ∼25% for Σ3(111) and ∼10% for Σ5(310). According to the grain boundary structure and the deformation intensity (change in the inter-planar distance), the models are divided as three regions: zone-A, zone-B and zone-C, which are shown as different colors in Fig. 1.
) directions for Σ3(111) are negligible. The changes in the interlayer distances are defined as the percentage change in the vertical positions of the atoms of two subsequent atomic layers, i and j, in the optimized models with respect to the inter-planar distance in the bulk crystal, d, and can be written as Δij = [(dj − di) − d]/d. As shown in Fig. 2(a), the relaxations are very large for the first two layers, and show an oscillation toward the bulk layer as previous studies.32 The expansion of Δ12 is up to ∼32% for Σ3(111) and ∼25% for Σ5(310), while the contraction of Δ23 reaches ∼25% for Σ3(111) and ∼10% for Σ5(310). According to the grain boundary structure and the deformation intensity (change in the inter-planar distance), the models are divided as three regions: zone-A, zone-B and zone-C, which are shown as different colors in Fig. 1.
The magnetic moments of the Fe atoms are investigated in zone-A, zone-B and zone-C. In zone-C, the magnetic moment of Fe ranges from 2.1 to 2.3 μB, corresponding well to the value of 2.2 μB for the bulk Fe atoms.24,34 For the Fe atoms on the GB plane, the magnetic moments oscillate from 2.7 μB to 1.9 μB for Σ3(111) and Σ5(310),32,35 as shown in Fig. 2(b). This can be attributed to the reason that the variety of magnetic moments depends on the change of the interlayer distance labeled in Fig. 2(a) and the local nearest neighbor atomic volume.35 The decrease in the magnetic moments (below 2.2 μB) are caused by a smaller interlayer distance than bulk, while the Fe atoms with magnetic moments above 2.2 μB possess a larger local nearest neighbor atomic volume.
3.2. Dissolution properties of interstitial oxygen in the grain boundaries
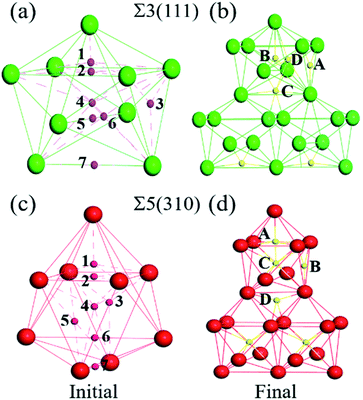
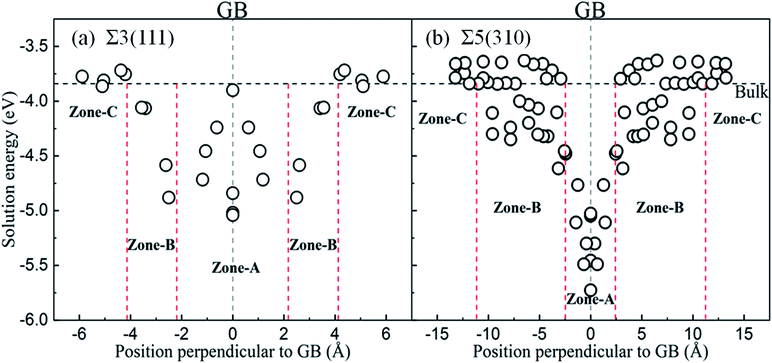
The solution energies of interstitial O atoms at different sites on each atom layer are calculated for the Σ5(310) and Σ3(111) GBs according to eqn (2) with the reference energy of an isolated O atom. In the CTP units, the considered high symmetric sites have a high possibility for O atoms, as shown in Fig. 3(a) and (c), which have been additionally monitored by molecular dynamics simulation in 10 picoseconds. In the cubic lattice, the solution energies of the O atoms at the OCT sites are always less than that at TET sites, indicating that the interstitial O atoms prefer the OCT sites to the TET sites. This is consistent with previous DFT calculations,8,9,11 which demonstrated that the solution energy of −3.84 eV at the OCT site is less than −3.33 eV at the TET site in the bulk Fe. In the case of the O2 environment, the half energy of the O2 molecule is taken as the reference to calculate the solution energies of the O atoms in iron. Considering the high temperature environment, the Helmholtz free energy of the O2 molecule is calculated by combining Vasp and Phonopy software36,37 to investigate the entropy effect on the O2 molecule. Here, we consider the dominant contribution of the ionic vibration motion and ignore the small contribution from the electron thermodynamic motion. The calculated vibrational frequency is 0.098 eV, which is consistent with the experimental results. Based on the half energy of the O2 molecule, the solution energies of the interstitial O atoms in the Fe bulk are calculated to be −1.20 eV at the OCT site and −0.69 eV at the TET site. Even at the high operational temperature of 1000 K, the solution energy of an interstitial O atom in bulk Fe is −0.87 eV at the OCT site and −0.36 eV, respectively. This indicates that the reference energy does not affect the dissolution properties of the O atoms in iron in the temperature range of 0–1000 K. Therefore, solution energies with the reference of isolated O atoms are used in later analysis, and the OCT sites are selected as the initial sites for later calculations.Fig. 4 shows the solution energies of the interstitial O atoms in the vicinity of the grain boundaries. It is clear that the solution energy in the GB region (zone-A) is less than that in the transition region (zone-B) and bulk-like region (zone-C). In this case, GB can be regarded as a sink for attracting interstitial O atoms, with different impacting ranges. Σ5(310) possesses a wider transition region and deeper sink with respect to Σ3(111). This is due to the more open structure of Σ5(310) compared to Σ3(111). The segregation energy defined by the difference between the solution energy of the O atom at GB and in bulk Fe is calculated to be −1.40 eV for Σ5(310) and −1.20 eV for Σ3(111), respectively. The segregation probability of interstitial O is considerable using McLean's model38 (more than 50 pct), and even the concentration of O is quite low. This phenomenon is also observed by the Electron Probe Micro Analysis in many experimental studies.3 This is similar to the segregation of interstitial carbon (C), sulfur (S) and phosphorus (P) atoms at the grain boundary.29,39
In zone-C, the solution energies of the interstitial O atoms are consistent with that in bulk Fe. This is because the effect of the grain boundary on the cubic lattice can be negligible. This indicates that the environment of an interstitial O is similar to that in bulk Fe, and our model is suitable for this study. However, in zone-B, the solution energies of the interstitial O atoms fluctuate, especially for the Σ5(310) model. This may be caused by a local deformed structure due to the CTP units on the grain boundaries. The cubic lattice in zone-B is deformed by the grain boundaries, especially close to the grain boundary. The deformation intensity can be described by the bond lengths between the interstitial O and host Fe, as shown in Fig. 5. It is evident that the solution energies of the O atoms decrease linearly with an increase in the bond lengths (O and 1st nearest neighbour (1NN)). This suggests that there is a stronger attraction for interstitial O with a larger distortion.
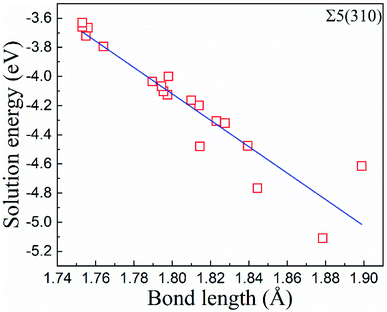 | ||
| Fig. 5 The correlation between the solution energies of the O atoms and the bond lengths between the first nearest neighbour (1NN) and the O atoms at the atomic layers. | ||
In the grain boundary region (zone-A), the O atoms at the sites considered to be high symmetry (1, 2, …, 7 shown in Fig. 3(a) and (c) and position site 8 in TET between adjacent stacks) are relaxed and finally automatically move to the final four stable sites, site-A, site-B, site-C and site-D in Fig. 3(b) and (d). These sites can be regarded as localizing in the dislocation cores described in ref. 40. The solution energy of an interstitial O at site-C (or site-D) for Σ3(111) and site-C for Σ5(310) is the lowest one. Those are consistent with the results of the most stable segregation site of the carbon atom in ref. 16. For Σ3(111), the most stable sites are site-C and site-D in the centre of the [110] orientation shown in Fig. 3(b), and the solution energy is −5.04 eV and −5.02 eV. For Σ5(310), the final solution energy of O at site-C is −5.34 eV. In addition, other sites can be regarded as meta-stable configurations, acting as a transition state or saddle point in the diffusion process. For instance, the meta-stable site-A is a saddle point for Σ3(111) GB interior migration, while site-A, -B and -D are saddle points for Σ5(310) GB interior migration. The details will be illustrated in Section 3.4.
3.3. The underlying mechanism of the dissolution of interstitial oxygen
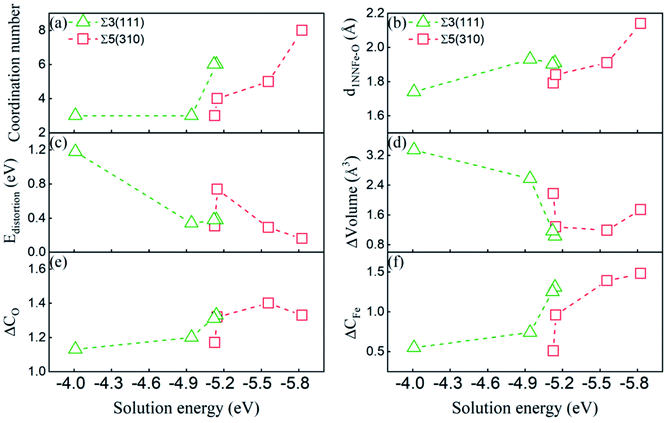
To gain insight into the dissolution properties of the interstitial O atoms in the GB region, we would explore the possible factors affecting the solution energies. As discussed above, the deformed unit structure especially near the grain boundary is different from that in the bulk bcc-Fe, where an interstitial O at the OCT site has two first nearest neighbour (1NN) and four second nearest neighbour atoms (2NN). In the deformed unit structure, the coordination number (within 2.05 Å) and bonding length of 1NN Fe–O at different high symmetry sites are modified significantly. The modifications can also be reflected by the volume variance (the difference between the volume of CTP with and without O) and distortion energy induced by O atoms. The distortion energy can be calculated by the difference of the total energy of GBs with and without the structure distortion induced by O. Those factors would illustrate the solution properties of O atoms at different sites, as reported interstitial carbon and hydrogen atoms at pure GBs in bcc Fe that the most stable sites of carbon atoms closely relate with coordination number and the 1NN Fe–carbon/hydrogen bond length.16,18 In addition, the solution energy relates to the charge transfer between the O atom and its surrounding Fe atoms.8 Therefore, the dissolution properties of O at GBs are discussed by the deformation of the unit structure relating to the coordination number of O, shortest Fe–O bond length (d1NNFe–O), volume variance (ΔVolume), distortion energy (ΔEdistortion) and charge transfer between the O and Fe atoms (gaining and losing charge, ΔCO and ΔCFe).The correlation between the deformation of CTP and solution energies has been explored, and is shown in Fig. 6. Generally, the solution energy decreases with the increase in the coordination number of the O atom, the shortest Fe–O bond length, decrease in distortion energy, and deformed volume. This indicates that both surrounding Fe atoms and large space accelerate the dissolution of the O atoms in GB, which is consistent with the dissolution properties of other light elements in GBs.15,16,18 Meanwhile, there is a lower solution energy with smaller distortion and volume change induced by O. In addition, the larger Fe–O bond length and coordination number O in Σ5(310) correspond to the lower solution energy as compared to those in Σ3(111), since the structure of Σ5(310) is more open than that of Σ3(111).
The underlying discrepancy of the solubility of interstitial O at different sites was further investigated through the electronic properties. Fig. 7(a)–(d) shows the two-dimensional projection of differential charge density distributions of O atoms at the most stable site-C in the grain boundary structural units. Furthermore, Fig. 7(e) and (f) exhibit a three-dimensional differential charge model. For Σ3(111), the electron exchange takes place in one O atom and four Fe atoms on the (111) plane, and in one O atom and two Fe atoms on the (11![[2 with combining macron]](https://www.rsc.org/images/entities/char_0032_0304.gif) ) plane in the first NN distance (Fe–O bond as 2.05 Å) range. For Σ5(310), electron exchange occurs between one O atom and two Fe atoms on the (310) and (001) planes (not shown) and four Fe atoms on the (
) plane in the first NN distance (Fe–O bond as 2.05 Å) range. For Σ5(310), electron exchange occurs between one O atom and two Fe atoms on the (310) and (001) planes (not shown) and four Fe atoms on the (![[1 with combining macron]](https://www.rsc.org/images/entities/char_0031_0304.gif) 30) plane. The electron exchange between Fe and O was further explored by Bader charge analysis.12 As we known, the outermost electrons for Fe and O are 4s13d7 and 2s2p4, respectively. The O at the most stable sites in the two grain boundaries have 7.3 electrons, and gained 1.3 electrons, while their neighbouring Fe atoms have least 7.62 and 7.74 electrons for Fe3 in Σ3(111) and Fe1 in Σ5(310), corresponding to the lost electrons of 0.38 and 0.26. The transferred charge from Fe to O in GBs is greater than 0.83 in bulk bcc-Fe,8 showing the stronger ionic character of the Fe–O interaction in GB. The character was also studied by the state density analysis of the O atoms and its adjacent Fe atoms for the two grain boundaries, as shown in Fig. 8. The electronic density of the p-state for O exhibits sharp peaks with a narrow energy range, indicating the localized charge of the O atoms. The effect of the transferred charges on the solution energy of the interstitial O atoms was investigated, and is shown in Fig. 6(e) and (f). It is clear there are lower solution energies with increasing transferred charges. This indicates that the ionic character dominates the interaction of Fe–O with the lowest solution energy. Meanwhile, the number of transferred charges (or lower solution energy) for Σ5(310) is larger than that of Σ3(111), indicating that the charge transfer or ionic bond favours the more open structure. In a word, the behaviour altering the coordination number, Fe–O charge transfer (vacancy and substitutional foreign atom), structure unit volume variance, shortest Fe–O bond length, and distortion energy (deformation) will significantly affect the solute atom convergence properties on the GB plane.
30) plane. The electron exchange between Fe and O was further explored by Bader charge analysis.12 As we known, the outermost electrons for Fe and O are 4s13d7 and 2s2p4, respectively. The O at the most stable sites in the two grain boundaries have 7.3 electrons, and gained 1.3 electrons, while their neighbouring Fe atoms have least 7.62 and 7.74 electrons for Fe3 in Σ3(111) and Fe1 in Σ5(310), corresponding to the lost electrons of 0.38 and 0.26. The transferred charge from Fe to O in GBs is greater than 0.83 in bulk bcc-Fe,8 showing the stronger ionic character of the Fe–O interaction in GB. The character was also studied by the state density analysis of the O atoms and its adjacent Fe atoms for the two grain boundaries, as shown in Fig. 8. The electronic density of the p-state for O exhibits sharp peaks with a narrow energy range, indicating the localized charge of the O atoms. The effect of the transferred charges on the solution energy of the interstitial O atoms was investigated, and is shown in Fig. 6(e) and (f). It is clear there are lower solution energies with increasing transferred charges. This indicates that the ionic character dominates the interaction of Fe–O with the lowest solution energy. Meanwhile, the number of transferred charges (or lower solution energy) for Σ5(310) is larger than that of Σ3(111), indicating that the charge transfer or ionic bond favours the more open structure. In a word, the behaviour altering the coordination number, Fe–O charge transfer (vacancy and substitutional foreign atom), structure unit volume variance, shortest Fe–O bond length, and distortion energy (deformation) will significantly affect the solute atom convergence properties on the GB plane.
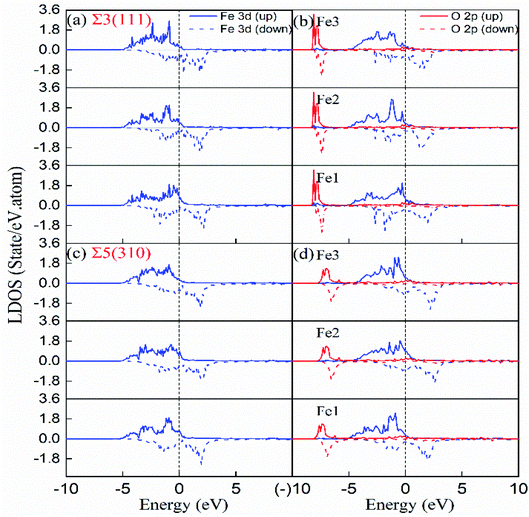 | ||
| Fig. 8 Local densities of states of interstitial O at stable site-C in the grain boundary and first NN host Fe. (a and b) Σ3(111) with and without interstitial O, (c and d) Σ5(310) with and without interstitial O. Fe1, Fe2 and Fe3 are labeled in Fig. 4(e) and (f). | ||
3.4. The diffusion properties of the interstitial oxygen atoms
Based on the above dissolution properties, the interstitial O atoms would cross the transition region and finally segregate to the GB region, where O has the lowest solution energy. How does an interstitial O migrate from the bulk-like region to the GB region? To clarify these diffusion properties, the migration energy barriers of the interstitial O atoms were investigated by the climb-NBE method11,13 in the bulk-like, transition and finally the GB region for the two grain boundaries. In zone-C and zone-B, the migration path was determined by the neighbour stable OCT sites, as previously studied.10–13 In the zone-A interior, the neighbouring most stable sites labelled in Fig. 9 are taken as the initial and final sites to determine the migration path.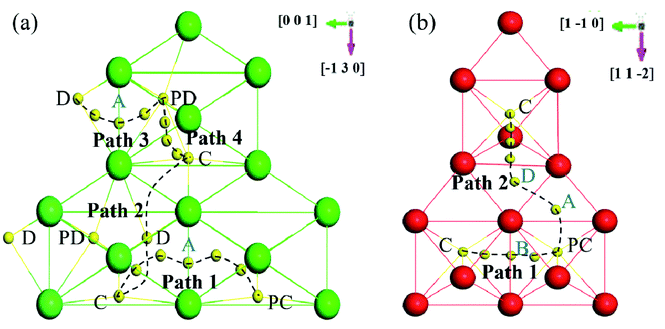 | ||
| Fig. 9 Schematic diagram of the migration paths in (a) Σ3(111) and (b) Σ5(310). The view direction is perpendicular to GB. | ||
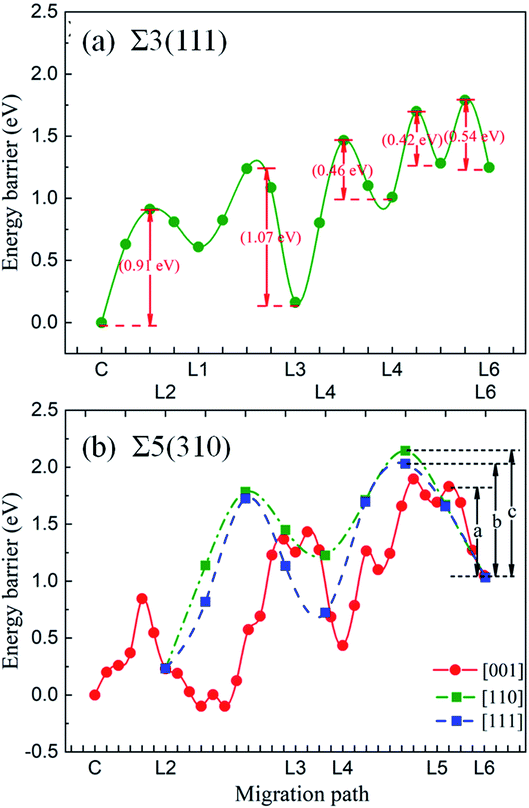
Fig. 10 shows the migration energy barriers of the interstitial O atoms in the zone-A interior and zone-C. An interstitial O in zone-C needs to overcome the energy barrier of 0.54 eV to migrate from one stable OCT site to its NN OCT site. This is consistent with the previous study in bulk Fe,10–13 indicating again that our model is large enough for this calculation. For the Σ3(111) region, there are two stable sites as site-C and site-D. Therefore, we consider four paths: from site-C to periodic site-C (path 1 and path 2), site-D to periodic site-D (path 3) and site-C to site-D (path 4). The energy barriers of the interstitial O diffusing in path 1 and path 3 are 1.10 eV and 1.07 eV in Fig. 10(a) and (b), respectively, which have good consistency. Path 2 can be regarded as containing two of path 4 with an energy barrier of 1.09 eV. For the Σ5(310) region, two migration paths of the interstitial O atom on the GB plane are considered: from the interstitial site C to the NN site C in the periodic CTP structure along path 1 ([001]) and path 2 ([001] and [![[1 with combining macron]](https://www.rsc.org/images/entities/char_0031_0304.gif) 30]). The energy barrier is 0.97 eV and 1.05 eV for path 1 and path 2, as shown in Fig. 10(d) and (e), respectively. These energy barriers are much higher than those in the defect-free Fe bulk, but comparable to that in the vacancy-induced Fe bulk.11 This means that the O atoms diffuse in the GB plane with more difficultly than in the bulk region for the defect-free Fe system, which may contribute to the smaller diffusion coefficients measured in experiments relative to the theoretical calculations with respect to the theoretical calculations.11
30]). The energy barrier is 0.97 eV and 1.05 eV for path 1 and path 2, as shown in Fig. 10(d) and (e), respectively. These energy barriers are much higher than those in the defect-free Fe bulk, but comparable to that in the vacancy-induced Fe bulk.11 This means that the O atoms diffuse in the GB plane with more difficultly than in the bulk region for the defect-free Fe system, which may contribute to the smaller diffusion coefficients measured in experiments relative to the theoretical calculations with respect to the theoretical calculations.11
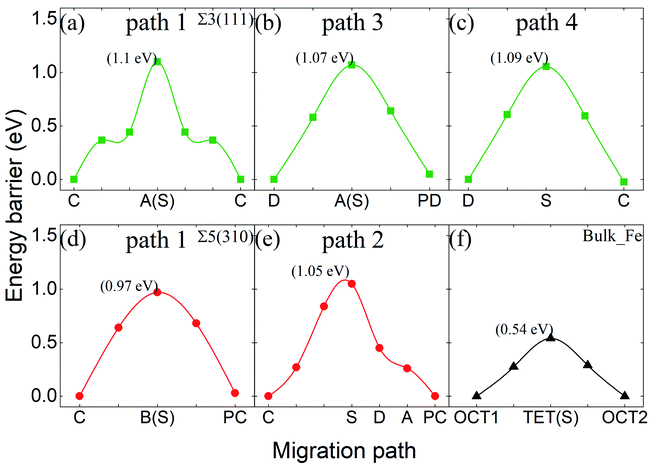 | ||
| Fig. 10 Energy barriers of interstitial O migrating in different paths in Σ3(111) (a–c), in Σ5(310) (d and e), and in bulk-like (f). | ||
The energy barriers of the O atoms crossing zone-B and approaching zone-A in the two GBs were investigated to draw the whole migration picture of the O atoms. It was found that the shortest paths in the [111] and [310] directions are not the most optimal paths. This is due to the larger energy barrier and unstable thermodynamic structure. Hence, the entire migration path can be divided into several parts with minimum energy. Fig. 11 shows the energy barriers of the O atoms in zone-B and zone-A for Σ3(111) and Σ5(310), respectively. For Σ3(111), the energy barriers of the O atoms in zone-B, 0.42 eV and 0.46 eV, are smaller than those in zone-C (0.54 eV) and zone-A (1.07 eV), indicating that the O atoms prefer to segregate to the vicinity of GBs. For Σ5(310), the transition region is wider than that for Σ3(111), and the deformation exhibits dependence on the different directions, as discussed in Section 3.2. Therefore, the diffusion paths in zone-B in the [001], [110] and [111] directions were explored, and are expressed in Fig. 11. The migration path of the interstitial O along the [001] direction has a lower energy barrier “a” of 0.78 eV, compared with that along the [111] direction (energy barrier “b” of 1.00 eV) and [110] direction (energy barrier “c” of 1.11 eV). These data indicate that for the grain boundaries with a larger transition zone range, the interstitial O atoms tend to localize in the transition zone rather than the minimum energy position in the grain boundary zone.
Generally speaking, the migration of a single O atom at the GB plane of the defect-free Fe along the rotation axis and perpendicular to the rotation axis is more strenuous than that in bulk. This phenomenon is caused by the local structures of the GBs and O–Fe ionic bonding characteristics.8 As described above, the GB region is constituted by the CTP structure. An O atom in the bulk region is easily trapped in the CTP centre with a big volume or bond length of Fe–O and strong O–Fe ionic bond strength, as discussed in Section 3.3. Meanwhile, Σ5(310) has a more open geometry than Σ3(111), leading to stronger attraction to O atoms (smaller solution energies). When it diffuses in the GB plane, it has to overcome the energy difference between one CTP and the conjunction of the neighbouring CTPs with big atomic density. Therefore, the GBs cannot be simply postulated as rapid pathways for impurities as previous reports.41 According to the Arrhenius function, the diffusion coefficient can be estimated by D ≈ d2ω × e−Ea/kBT, where d relates to the jumping distance and Ea is the migration energy barrier. ω, kB and T represent the intrinsic frequency in s−1, Boltzmann constant (8.617 × 10⁻⁵ eV K−1) and temperature in K. The diffusion coefficients of O in bulk are roughly estimated to be 2.2 and 6.1 times higher than that in the Σ3(111) and Σ5(310) planes with jumping distances of 1.6 Å and 2.8 Å, respectively. Consequently, the interstitial O tends to concentrate at the vicinity of GB in zone A or zone B. Therefore, it is easy to form oxidation in these regions. This is consistent with previous experimental observations that the IOZ growth originates in the grain boundaries.7
4 Conclusion
Using first-principles calculations, we investigate the dissolution and diffusion properties of interstitial oxygen in the body-centered-cubic iron grain boundaries, Σ3〈110〉(111) and Σ5〈001〉(310). The solution energies show that GBs have strong attraction to the O atoms, and the attraction strength depends on the factors of the coordination number, deformation of the local structure (such as Fe–O bond length, volume variance, and distortion energies) and charge distribution characters. The energy barriers of the interstitial O atoms diffusing in various paths were studied to explore their diffusion properties. The energy barriers of the interstitial O atoms diffusing in Σ3〈110〉(111) and Σ5〈001〉(310) are greater than that in the bulk region, indicating that O diffuses in GB with more difficulty than in bulk. The barrier energies of the interstitial O atoms in the transition region for Σ3〈110〉(111) are less than that in the bulk region. In contrast, for Σ5〈001〉(310), the barrier energies are greater than that in the bulk region. This indicates that the interstitial O atoms would segregate to Σ3〈110〉(111), but concentrate in the transition region around Σ5〈001〉(310), indicating the reason of oxidation accumulating at the GB region.7 This study reveals the microscopic mechanism of the oxidation corrosion of steel applied in industries, and provides parameters for the further study of oxidation corrosion under nuclear energy irradiation environment.Conflicts of interest
There are no conflicts to declare.Acknowledgements
This work was supported by the National Key Research and Development Program of China (Grant No. 2017YFE0302400, 2018YFE0308102), the National Natural Science Foundation of China (Grant No. 11735015, U1832206, 51871207, 52071314, U1967211, 51771185 and 51671185), and by the Center for Computation Science Hefei Institutes of Physical Sciences.References
- O. Yeliseyeva, V. Tsisar and G. Benamati, Corros. Sci., 2008, 50, 1672–1683 CrossRef CAS.
- E. Fauvel, C. Joussot-Dubien, V. Tanneur, S. Moussière, P. Guichardon, G. Charbit and F. Charbit, Ind. Eng. Chem. Res., 2005, 44, 8968–8971 CrossRef CAS.
- Q. Shi, J. Liu, H. Luan, Z. Yang, W. Wang, W. Yan, Y. Shan and K. Yang, J. Nucl. Mater., 2015, 457, 135–141 CrossRef CAS.
- M. P. Short, R. G. Ballinger and H. E. Hänninen, J. Nucl. Mater., 2013, 434, 259–281 CrossRef CAS.
- M. Roy, L. Martinelli, K. Ginestar, J. m. Favergeon and G. Moulin, J. Nucl. Mater., 2016, 468, 153–163 CrossRef CAS.
- C. Yao, Z. Wang, H. Zhang, H. Chang, Y. Sheng, T. Shen, Y. Zhu, L. Pang, M. Cui, K. Wei, J. Sun, T. Peng, C. liu and Z. Ma, J. Nucl. Mater., 2019, 523, 260–267 CrossRef CAS.
- E. Charalampopoulou, R. Delville, M. Verwerft, K. Lambrinou and D. Schryvers, Corros. Sci., 2019, 147, 22–31 CrossRef CAS.
- C. Barouh, T. Schuler, C.-C. Fu and M. Nastar, Phys. Rev. B: Condens. Matter Mater. Phys., 2014, 90, 054112 CrossRef.
- C. L. Fu, M. Krcmar, G. S. Painter and X. Q. Chen, Phys. Rev. Lett., 2007, 99, 225502 CrossRef CAS.
- C. Barouh, T. Schuler, C.-C. Fu and T. Jourdan, Phys. Rev. B: Condens. Matter Mater. Phys., 2015, 92, 104102 CrossRef.
- S. L. Shang, H. Z. Fang, J. Wang, C. P. Guo, Y. Wang, P. D. Jablonski, Y. Du and Z. K. Liu, Corros. Sci., 2014, 83, 94–102 CrossRef CAS.
- X. Wang, M. Posselt and J. Faßbender, Phys. Rev. B, 2018, 98, 064103 CrossRef CAS.
- X. Wang, J. Faßbender and M. Posselt, Phys. Rev. B, 2020, 101, 174107 CrossRef CAS.
- W. Ding, Z. Jiang, J. Xin, M. Zhang and M. Zheng, Phys. Chem. Chem. Phys., 2019, 21, 25735–25742 RSC.
- E. Wachowicz and A. Kiejna, Comput. Mater. Sci., 2008, 43, 736–743 CrossRef CAS.
- J. Wang, R. Janisch, G. K. H. Madsen and R. Drautz, Acta Mater., 2016, 115, 259–268 CrossRef CAS.
- X. Zhou, D. Marchand, D. L. McDowell, T. Zhu and J. Song, Phys. Rev. Lett., 2016, 116, 075502 CrossRef.
- Y. A. Du, L. Ismer, J. Rogal, T. Hickel, J. Neugebauer and R. Drautz, Phys. Rev. B: Condens. Matter Mater. Phys., 2011, 84, 144121 CrossRef.
- S. Ma and J. Zhang, Mater. Charact., 2018, 147, 43–49 CrossRef.
- G. Kresse and J. Hafner, Phys. Rev. B: Condens. Matter Mater. Phys., 1993, 47, 558–561 CrossRef CAS.
- G. Kresse and J. Furthmüller, Phys. Rev. B: Condens. Matter Mater. Phys., 1996, 54, 11169–11186 CrossRef CAS.
- J. P. Perdew, K. Burke and M. Ernzerhof, Phys. Rev. Lett., 1996, 77, 3865 CrossRef CAS.
- H. C. Herper, E. Hoffmann and P. Entel, Phys. Rev. B: Condens. Matter Mater. Phys., 1999, 60, 3839 CrossRef CAS.
- Y. Xu, C. Song, Y. Zhang, C. S. Liu, B. C. Pan and Z. Wang, Phys. Chem. Chem. Phys., 2014, 16, 16837–16845 RSC.
- Y. Zhang, Y.-W. You, D.-D. Li, Y. Xu, C. S. Liu, B. C. Pan and Z. Wang, Phys. Chem. Chem. Phys., 2015, 17, 12292–12298 RSC.
- S.-L. Shang, B.-C. Zhou, W. Y. Wang, A. J. Ross, X. L. Liu, Y.-J. Hu, H.-Z. Fang, Y. Wang and Z.-K. Liu, Acta Mater., 2016, 109, 128–141 CrossRef CAS.
- P. J. P. Ehrhart, H. Schultz and H. Ullmaier, Atomic Defects in Metals, Springer-Verlag, Berlin, 1991 Search PubMed.
- T. He, Y. Jiang, R. Zhou and J. Feng, RSC Adv., 2016, 6, 45250–45258 RSC.
- V. Randle, The Role of Coincidence Site Lattice in Grain Boundary Engineering, Springer-Verlag Berlin Heidelberg, 2nd edn, 2014 Search PubMed.
- Y.-J. Hu, Y. Wang, W. Y. Wang, K. A. Darling, L. J. Kecskes and Z.-K. Liu, Comput. Mater. Sci., 2020, 171, 109271 CrossRef CAS.
- M. F. Ashby, F. Spaepen and S. Williams, Acta Metall., 1978, 26, 1647–1663 CrossRef CAS.
- E. Wachowicz, T. Ossowski and A. Kiejna, Phys. Rev. B: Condens. Matter Mater. Phys., 2010, 81, 094104 CrossRef.
- E. Hristova, R. Janisch, R. Drautz and A. Hartmaier, Comput. Mater. Sci., 2011, 50, 1088–1096 CrossRef CAS.
- P. Blonski and A. Kiejna, Surf. Sci., 2007, 601, 123–133 CrossRef CAS.
- M. Čák, M. Šob and J. Hafner, Phys. Rev. B: Condens. Matter Mater. Phys., 2008, 78, 054418 CrossRef.
- A. Togo and I. Tanaka, Scr. Mater., 2015, 108, 1–5 CrossRef CAS.
- A. Togo, F. Oba and I. Tanaka, Phys. Rev. B: Condens. Matter Mater. Phys., 2008, 78, 134106 CrossRef.
- M. Yamaguchi, Metall. Mater. Trans. A, 2010, 42, 319–329 CrossRef.
- M. Yamaguchi, Y. Nishiyama and H. Kaburaki, Phys. Rev. B: Condens. Matter Mater. Phys., 2007, 76, 035418 CrossRef.
- X. Zhou, N. Mousseau and J. Song, Phys. Rev. Lett., 2019, 122, 215501 CrossRef CAS.
- O. A. Restrepo, N. Mousseau, M. Trochet, F. El-Mellouhi, O. Bouhali and C. S. Becquart, Phys. Rev. B, 2018, 97, 054309 CrossRef.
| This journal is © The Royal Society of Chemistry 2021 |

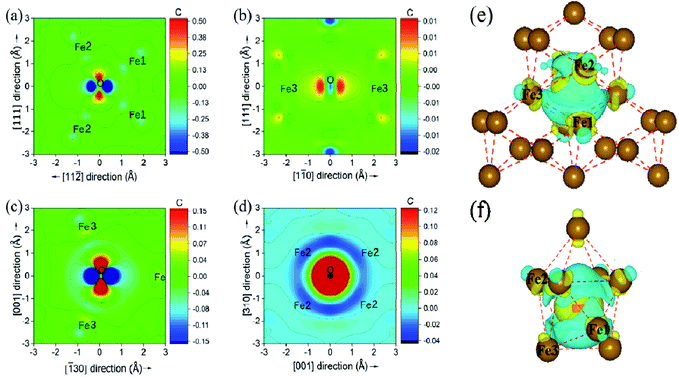
![[3 with combining macron]](https://www.rsc.org/images/entities/char_0033_0304.gif) 0) (d). (e) and (f) show the three-dimensional differential charge distribution models for Σ3(111) and Σ5(310), respectively. Fe1, Fe2 and Fe3 are three types of first NN host Fe.
0) (d). (e) and (f) show the three-dimensional differential charge distribution models for Σ3(111) and Σ5(310), respectively. Fe1, Fe2 and Fe3 are three types of first NN host Fe.