 Open Access Article
A comparison study of MnO2 and Mn2O3 as zinc-ion battery cathodes: an experimental and computational investigation†
Hongyuan Shen‡
 *a,
Binbin Liu‡b,
Zanxiang Niec,
Zixuan Lib,
Shunyu Jind,
Yuan Huange and
Hang Zhou
 b
b
aCollege of Information Science and Engineering, Northeastern University, Shenyang, PR China. E-mail: shenhongyuan@ise.neu.edu.cn
bSchool of Electronic and Computer Engineering, Peking University Shenzhen Graduate School, Shenzhen, 518055, PR China
cZinergy Shenzhen Ltd., Floor 6, Building H, Gangzhilong Science Park, Longhua, Shenzhen, 518109, PR China
dCenter for Micro- and Nanoscale Research and Fabrication, University of Science and Technology of China, Hefei, 23000, PR China
eSchool of Microelectronics Science and Technology, Sun Yat-Sen University, Guangzhou, PR China
First published on 19th April 2021
Abstract
The high specific capacity, low cost and environmental friendliness make manganese dioxide materials promising cathode materials for zinc-ion batteries (ZIBs). In order to understand the difference between the electrochemical behavior of manganese dioxide materials with different valence states, i.e., Mn(III) and Mn(IV), we investigated and compared the electrochemical properties of pure MnO2 and Mn2O3 as ZIB cathodes via a combined experimental and computational approach. The MnO2 electrode showed a higher discharging capacity (270.4 mA h g−1 at 0.1 A g−1) and a superior rate performance (125.7 mA h g−1 at 3 A g−1) than the Mn2O3 electrode (188.2 mA h g−1 at 0.1 A g−1 and 87 mA h g−1 at 3 A g−1, respectively). The superior performance of the MnO2 electrode was ascribed to its higher specific surface area, higher electronic conductivity and lower diffusion barrier of Zn2+ compared to the Mn2O3 electrode. This study provides a detailed picture of the diversity of manganese dioxide electrodes as ZIB cathodes.
1. Introduction
In recent years, zinc-ion batteries (ZIBs) have received significant attention because Zn is naturally abundant, and ZIB devices, which are based on an aqueous electrolyte, are safer and more environmentally friendly compared to lithium-ion batteries.1–4 Manganese dioxide materials are considered as promising candidates for cathode materials for ZIBs.5–14 This is due to their high specific capacity, low cost, and environmental friendliness.3 The studies available on manganese dioxide cathodes for ZIBs mainly focus on MnO2,15–18 Mn2O3,19 Mn3O4 (ref. 9 and 20) or mixed-valence manganese dioxide containing multiple phases.3,21 For instance, Fu et al. synthesized porous MnOx (Mn(IV) and Mn(II)) nanorods with N-doped carbon by the metal–organic framework method as a new cathode for ZIBs.21 These ZIBs delivered a relatively high specific capacity of 385 mA h g−1 after 120 cycles. The composite cathodes showed excellent rate performance and good cycle retention.In our previous study, we utilized MnOx/polypyrrole (PPy) composites containing Mn(III) and Mn(IV) phases as Zn intercalation host cathodes in aqueous ZIBs.3 The electrochemical properties of the MnOx/PPy electrode were fairly sensitive to the amount of manganese dioxides phases, i.e., Mn(III) and Mn(IV). This inspired us to explore the difference between the electrochemical performance of manganese dioxides with Mn(III) phase and Mn(IV) phase as well as the contribution of the different phases to the electrochemical properties of the mixed-valence MnOx electrode. However, the mixed-valence MnOx electrode is composited with other additives (i.e., PPy), and possible contributions from multiple factors make it difficult to identify the role of each phase. In addition, a few factors (e.g., the diffusion barrier of Zn2+) that cannot be directly confirmed by experimental means are often ignored, leading to an incomplete analysis. It has been reported that density functional theory (DFT) can be used to simulate the diffusion barrier of Zn2+ in cathode materials. Thus, in order to understand and reveal the underlying mechanisms, it is necessary to adopt the related computational methods, and combine the theoretical predictions with the experimental results.
In this study, we investigated and compared the electrochemical properties of pure MnO2 and Mn2O3 as ZIB cathodes via a combined experimental and computational study. While manganese dioxides containing Mn(III) and Mn(IV) phases in mixed-valence MnOx are often more complex than those presented in this study, an understanding of the basic behavior of the component materials can be helpful in interpreting the behavior of related systems. This study, in combination with our previous work on MnOx/PPy composites containing Mn(III) and Mn(IV) phases, provides a detailed picture of the diversity of manganese dioxide electrodes.
2. Experimental
2.1 Preparation of MnO2 and Mn2O3 cathode
The α-MnO2 powder was prepared by a hydrothermal method.22 0.1264 g of potassium permanganate, 0.0428 g of (NH4)2SO4, and 40 mL of distilled water were added to a Teflon-lined reactor and mixed, and then, treated hydrothermally at 140 °C for 24 h. Then, the resulting powder was filtered by an aqueous filter paper (JINTENG, with a pore size of 200 nm), and washed using distilled water, and dried at 70 °C for 4 h. The as-obtained α-MnO2 powder was then annealed at 300 °C for 1 h.The α-Mn2O3 powder (CAS No. 1317-34-6) was purchased from Xiya Chemical Industry Company. Super P (conductive additive), with the size of ∼40 nm, was purchased from TIMCAL from Switzerland.
To prepare the MnO2 cathode, 70 wt% of MnO2 powder, 20 wt% of Super P, and 10 wt% of polyvinylidene fluoride (PVDF) was dispersed in N-methyl-pyrrolidone (NMP), and stirred for 4 h. Then, the mixed slurry was coated onto a carbon cloth and dried at 70 °C for 6 h. The Mn2O3 cathode was prepared by the same process. The mass loading of the active mass (MnO2 or Mn2O3) was ∼2 mg cm−2, and the geometrical electrode area was ∼1.54 cm2.
2.2 Material characterization
Scanning electron microscopy (SEM, ZEISS SUPRA, Carl Zeiss) was performed to observe the surface morphology of the materials. X-ray powder diffraction (XRD) patterns were recorded using a Bruker X-ray diffractometer (D8 Advance). Nitrogen adsorption/desorption isotherms and pore-size distributions were collected with an accelerated surface-area and porosimetry system (ASAP 2020 HD88).2.3 Electrochemical characterization
A full battery was assembled from a cathode (MnO2 or Mn2O3), an anode (Zn foil) and a separator (NKK separator) in a solution of 2 M ZnSO4 + 0.1 M MnSO4. The cyclic voltammetry (CV) and electrochemical impedance spectroscopy (EIS) were conducted on an electrochemical workstation (CHI 660e, Shanghai CH Instrument Co., Ltd.) using the full batteries. The CV spectra were recorded within a potential range of 1.0 to 1.9 V vs. Zn/Zn2+ at a scan rate at 0.5 mV s−1. The EIS spectra were recorded in a frequency range from 0.01 to 105 Hz after charging to ∼1.9 V vs. Zn2+/Zn. The galvanostatic charge/discharge tests were conducted in a potential range from 1.0 to 1.9 V vs. Zn/Zn2+ using a Land test system (CT2001A, Wuhan Land Electronic Co., Ltd.).2.4 Computational method and models
All calculations were carried out using the projector augmented wave method in the framework of the DFT,23 as implemented in the Cambridge Serial Total Energy Package (CASTEP).24 The generalized gradient approximation (GGA) and Perdew–Burke–Ernzerhof (PBE) exchange functional23 were used. The plane-wave energy cutoff was set to 500 eV, and the Monkhorst–Pack method25 was employed for the Brillouin zone sampling. The Monkhorst–Pack method with 3 × 3 × 3 and 3 × 3 × 5 k-point meshes were employed for the Brillouin zone sampling of the α-Mn2O3 unit cell and α-MnO2 1 × 1 × 2 supercell. The convergence criteria of energy and force calculations were set to 10−5 eV per atom and 0.01 eV Å−1, respectively. The Zn-inserted α-MnO2 structure was built as a 1 × 1 × 2 supercell with a Zn atom at the hollow site.26 For Mn2O3, two different types of adjacent interstitial sites were considered for Zn insertion, namely the tetrahedral and octahedral sites. The linear synchronous transition and quadratic synchronous transition methods27 implemented in the CASTEP were used to calculate the energy landscape and activation energy barrier of the Zn diffusion in α-MnO2 and Mn2O3.3. Results and discussion
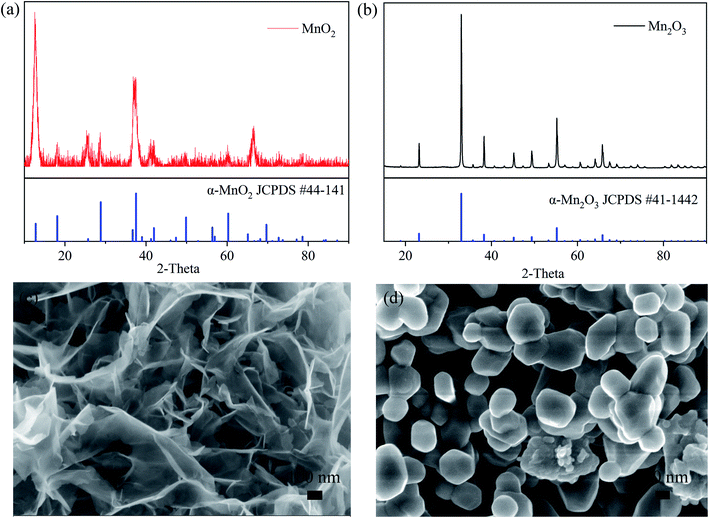
The crystal structures and morphologies of the MnO2 and Mn2O3 powders were measured by XRD and SEM. The XRD characterization, as shown in Fig. 1(a) and (b), shows that the Bragg peaks can be indexed to the crystalline phases of α-MnO2 (JCPDS: 44-0141) in Fig. 1(a) and α-Mn2O3 (JCPDS: 41-1442) in Fig. 1(b). The morphology of the α-MnO2 powder, as shown in Fig. 1(c), can be described as nanosheets with lengths and width in the micrometer scale and thickness in less than tens of nanometers. On the other hand, the morphology of α-Mn2O3, as shown in the SEM image in Fig. 1(d), consisted of nanoparticles of size in the range of hundreds of nanometers.The specific surface area and the pore size distribution of the electrode materials play an important role in ion transport, which has been confirmed by previous studies on batteries.4 Herein, the microporous structure of the MnO2 and Mn2O3 electrodes was confirmed by N2 adsorption–desorption isotherms and was found to be a typical type-IV isotherm (Fig. 2). The specific surface area of the MnO2 electrode (61.9 m2 g−1) was much greater than that of the Mn2O3 electrode (10.6 m2 g−1), resulting in faster ion diffusion between the electrolyte and MnO2. It is worth noting that the pore diameter distribution of the MnO2 electrode was mainly located between 1 and 7 nm, and the pore volume was 0.44 cm3 g−1. Comparatively, the pore diameter distribution of the Mn2O3 electrode lay mainly in the range of 20–50 nm, and the pore volume was 0.14 cm3 g−1. Large numbers of micropores provided more sites for Zn2+ storage, and an appropriate pore size distribution could improve the transport of Zn2+, resulting in a high-rate performance.
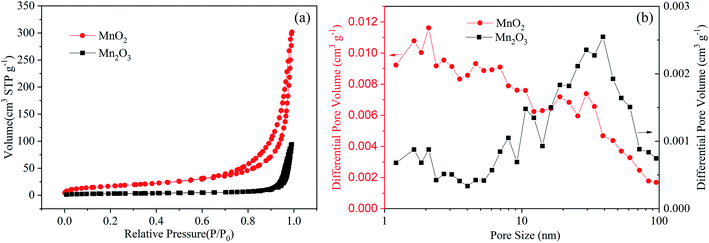 | ||
| Fig. 2 (a) Nitrogen adsorption/desorption isotherms of the MnO2 and Mn2O3 electrodes. (b) Pore size distributions of the MnO2 and Mn2O3 electrodes. | ||
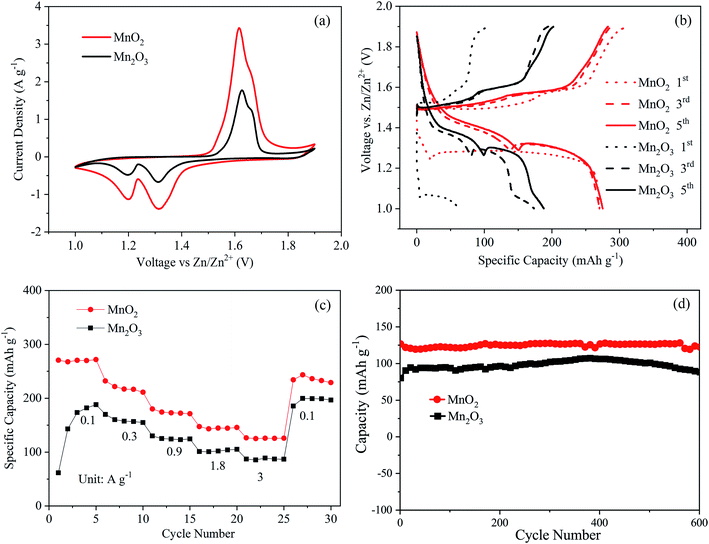
In order to compare the electrochemical performance of the MnO2 and Mn2O3 electrodes, Zn–MnO2 and Zn–Mn2O3 batteries were assembled with a Zn foil anode in an aqueous electrolyte containing 2 M ZnSO4 and 0.1 M MnSO4. Fig. 3(a) shows the cyclic voltammogram of the Zn–MnO2 and Zn–Mn2O3 batteries at a scan rate of 0.5 mV s−1 in the voltage range of 1.0–1.9 V vs. Zn2+/Zn. For the Mn2O3 cathode, two separate reversible redox peaks, i.e., reduction peaks at 1.20 and 1.32 V, and oxidation peaks at 1.63 and 1.66 V, were observed, corresponding to a two-step reaction. In comparison, the CV curve of the MnO2 cathode showed that two similar reduction peaks occurred, while the oxidation peaks merged into a broad peak at 1.62 V. It is worth noting that the Mn2O3 electrode showed much lower peaks than those of the MnO2 electrode, indicating that the Mn2O3 electrode had a lower capacity than the MnO2 electrode.
Fig. 3(b) shows the first, third, and fifth charging and discharging profiles of the MnO2 and Mn2O3 electrodes at a low current density of 0.1 A g−1. In the first cycle, the Mn2O3 electrode delivered a low discharge capacity of 61.1 mA h g−1. The capacities at the third and fifth cycles increased to 173.5 and 188.2 mA h g−1, respectively. The increased capacity of the Mn2O3 electrode at 0.1 A g−1 can be assigned to the gradual activation of electrodes. In comparison, the MnO2 electrode showed higher and more stable capacities at the first, third, and fifth cycles. The capacities of the MnO2 electrode at the first, third, and fifth cycles were 270.6, 270.4, and 271.7 mA h g−1, respectively. Both electrodes presented similar discharge plateaus, which can be attributed to the consequent H+ and Zn2+ insertion processes.28
Fig. 3(c) shows the comparison of the rate performance of the MnO2 and Mn2O3 electrodes. Again, the MnO2 electrode exhibited a better rate capability than the Mn2O3 electrode. For instance, the MnO2 electrode could deliver a discharge capacity of 270.4 mA h g−1 at a low current density of 0.1 A g−1. When the discharge current density increased to higher values, such as 1.8 and 3.0 A g−1, the discharge capacities were maintained at ∼144.6 and ∼125.7 mA h g−1, respectively. In comparison, the Mn2O3 electrode exhibited a much lower discharging capacity, i.e., ∼102.0 mA h g−1 at 1.8 A g−1 and ∼87 mA h g−1 at 3.0 A g−1. The cycling performances of the MnO2 and Mn2O3 electrodes are presented in Fig. 3(d). The MnO2 and Mn2O3 electrodes showed around 96% and 93% capacity retention after 600 cycles, respectively, indicating their excellent cycling performance.
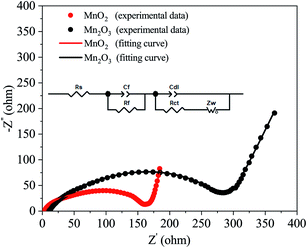
To obtain a better understanding of the difference between the MnO2 and Mn2O3 electrodes, electrochemical impedance spectroscopy (EIS) measurements were carried out after charging to ∼1.9 V vs. Zn2+/Zn. The Nyquist plots are shown in Fig. 4. An appropriate equivalent circuit model (inset in Fig. 4) was established to fit the Nyquist curves. The electrical parameters in this model, namely the ohmic series resistance (Rs), the surface film resistance (Rf), and the charge transfer resistance (Rct), were calculated. The values of Rs and Rct of the MnO2 electrode were much smaller than those of the Mn2O3 electrode, resulting in a much better rate performance for the MnO2 electrode (Fig. 3(c) and Table 1).
| Rs (Ω) | Rf (Ω) | Rct (Ω) | |
|---|---|---|---|
| MnO2 | 3.2 | 129.5 | 35.1 |
| Mn2O3 | 10.3 | 210.2 | 72.9 |
The diffusion barrier of Zn2+ in the cathode is also another important factor affecting the electrochemical performance. Since it is challenging to experimentally measure the diffusion barrier of Zn2+ in mixed manganese oxides, DFT was used to simulate the diffusion barrier of Zn2+ in MnO2 and Mn2O3. The corresponding diffusion pathways are shown in Fig. 5(a) and (b), and the calculated energy profile is displayed in Fig. 5(c) and (d). As shown in Fig. 5(a), the Zn2+-inserted into the α-MnO2 structure was built as a 1 × 1 × 2 supercell with the Zn atom at the hollow site.26 The calculated energy barrier for the migration of Zn2+ in the α-MnO2 structure was 0.497 eV (Fig. 5(c)). For Mn2O3, two different kinds of adjacent interstitial sites were considered for the Zn2+ insertion, namely the tetrahedral and octahedral sites. The calculated migration energy barrier for Zn2+ in the α-Mn2O3 structure was 1.989 eV (Fig. 5(d)). The migration energy barrier for Zn2+ in α-MnO2 was found to be much lower than that in α-Mn2O3, indicating that Zn2+ can migrate more easily in α-MnO2. The lower-energy barriers endowed Zn–MnO2 batteries with faster electrochemical kinetics than Zn–Mn2O3 batteries.
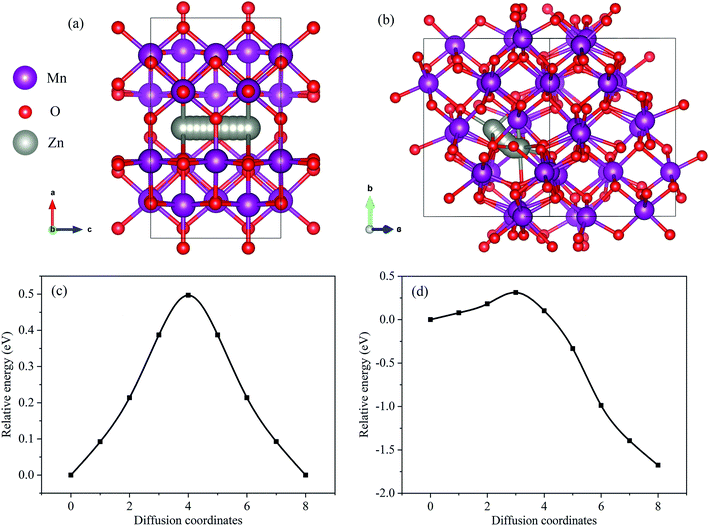 | ||
| Fig. 5 (a) Zn diffusion pathway in MnO2. (b) Zn diffusion pathway in Mn2O3. (c) The energy landscapes of Zn diffusion in MnO2. (d) The energy landscapes of Zn diffusion in Mn2O3. | ||
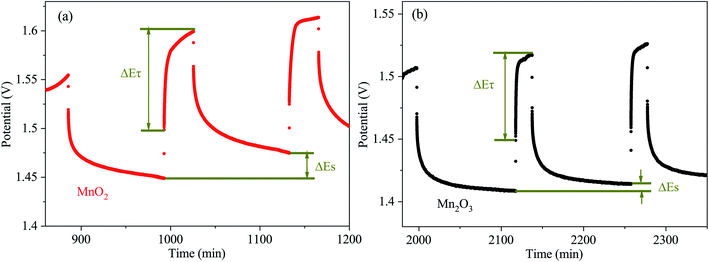
In order to obtain the Zn2+ diffusion coefficient of the MnO2 and Mn2O3 electrodes, the galvanostatic intermittent titration technique (GITT) was conducted. The GITT was measured at a 0.03 A g−1 pulse current for 20 min (τ) and relaxed for 120 min (Fig. 6). The diffusion coefficient of Zn2+ (DZn2+, cm2 s−1) was calculated as:29
As calculated, the Zn2+ diffusion coefficient of the MnO2 electrode was 3.05 × 10⁻⁸ cm2 s−1, which was higher than that of the Mn2O3 electrode (3.42 × 10⁻⁹ cm2 s−1). The results prove the lower Zn2+ diffusion barrier for MnO2 than that of Mn2O3, which is consistent with the computational study.
Based on the above-mentioned results, the MnO2 electrode showed superior electrochemical properties, i.e., higher specific capacity and better rate performance than the Mn2O3 electrode. The reaction mechanism for MnO2 has been reported previously that the MnO2 cathode experiences a consequent H+ and Zn2+ insertion/extraction process during the discharging/charging.28 In order to reveal the structural reaction mechanism of the Mn2O3 electrode, ex situ XRD was carried out in numerous discharging/charging states of the Mn2O3 electrode, as shown in Fig. S1 (ESI†). The ex situ results indicated that the energy storage mechanism of the Mn2O3 electrode also involved H+ and Zn2+ insertion/extraction. The superior electrochemical properties of the MnO2 electrode were ascribed to the following reasons: (i) the α-MnO2 electrode had a higher electronic conductivity, as evidenced in the decreased charge transfer resistance (Fig. 4), and (ii) the MnO2 electrode possessed a higher specific surface area (61.9 m2 g−1 for the MnO2 electrode vs. 10.6 m2 g−1 for the Mn2O3 electrode), which increased the contact area between the electrode and electrolyte, therefore facilitating the Zn2+ insertion process. Moreover, the lower-energy barriers endowed the Zn–MnO2 batteries with faster electrochemical kinetics. All of these merits contributed to the superior electrochemical performance of the Zn–MnO2 batteries. It is worth noting that the results also provided an explanation for the lower specific capacity of MnOx/PPy composites, which contained a higher Mn(III) phase/Mn(IV) phase ratio, as reported in our previous study.3
4. Conclusion
We investigated and compared the electrochemical properties of pure α-MnO2 and α-Mn2O3 as ZIB cathodes via a combined experimental and computational study. We demonstrated that the α-MnO2 electrode possessed a higher specific surface area, higher electronic conductivity, and lower diffusion barrier for Zn2+ than that observed in the case of the α-Mn2O3 electrode. As a result, the discharging capacity at 0.1 A g−1 was higher for the α-MnO2 electrode (270.4 mA h g−1) than for the α-Mn2O3 electrode (188.2 mA h g−1). In addition, α-MnO2 showed a better rate performance (125.7 mA h g−1 at 3 A g−1) than α-Mn2O3 (87 mA h g−1 at 3 A g−1). This study provides an insight into the electrochemical mechanisms of manganese dioxide-based systems, which can be used to interpret behavior seen in Mn(III)- and Mn(IV)-based phases.Conflicts of interest
There are no conflicts to declare.Acknowledgements
This work was financially supported by the Shenzhen Science and Technology Program (Grant No. GJHZ20190820091203667, and No. KQTD20190929172522248) and the Program for Guangdong Introducing Innovative and Enterpreneurial Teams (2019ZT08Z656). Technical support from Tsinghua Shenzhen International Graduate School Materials and Devices Testing Center is gratefully acknowledged.References
- Y. Li, J. Fu, C. Zhong, T. Wu, Z. Chen, W. Hu and J. Lu, Adv. Energy Mater., 2019, 9, 1802605 CrossRef.
- P. Yu, Y. Zeng, H. Zhang, M. Yu, Y. Tong and X. Lu, Small, 2019, 15, 1804760 CrossRef.
- Z. Li, Y. Huang, J. Zhang, S. Jin, S. Zhang and H. Zhou, Nanoscale, 2020, 12, 4150–4158 RSC.
- Y. Huang, Z. Li, S. Jin, S. Zhang, H. Wang, P. Hiralal, G. A. J. Amaratunga and H. Zhou, Carbon, 2020, 167, 431–438 CrossRef CAS.
- K. Wang, X. Zhang, J. Han, X. Zhang, X. Sun, C. Li and Y. Ma, ACS Appl. Mater. Interfaces, 2018, 10, 24573–24582 CrossRef CAS PubMed.
- M. Alfaruqi, S. Islam, V. Mathew, J. Song, S. Kim, D. Tung and J. Kim, Appl. Surf. Sci., 2017, 404, 435–442 CrossRef CAS.
- C. Wang, M. Wang, Z. He, L. Liu and Y. Huang, ACS Appl. Mater. Interfaces, 2020, 3, 1742–1748 CAS.
- D. Wang, L. Wang, G. Liang, H. Li, Z. Liu, Z. Tang and C. Zhi, ACS Nano, 2019, 13, 10643–10652 CrossRef CAS PubMed.
- C. Zhu, G. Fang, J. Zhou, J. Guo, Z. Wang, C. Wang and S. Liang, J. Mater. Chem. A, 2018, 6, 9677–9683 RSC.
- W. Qiu, L. Yu, Y. Ao, Z. Zhang, G. Li and X. Lu, J. Mater. Chem. A, 2017, 5, 14838–14846 RSC.
- N. Palaniyandy, M. Kebede, K. Raju, K. Ozoemena, L. le Roux, M. Mathe and R. Jayaprakasam, Mater. Chem. Phys., 2019, 230, 258–266 CrossRef CAS.
- T. Xiong, Y. Zhang, W. S. V. Lee and J. Xue, Adv. Energy Mater., 2020, 10, 2001769 CrossRef CAS.
- T. Xiong, Z. G. Yu, H. Wu, Y. Du, Q. Xie, J. Chen, Y.-W. Zhang, S. J. Pennycook, W. S. V. Lee and J. Xue, Adv. Energy Mater., 2019, 9, 1803815 CrossRef.
- W. Shi, W. S. V. Lee and J. Xue, ChemSusChem, 2021, 14, 1–26 CrossRef.
- H. Pan, Y. Shao, P. Yan, Y. Cheng, K. Han, Z. Nie, C. Wang, J. Yang, X. Li, P. Bhattachary, K. T. Mueller and J. Liu, Nat. Energy, 2016, 1, 16039 CrossRef CAS.
- N. Palaniyandy, M. Kebede, K. Raju, K. Ozoemena, L. le Roux, M. Mathe and R. Jayaprakasam, Mater. Chem. Phys., 2019, 230, 258–266 CrossRef CAS.
- B. Wu, G. Zhang, M. Yan, T. Xiong, P. He, L. He and L. Mai, Small, 2018, 14, 1703850 CrossRef PubMed.
- S. Khamsanga, M. T. Nguyen, T. Yonezawa, P. Thamyongkit, R. Pornprasertsuk, P. Pattananuwat, A. Tuantranont, S. Siwamogsatham and S. Kheawhom, Int. J. Mol. Sci., 2020, 21, 4689 CrossRef CAS PubMed.
- B. Jiang, C. Xu, C. Wu, L. Dong, J. Li and F. Kang, Electrochim. Acta, 2017, 229, 422–438 CrossRef CAS.
- J. Hao, J. Mou, J. Zhang, L. Dong, W. Liu, C. Xu and F. Kang, Electrochim. Acta, 2018, 259, 170–178 CrossRef CAS.
- Y. Fu, Q. Wei, G. Zhang, X. Wang, J. Zhang, Y. Hu and S. Sun, Adv. Energy Mater., 2018, 8, 1801445 CrossRef.
- B. Lee, H. R. Lee, H. Kim, K. Y. Chung, B. W. Cho and S. H. Oh, Chem. Commun., 2015, 51, 9265–9268 RSC.
- W. Kohn and L. J. Sham, Phys. Rev., 1965, 140, A1133–A1138 CrossRef.
- S. J. Clark, M. D. Segall, C. J. Pickard, P. J. Hasnip, M. I. J. Probert, K. Refson and M. C. Payne, Z. Kristallogr. - Cryst. Mater., 2005, 220(5/6), 567–570 CrossRef CAS.
- H. J. Monkhorst and J. D. Pack, Phys. Rev. B: Solid State, 1976, 13, 5188–5192 CrossRef.
- B. Lee, C. S. Yoon, H. R. Lee, K. Y. Chung, B. W. Cho and S. H. Oh, Sci. Rep., 2014, 4, 6066 CrossRef CAS PubMed.
- N. Govind, M. Petersen, G. Fitzgerald, D. King-Smith and J. Andzelm, Comput. Mater. Sci., 2003, 28, 250–258 CrossRef CAS.
- W. Sun, F. Wang and S. Hou, J. Am. Chem. Soc., 2017, 139, 9775–9778 CrossRef CAS.
- D. Zhang, J. Cao, X. Zhang, N. Insin, S. Wang, J. Han and Y. Huang, Adv. Funct. Mater., 2021, 2009412 CrossRef CAS.
Footnotes |
| † Electronic supplementary information (ESI) available. See DOI: 10.1039/d1ra00346a |
| ‡ These authors contributed equally to this work. |
| This journal is © The Royal Society of Chemistry 2021 |

