
 Open Access Article
 This Open Access Article is licensed under a Creative Commons Attribution-Non Commercial 3.0 Unported Licence
Terephthalate and trimesate metal–organic frameworks of Mn, Co, and Ni: exploring photostability by spectroscopy†
Nishesh Kumar
Gupta
ab,
Jiyeol
Bae
b,
Suho
Kim
ab and
Kwang Soo
Kim
 *ab
*ab
aUniversity of Science and Technology (UST), Daejeon, Republic of Korea
bDepartment of Land, Water, and Environment Research, Korea Institute of Civil Engineering and Building Technology (KICT), Goyang, Republic of Korea. E-mail: kskim@kict.re.kr
First published on 1st March 2021
Abstract
We report a rapid synthesis for the fabrication of terephthalate and trimesate metal–organic frameworks (MOFs) of Mn, Co, and Ni by ultrasonication of organic linkers with freshly prepared metal hydroxides. The MOFs were characterized by various microscopic and spectroscopic techniques to understand their structural, functional, and optical properties. MOFs with low bandgap energy (1.88–2.73 eV) showed strong absorbance in the UV-visible range. MOFs were exposed to UV irradiation for 40 h to understand their photostability. The MOFs showed decreased surface area and porosity with CoBTC as an exception. PXRD was less convincing for exploring functional changes in the UV-irradiated MOFs. XPS predicted changes in the oxidation states of metal nodes, the degradation of the organic linkers, and decarboxylation process in many of the transition MOFs. The study predicted terephthalate-based MOFs as more photostable than corresponding trimesate-based MOFs. This study is one of the first attempts in exploring photostability of MOFs with Mn, Co, and Ni as nodes.
1. Introduction
Metal–organic frameworks (MOFs) are crystalline inorganic–organic hybrid polymers generated by the coordination of metal nodes and organic linkers. The flexibility in the structure makes it possible to design thousands of MOFs by varying metal cations and linkers.1,2 Though MOFs are largely explored for gas capture, storage, transport, and delivery,3 they have found numerous applications in the field of energy conversion, photocatalysis, and sensing.4 Transition metals have a special significance in the field of photocatalysis and energy conversion by harnessing solar light.5 Since transition metals are active under the solar spectrum, their respective MOFs are expected to inherit the same traits or even better optical properties due to the presence of organic linkers. The localized excited state of the organic linker generated by the photon absorption decays by transferring an electron to the metal node.6 The efficacy of such electron transfer reactions are dependent on the redox state of metal ions and for that transition metal ions are suitable. The favourable orbital overlapping of organic linkers and transition metal nodes promotes a fast and efficient generation of a charge-separated state for redox reactions.7,8MOFs of transition metals have been constructed for photocatalytic degradation of pollutants, solar water splitting, CO2 reduction, and solar-light driven chemical transformations.9 MOFs with Co, Mn, and Ni are finding applications in electrochemical energy storage,10 catalytic degradation,11 and separation.12 Owing to visible light response and excellent redox behavior, these MOF photocatalysts are being explored for CO2 reduction, solar water splitting, photoreduction, photochemical transformations of small molecules, and photocatalytic degradation of organic pollutants.13–19 One of the requirements for an efficient photocatalyst is its long-term photostability. Since the metal–ligand interactions in MOFs are coordinative, they are subjected to break under UV/visible irradiations. Powder X-ray diffraction (PXRD) is a useful tool to monitor the MOF's crystallinity in harsh conditions, which has been used for reporting water/solvent,20 acid/base,21 thermal,22 and photo-stability.23 Though numerous reports are available where PXRD was used to report the water and thermal stability, studies dealing with photostability have reserved contradictory opinions.7 Studies dealing with the irradiation of MOFs under UV/visible irradiation have reported significant alterations in the PXRD pattern,24,25 while in other published works, PXRD patterns have no major changes.7,26,27 Thus, the formation of structural defects in a MOF after irradiation may or may not be traced in the PXRD pattern. However, a large number of defects in the MOF could change the relative intensity of small-angle peaks.7
PXRD should be supported with other powerful spectroscopic techniques like X-ray photoelectron spectroscopy (XPS). Mateo et al. 2019 studied long-term photostability of widely used terephthalate MOFs of Fe, Zr, Ti, Cr, and Zn by monitoring CO2 evolution as a function of irradiation time.7 The study predicted the decarboxylation process under 300 W Xe with insignificant variations in PXRD patterns. On a similar note, XPS could be used to trace changes in the metal node oxidation states, the decarboxylation process, and linker decomposition.25 So far, XPS spectroscopy has not been adopted properly to explore photostability of MOFs and at the same time, the long-term photostability of Mn, Co, and Ni-based MOFs needs a thorough investigation. In the present study, terephthalate and trimesate MOFs of Mn, Co, and Ni have been synthesized by a rapid ultrasonication of organic linkers with freshly prepared metal hydroxide precursors. The photostability of MOFs was evaluated by different spectroscopic techniques after irradiating under 80 W UV-irradiation for 40 h. The study provides one of the first reports on the photostability of Mn, Co, and Ni-based MOFs.
2. Materials and method
2.1. Chemicals
Manganese(II) nitrate tetrahydrate (Mn(NO3)2·4H2O, purity 97%), cobalt(II) nitrate hexahydrate (Co(NO3)2·6H2O, purity 97%), nickel(II) nitrate hexahydrate (Ni(NO3)2·6H2O, purity 97%), benzene-1,4-dicarboxylic acid (H2BDC, purity 98%), and benzene-1,3,5-tricarboxylic acid (H3BTC, purity 95%) were procured from Sigma Aldrich. Ethanol (purity 94.5%), methanol (purity 99.5%), and sodium hydroxide (NaOH, purity 98%) were purchased from Samchun Pure Chemicals, Korea. N,N-Dimethyl formamide (DMF, purity 99.8%) was procured from Tedia Chemicals, Korea.2.2. Synthesis of MOFs
All the MOFs were synthesized by a common strategy. A freshly prepared metal hydroxide solution along with the organic linkers was subjected to ultrasonication for 20 min to achieve the desired MOF. Solution 1 was prepared by dissolving 4.29 g of NaOH in 82.5 mL methanol, which served as the precipitating agent for the formation of metal hydroxide. Solution 2 was the metal salt solution prepared by dissolving metal salts in 75 mL of DMF. Solution 3 was an organic linker in 190 mL of DMF. For all MOFs, the metal-to-ligand ratio was fixed to 1![[thin space (1/6-em)]](https://www.rsc.org/images/entities/char_2009.gif) :1. The synthesis was carried out by adding solution 1 into solution 2 under stirring, which led to the formation of metal hydroxide. Then, it was kept under ultrasonication (Sonics Vibra-cell 500 W, 20 kHz, 44% amplitude) and solution 3 was added to it. After 20 min of ultrasonication, the precipitate was separated by centrifugation, washed with ethanol, and dried at 70 °C in a hot air oven for 10 days. The composition of solutions has been listed in Table 1. The colour of synthesized MOFs has been shown in Fig. S1.† The motifs for terephthalate MOFs have been shown in Fig. 1.
:1. The synthesis was carried out by adding solution 1 into solution 2 under stirring, which led to the formation of metal hydroxide. Then, it was kept under ultrasonication (Sonics Vibra-cell 500 W, 20 kHz, 44% amplitude) and solution 3 was added to it. After 20 min of ultrasonication, the precipitate was separated by centrifugation, washed with ethanol, and dried at 70 °C in a hot air oven for 10 days. The composition of solutions has been listed in Table 1. The colour of synthesized MOFs has been shown in Fig. S1.† The motifs for terephthalate MOFs have been shown in Fig. 1.
| MOF | Solution 2 | Solution 3 |
|---|---|---|
| MnBDC | 10.41 g of Mn(NO3)2·4H2O | 6.64 g of H2BDC |
| MnBTC | 10.41 g of Mn(NO3)2·4H2O | 8.50 g of H3BTC |
| CoBDC | 12.07 g of Co(NO3)2·6H2O | 6.64 g of H2BDC |
| CoBTC | 12.07 g of Co(NO3)2·6H2O | 8.50 g of H3BTC |
| NiBDC | 12.07 g of Ni(NO3)2·6H2O | 6.64 g of H2BDC |
| NiBTC | 12.07 g of Ni(NO3)2·6H2O | 8.50 g of H3BTC |
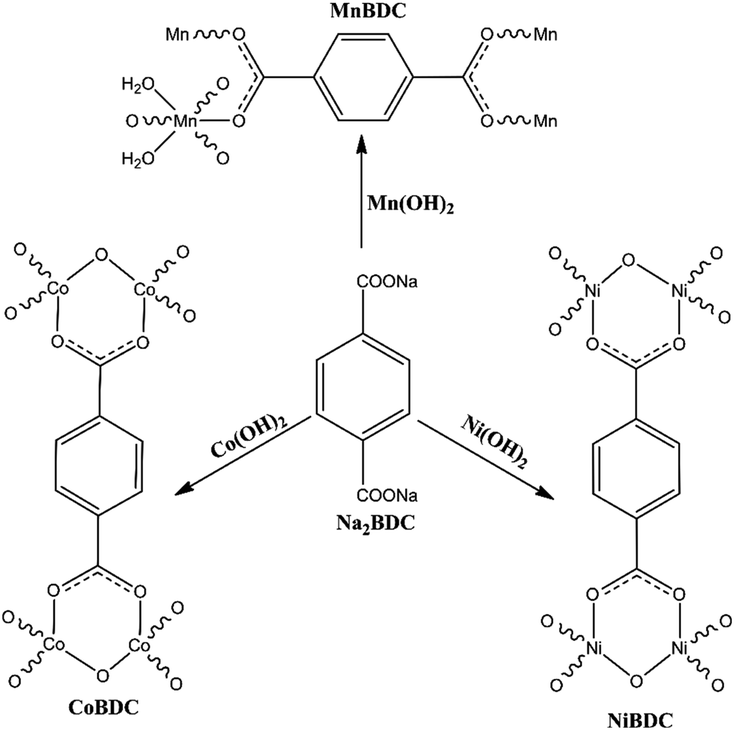 | ||
| Fig. 1 Motifs of as-synthesized terephthalate MOFs of Mn, Co, and Ni. | ||
2.3. Instruments
The microscopic morphology and structures of the samples were characterized using a JEM-2010F, JEOL, Japan transmission electron microscope (TEM) and Hitachi S-4300, Japan scanning electron microscope (SEM) coupled with energy dispersive X-ray analysis (EDX, X-Maxn 80 T, Oxford, UK). The powder X-ray powder diffraction (PXRD) analyses were conducted on Ultima IV (Rigajku, Japan) X-ray diffractometer with Cu Kα and a Ni filter where the scanning speed was set to 3° min−1. The X-ray photoelectron spectra (XPS) were conducted by a K-alpha XPS instrument (Thermo Scientific Inc., UK) with a monochromatic Al Kα X-ray source where the pressure was fixed to 4.8 × 10⁻⁹ mbar. The specific surface area and porosity of MOFs were obtained using Gemini series Micromeritics 2360 Brunauer–Emmett–Teller (BET) nitrogen adsorption–desorption at liquid N2 temperature (−196 °C). The samples were degassed for 0.5 h at 90 °C and 8 h at 200 °C. The optical absorbance spectroscopy in diffuse reflectance mode was recorded using SCINCO S-4100 spectrometer equipped with a photodiode array detector and a diffuse reflectance attachment over a wavelength range of 270 to 1000 nm. Thermal gravimetric analysis (TGA) was done over a Thermogravimetric Analyzer (TG 209 F3, NETZSCH).2.4. Photostability experiment
Exactly 3 g of a MOF was placed in a pyrex tube (1 L) filled with N2/O2 (80:20). The tube was kept in an acryl reactor with 4 UV-C lamps installed in a rectangular assembly (20 W each, Imax ∼ 254 nm). The reactor was fitted with a cooling fan to dissipate heat generated during the irradiation process. Also, an axial rotor was fitted externally to rotate the tube at 3 rpm. The samples were irradiated for 40 h in steps of 5 h with 1 h gap between each step to minimize the effect of heat due to the rotor.
3. Results and discussion
All the synthesized MOFs have a different surface morphology as characterized by SEM (Fig. 2) and TEM analysis (Fig. 3 and S2†). While MnBDC has no defined morphology, MnO2 nanoparticles could be observed on the surface, which was further confirmed by HRTEM image (Fig. S2a†). MnBTC MOFs formed as microspheres with no oxide deposition. CoBDC has a cluttered sheet-like structure with ∼5–6 nm nanoparticles (Fig. S2c†), whereas CoBTC has large distorted hexagonal crystals covered with nanothreads. NiBDC has flower-like structures arising from the random arrangement of bent microsheets with ∼5–6 nm nanoparticles probably over the microsheets (Fig. S2e†). NiBTC was nanoparticles coated microrods. The nanoparticle deposition was further confirmed in the HRTEM image (Fig. S2f†). The presence of metal oxide nanoparticles suggested the involvement of two reactions during the MOF synthesis under the effect of ultrasonication. Since freshly prepared metal hydroxides were used as the precursor, the interaction of organic linkers with the metal hydroxide served as the primary reaction in the formation of MOF. The secondary reaction was the dehydration of metal hydroxides to form metal oxide nanoparticles under ultrasonication. Though metal oxide formation was not reported in case of Cu-based MOFs synthesized using the same process,28 a higher metal-to-ligand ratio for zinc-based MOFs resulted in the formation of ZnO in MOFs.29 The deviation from a conventional metal-to-H3BTC ratio of 3:2 in the present study (with 1:1 ratio) led to either no deposition or significantly low deposition of metal oxides as compared to those with H2BDC linkers.
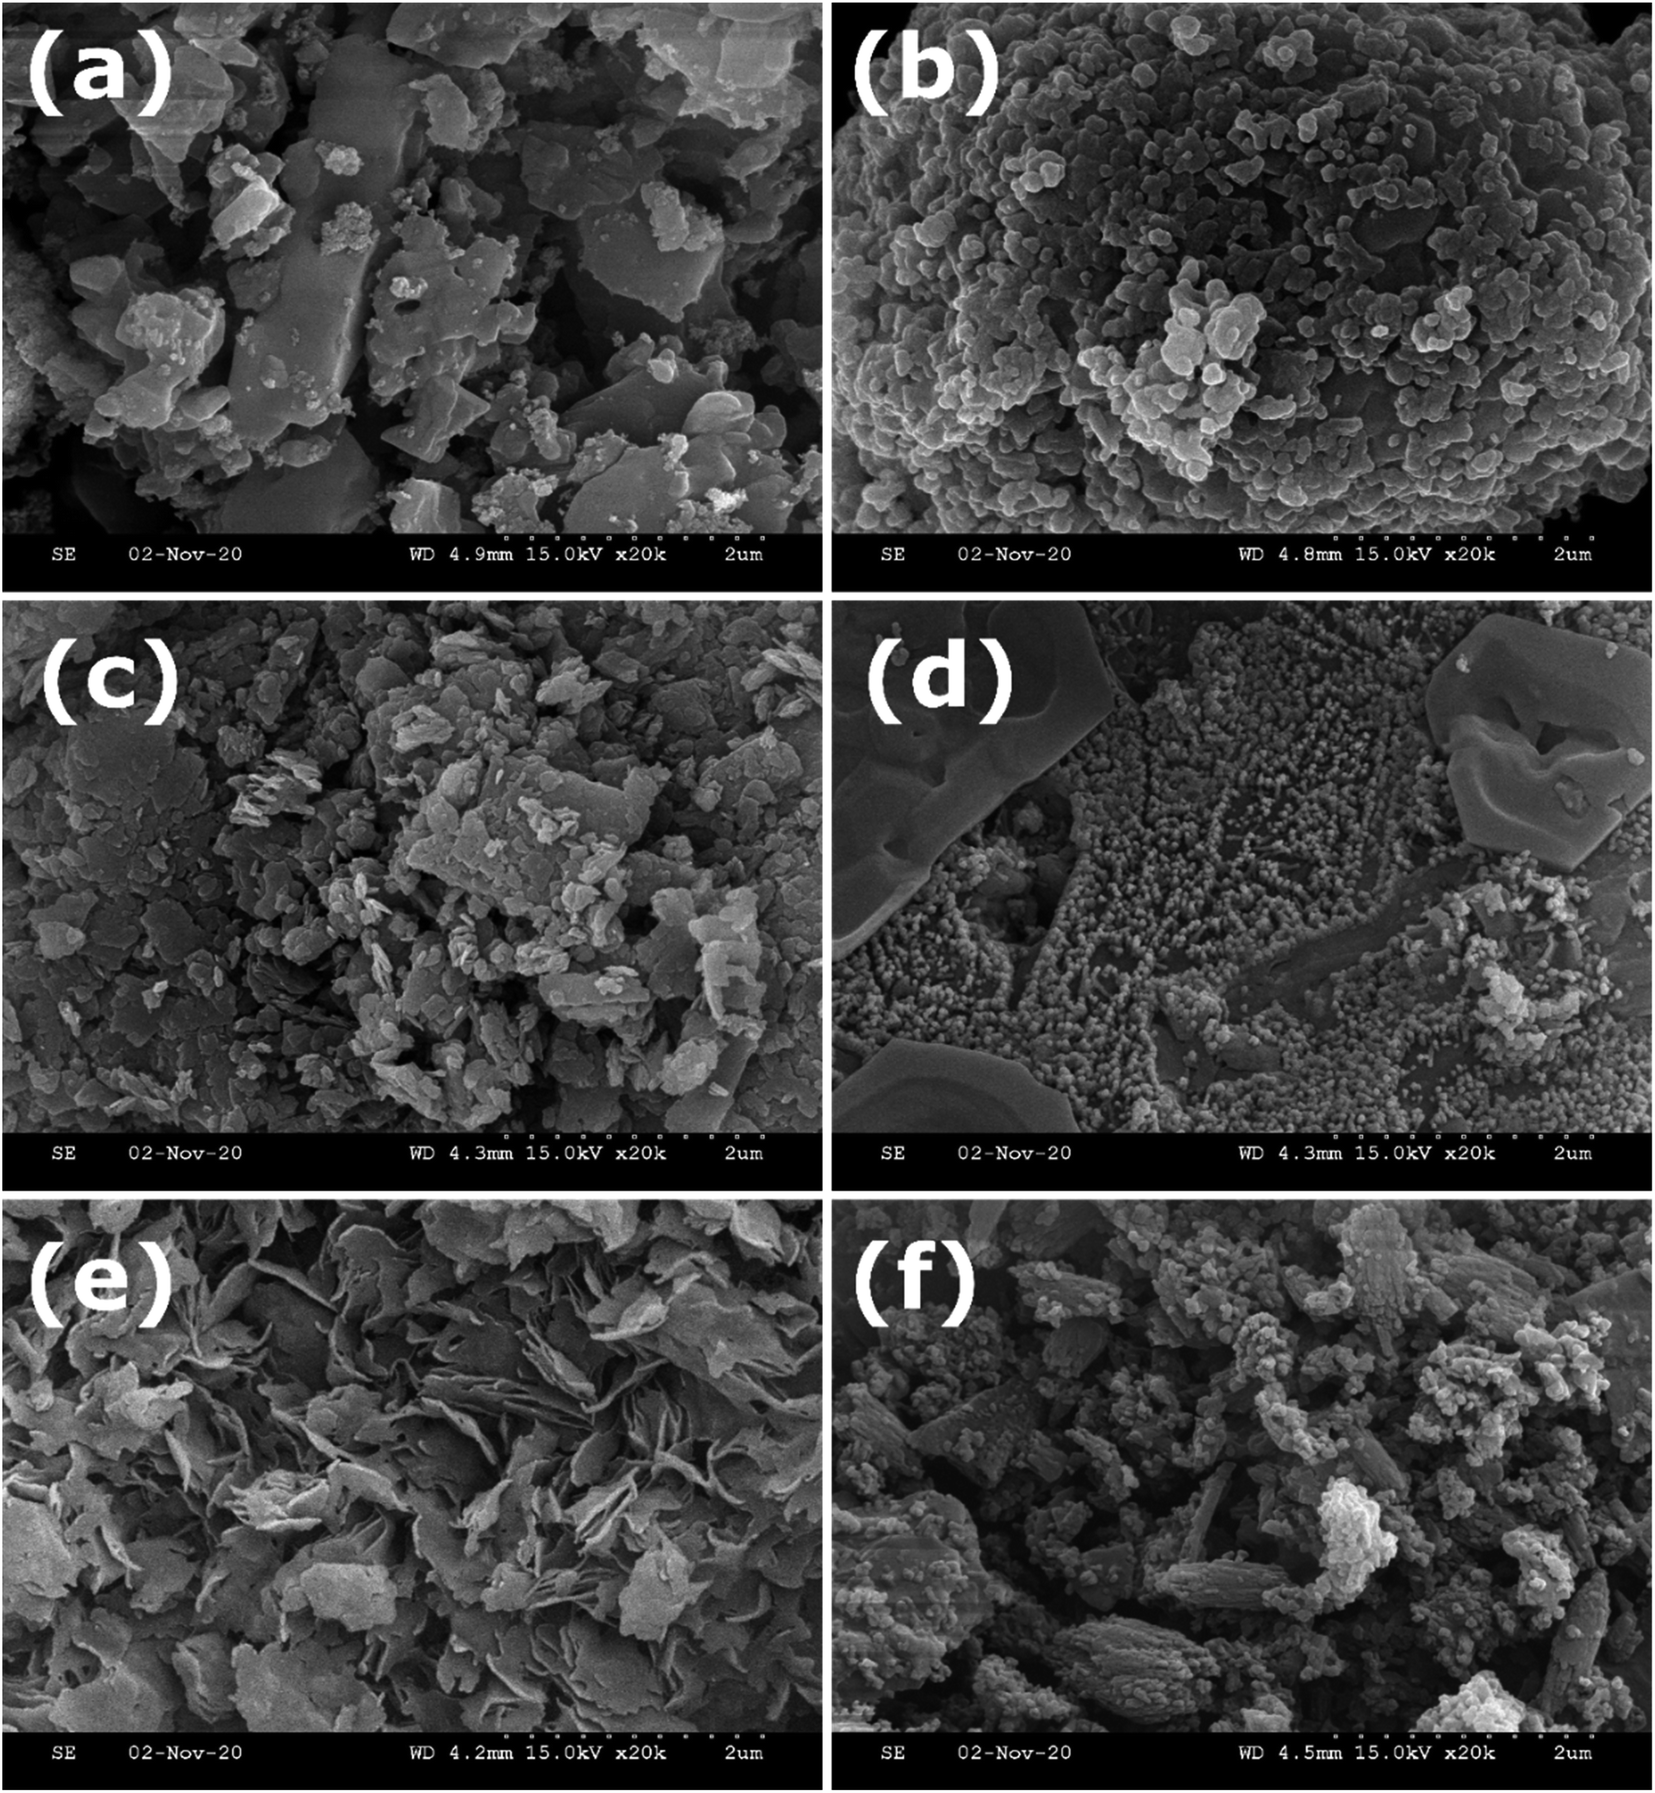 | ||
| Fig. 2 SEM images of (a) MnBDC; (b) MnBTC; (c) CoBDC; (d) CoBTC; (e) NiBDC; (f) NiBTC at 2 μm resolution. | ||
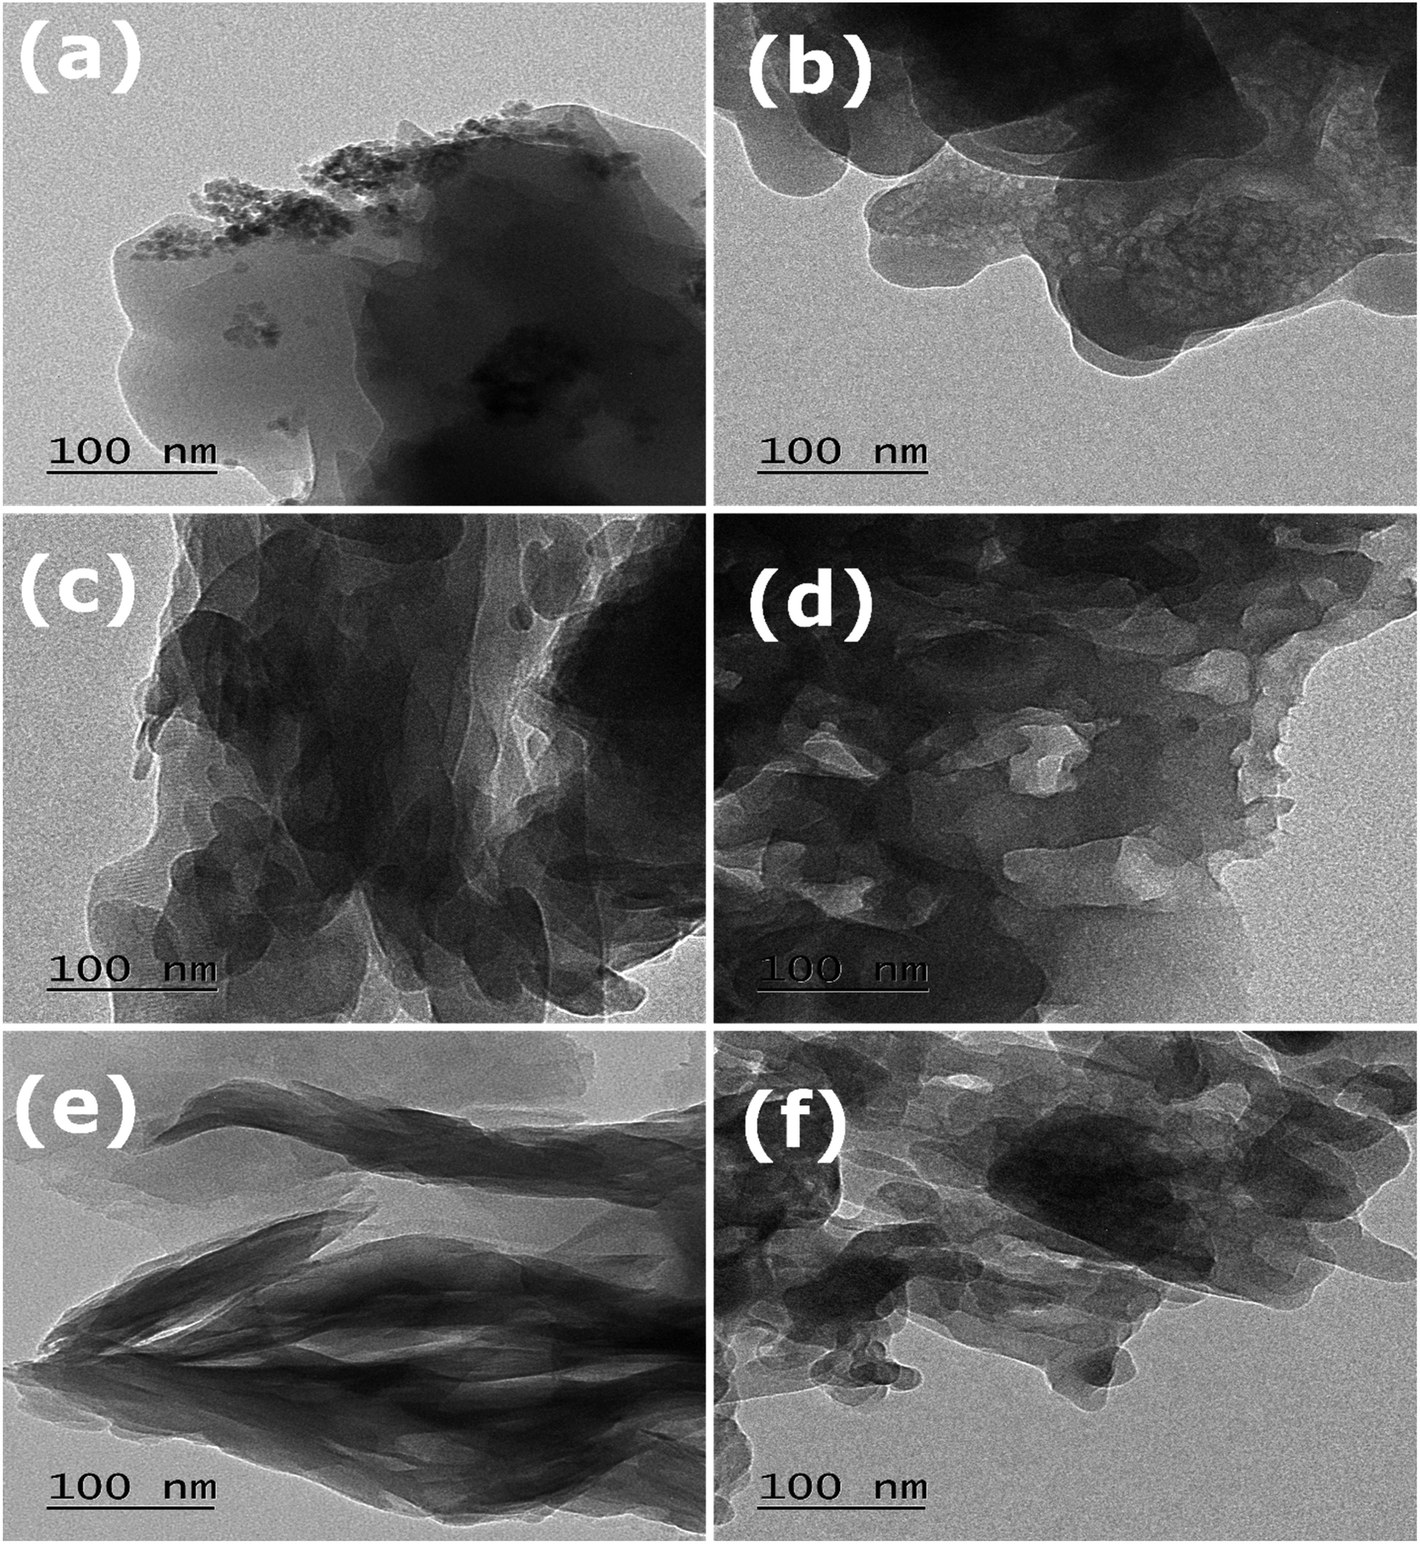 | ||
| Fig. 3 TEM images of (a) MnBDC; (b) MnBTC; (c) CoBDC; (d) CoBTC; (e) NiBDC; (f) NiBTC at 100 nm resolution. | ||
The 2D elemental mapping of MOFs has been shown in Fig. S3,† whereas the corresponding TEM-EDS analysis has been reported in Fig. S4 and S5.† TEM-EDS analysis confirmed a non-uniform distribution of elements in many of the MOFs. The lack of uniformity in the elemental distribution was due to the formation of metal oxide nanoparticles, which created a region with a low metal density as compared to their respective carbon density. In the TEM-EDS analysis (Fig. S4 and S5†), a peak at ∼1.0 eV was due to the presence of Na species in the MOFs. The missing transition metal density in the MOFs was balanced by the Na+ ions. The observation is based on the fact that the MnBDC with significantly low ‘Mn’ density (Fig. S3a†) has a high-intensity Na peak (Fig. S4a†). On the same note, MOFs with H3BTC as linkers has a strong Na peak to compensate for the low 1:1 metal-to-ligand ratio (as opposed to the conventional 3:2 ratio) (Fig. S5†). This inference is also validated by a relatively low ‘Ni’ density in NiBTC (Fig. S3f†) coupled with a relatively high Na peak intensity in TEM-EDS analysis (Fig. S5c†). Thus, the loss of transition metal ions due to the dehydration of metal hydroxide precursors and a low metal-to-ligand ratio (for BTC-based MOFs) was balanced by Na+ ions, as protonation of carboxylate groups is an unlikely event in a strong alkali medium.
TGA profiles were recorded in the range of 30–900 °C at a heating rate of 10 °C min−1 in the N2/O2 atmosphere (Fig. S6†). In TGA profiles, there was an insignificant mass-loss in the 30–110 °C, which showed a negligible presence of physically adsorbed water. In the 110–250 °C range, the mass loss was due to the release of chemisorbed water and physisorbed solvent (DMF/ethanol).30 This mass loss was less significant for terephthalate-based MOFs. In the 250–420 °C range, a 50–60% loss was recorded for all MOFs due to the loss of organic linkers. Thus, MOFs were thermally stable till 250 °C. For a metal-to-ligand ratio of 1:1, the calculated residual mass in the TGA at 900 °C is expected to be ∼30% or even less. On the contrary, the residual mass was as high as 50% for some of the MOFs (Fig. S6†). This abnormal increment could be linked to the presence of metal oxides in the MOFs. The metal oxide has no role in the mass loss with increasing temperature and led to a high residual mass compared to the calculated mass loss.
The optical properties of MOFs were evaluated by UV-Vis DRS analysis (Fig. 4). All the MOFs absorbed in the UV-Vis-NIR region with multiple peaks originating from the ligand-to-metal charge transfer (LMCT) and d–d transitions around the metal centres. The band in the UV region could be assigned to the LMCT from the oxygen in carboxylate to metal centres. The band at ∼310 nm was due to π → π* transition of organic linkers.31 The second major absorption band in the visible region was due to d–d transitions of the metal centres.32,33 Based on the metal ions and the presence of different oxidation states, multiple bands in the visible-NIR range were observed. The direct bandgap could be estimated using the Tauc equation.34
| αhν = A(hν − Eg) | (1) |
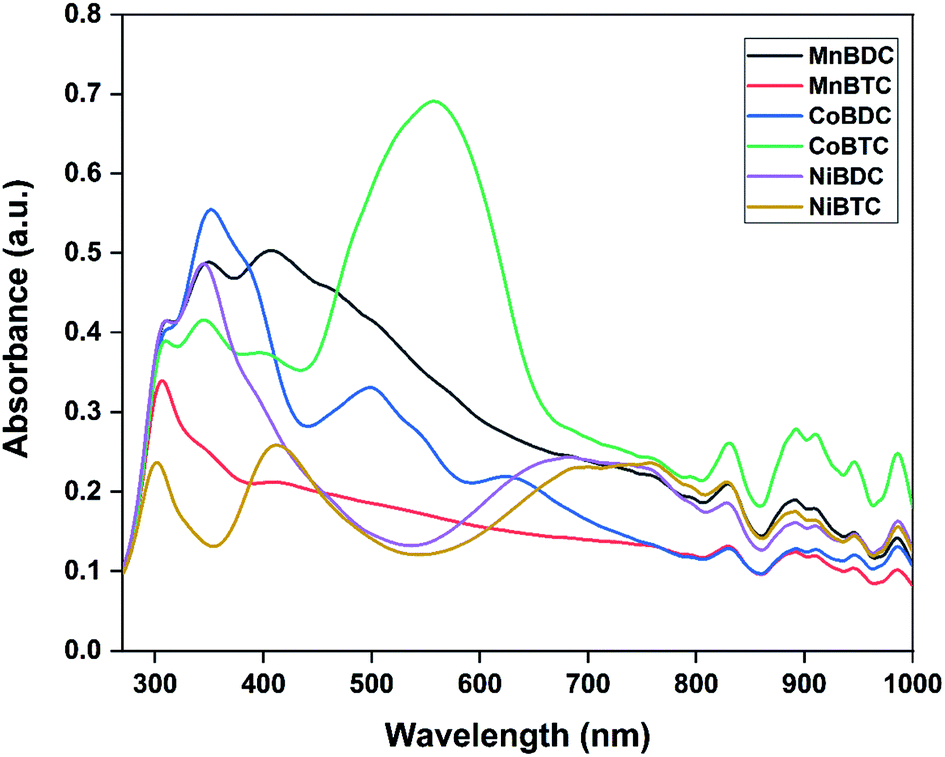 | ||
| Fig. 4 UV-visible DRS spectra of MOFs. | ||
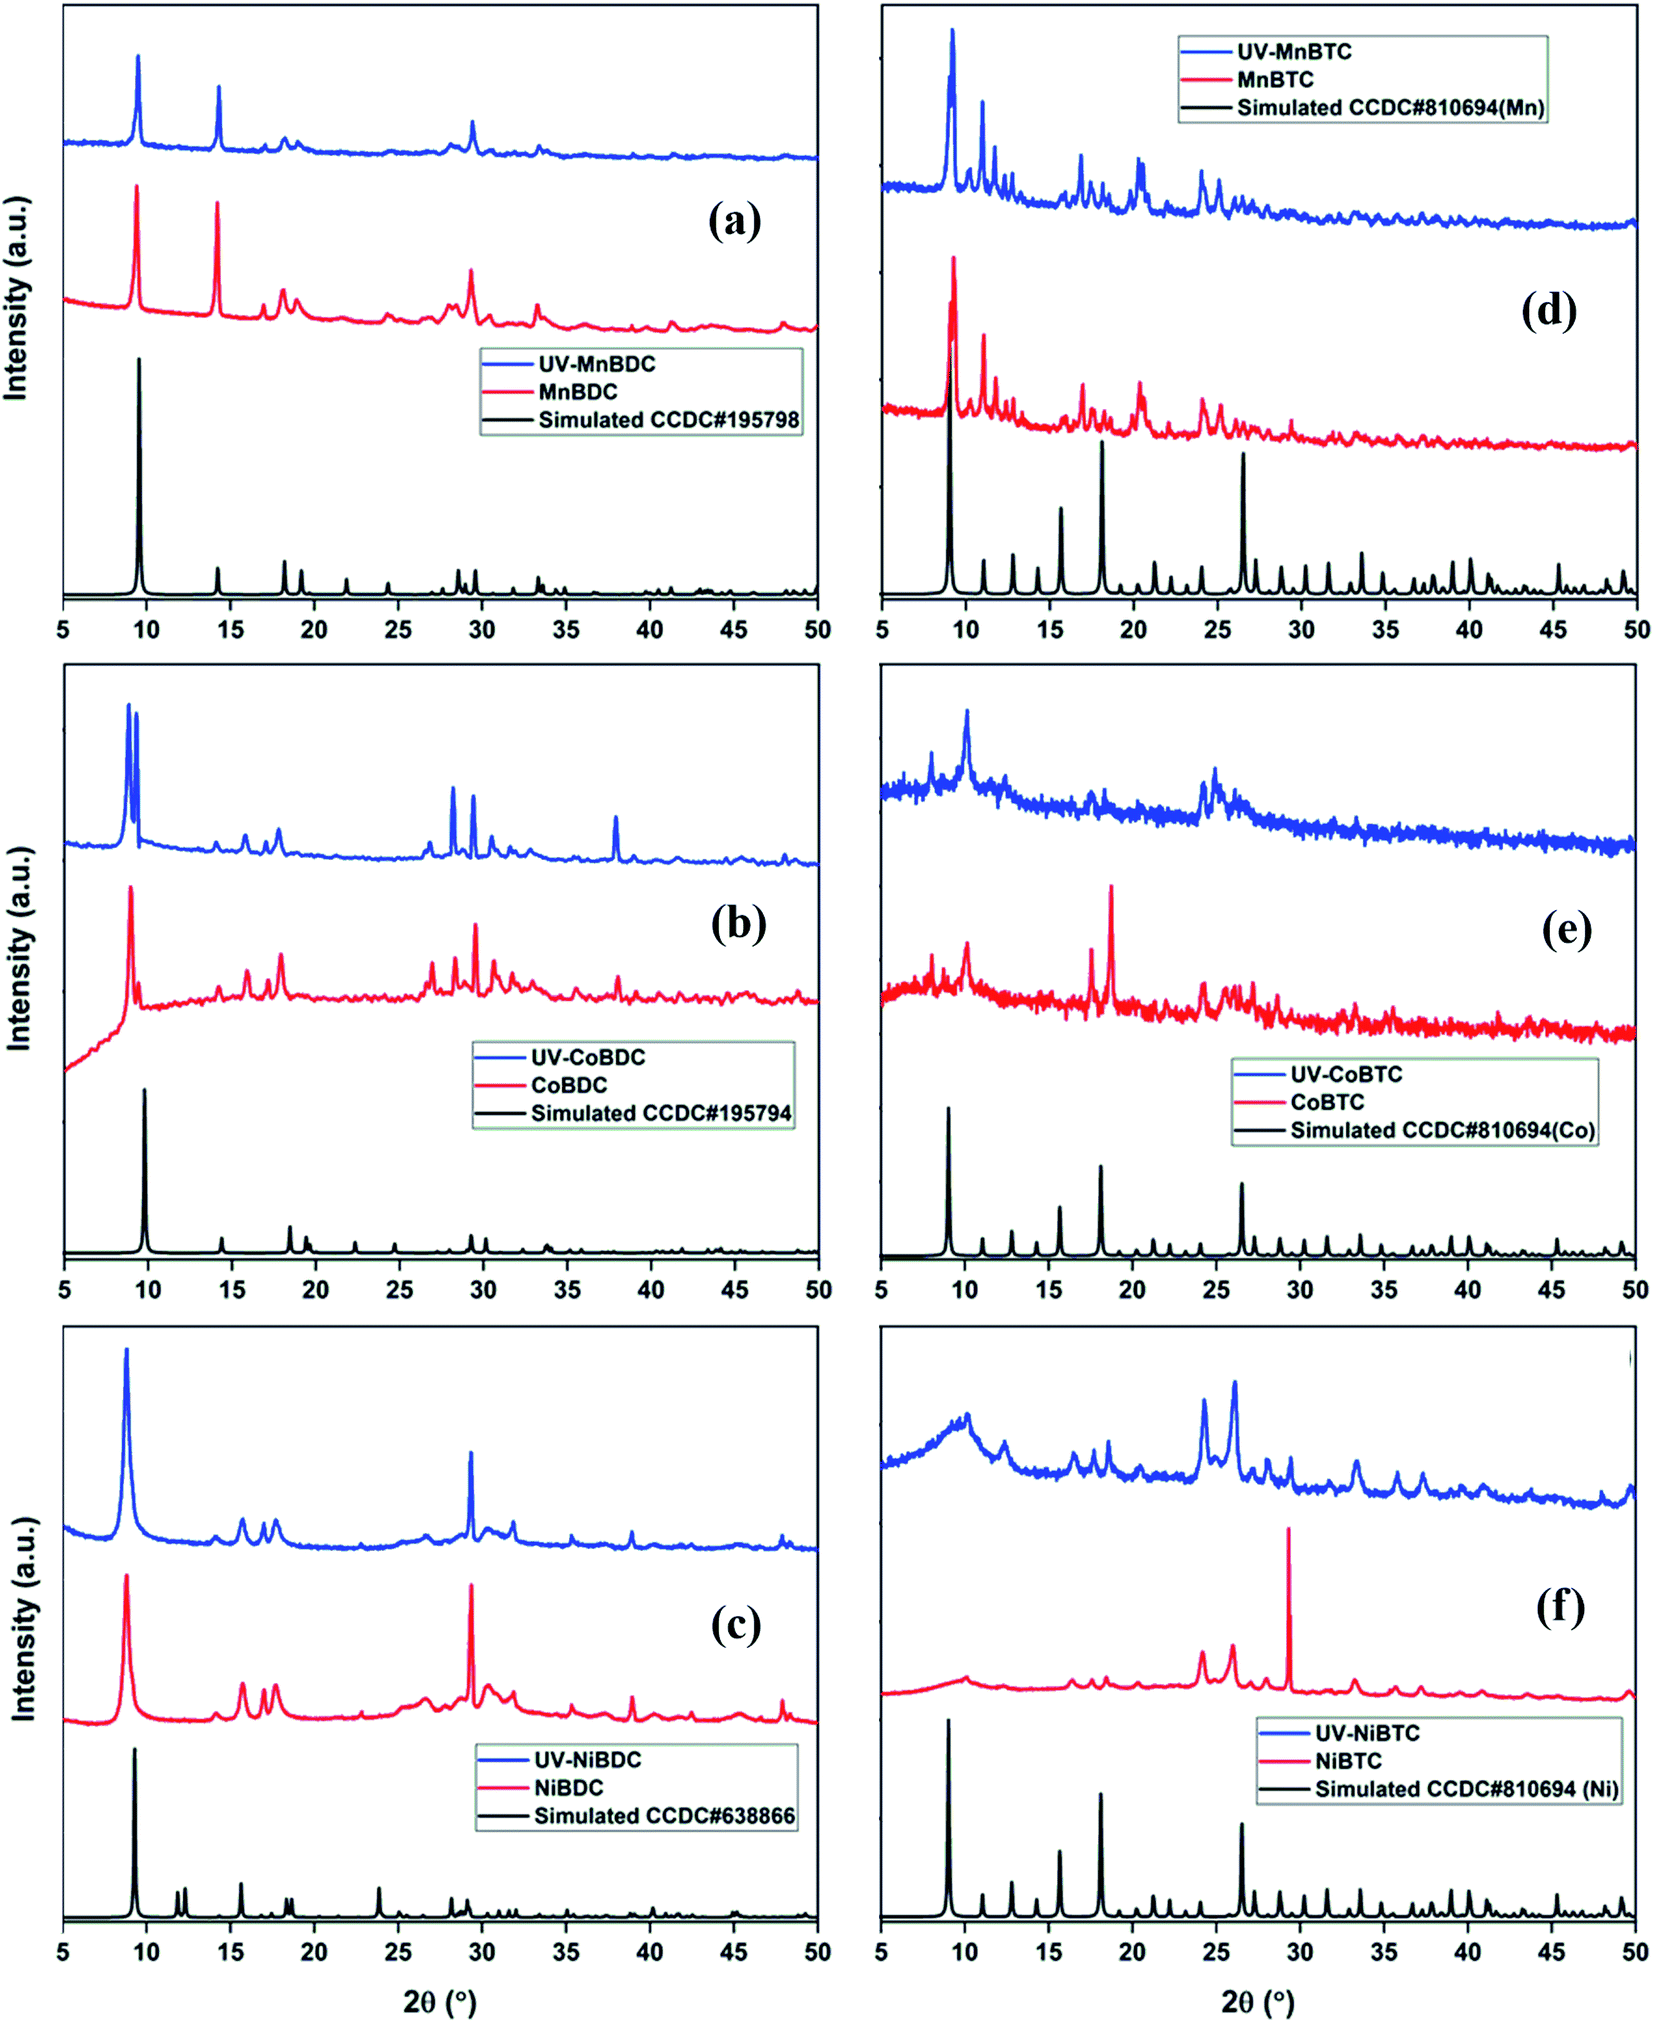
The PXRD pattern of MnBDC matched with the reported crystal structure of Mn(C8H4O4)(H2O)2. MnBDC crystallized in the monoclinic space group C2/c with a 19.046 Å, b 6.676 Å, c 7.489 Å, β 100.868°, which is in close agreement with the reported values in the literature.35 The diffraction pattern of UV-MnBDC showed a decrease in the relative intensity of the peak at 2θ = 29.34° with a slight shift in peak positions. The lattice parameters (a 18.937 Å, b 6.639 Å, c 7.494 Å, β 100.697°) of UV-MnBDC suggested a minuscule change in the MOF (Fig. 5a). The PXRD pattern of CoBDC did not match with the reported crystal structure of [Co(C8H4O4)(H2O)2].35 Though multiple peaks in the 27–35° range are visible, none of these matched with the cobalt oxides or Co(OH)2 precursor.36 The pattern matched with the CoBDC MOF reported by Ma et al.37 The peak at 8.98° had a minor split peak at 9.34° (Fig. 5b). The splitting of the low-angle peak has been previously reported in the synthesized MOF-5 (Zn4O(BDC)3, BDC2− = 1,4-benzodicarboxylate), which is generally associated with the distortion in the symmetry of MOF-5.38 After UV-irradiation, the peak split into two major peaks at 8.85° and 9.31° with significant relative intensity variations in other peaks as well. On a similar note, peak splitting has been observed in the ZSM-5 zeolite after minor incorporation of iron in the lattice.39 Considering the extent of splitting, one could predict that there were large symmetry transformations in CoBDC under UV-irradiation. The PXRD pattern of NiBDC matched well with the reported PXRD pattern of NiBDC37 (Fig. 5c). After UV-irradiation, the intensity of the peak at 29.33° decreased with no other change observed for low-angle peaks. Based on the PXRD analysis, the terephthalate-based MOFs showed an insignificant structural deterioration under the effect of UV-irradiation.
 | ||
| Fig. 5 PXRD patterns of fresh and UV-irradiated (a) MnBDC; (b) CoBDC; (c) NiBDC; (d) MnBTC; (e) CoBTC; (f) NiBTC. | ||
For the fabrication of trimesate MOFs, the metal-to-ligand ratio was kept 1:1, instead of 1.5:1, which makes these trimesate MOFs different from those reported in the literature with general formula M3BTC2·12H2O.40,41 Chen et al. reported three polymorphs of cobalt trimesate (TMA) using different bases for the reaction medium. In the presence of tetraethylammonium hydroxide, a trinuclear cobalt(II) complex ([Co3(TMA)2(H2O)14]·4H2O) formed with triclinic symmetry. Also, similar reaction conditions with NaOH (as a base instead of tetraethylammonium hydroxide) resulted in the formation of {[NaCo3(TMA)2(μ3-OH)(μ2-H2O)4(H2O)7]·1.5H2O in orthorhombic symmetry.42 In another study, the involvement of Na+ ions in the cadmium MOF led to the formation of [Cd3Na6(BTC)4(H2O)12]·H2O in the presence of NaOH.43 The PXRD pattern of this (Na,Cd) MOF did not match with the reported Cd3BTC2 MOF.44 Thus, the involvement of Na+ ions in the MOF has a strong role to play in the MOF structure and crystal symmetry, which are reflected in PXRD patterns. For this reason, the PXRD patterns of the trimesate MOFs synthesized in this study were found different from those observed for M3BTC2·12H2O, reported by Yaghi and co-workers.45 The high-intensity peaks at 9.1°, 9.3°, 11.1°, 11.8°, 17.0°, 20.4°, 20.6°, 24.1°, and 25.2°, observed for MnBTC remained intact even after UV-irradiation (Fig. 5d). Moreover, no appreciable intensity drop was recorded in any of the peaks. The PXRD pattern of CoBTC has peaks at 8.06°, 10.09°, 17.50°, 18.70°, 24.15°, 27.00°, 29.00°, and 33.00°, which matched with the literature.46 After UV-irradiation, the peaks at 17.50° and 18.70° disappeared, whereas the peaks at 8.06° and 10.09° became sharp (Fig. 5e). The disappearance of high-intensity peaks is related to decrease in the structural stability of MOF,47 whereas, the appearance of new peaks along with a decreased intensity of existing peaks is a strong indication of MOF crystal type transformation. These cell-type transformations (hexagonal → orthogonal → monoclinic) and structural deterioration have been reported in the MOF-177 in ambient air exposure for 5 weeks.48 In the present case, we can expect both cell-type transformations and structural deterioration, considering the disappearance of 17.50° and 18.70° peaks and the appearance of new low-angle peaks. The PXRD pattern of NiBTC had a high-intensity peak at 29.3° with minor peaks at 24.2° and 26.0° (Fig. 5f). The UV-irradiated NiBTC showed constructive changes in the PXRD pattern. Though the PXRD pattern fully overlapped with the pristine NiBTC, the intensity increased for all peaks except for the peak at 29.3°. These changes hinted towards structural adjustments and changes in the MOF cell type.
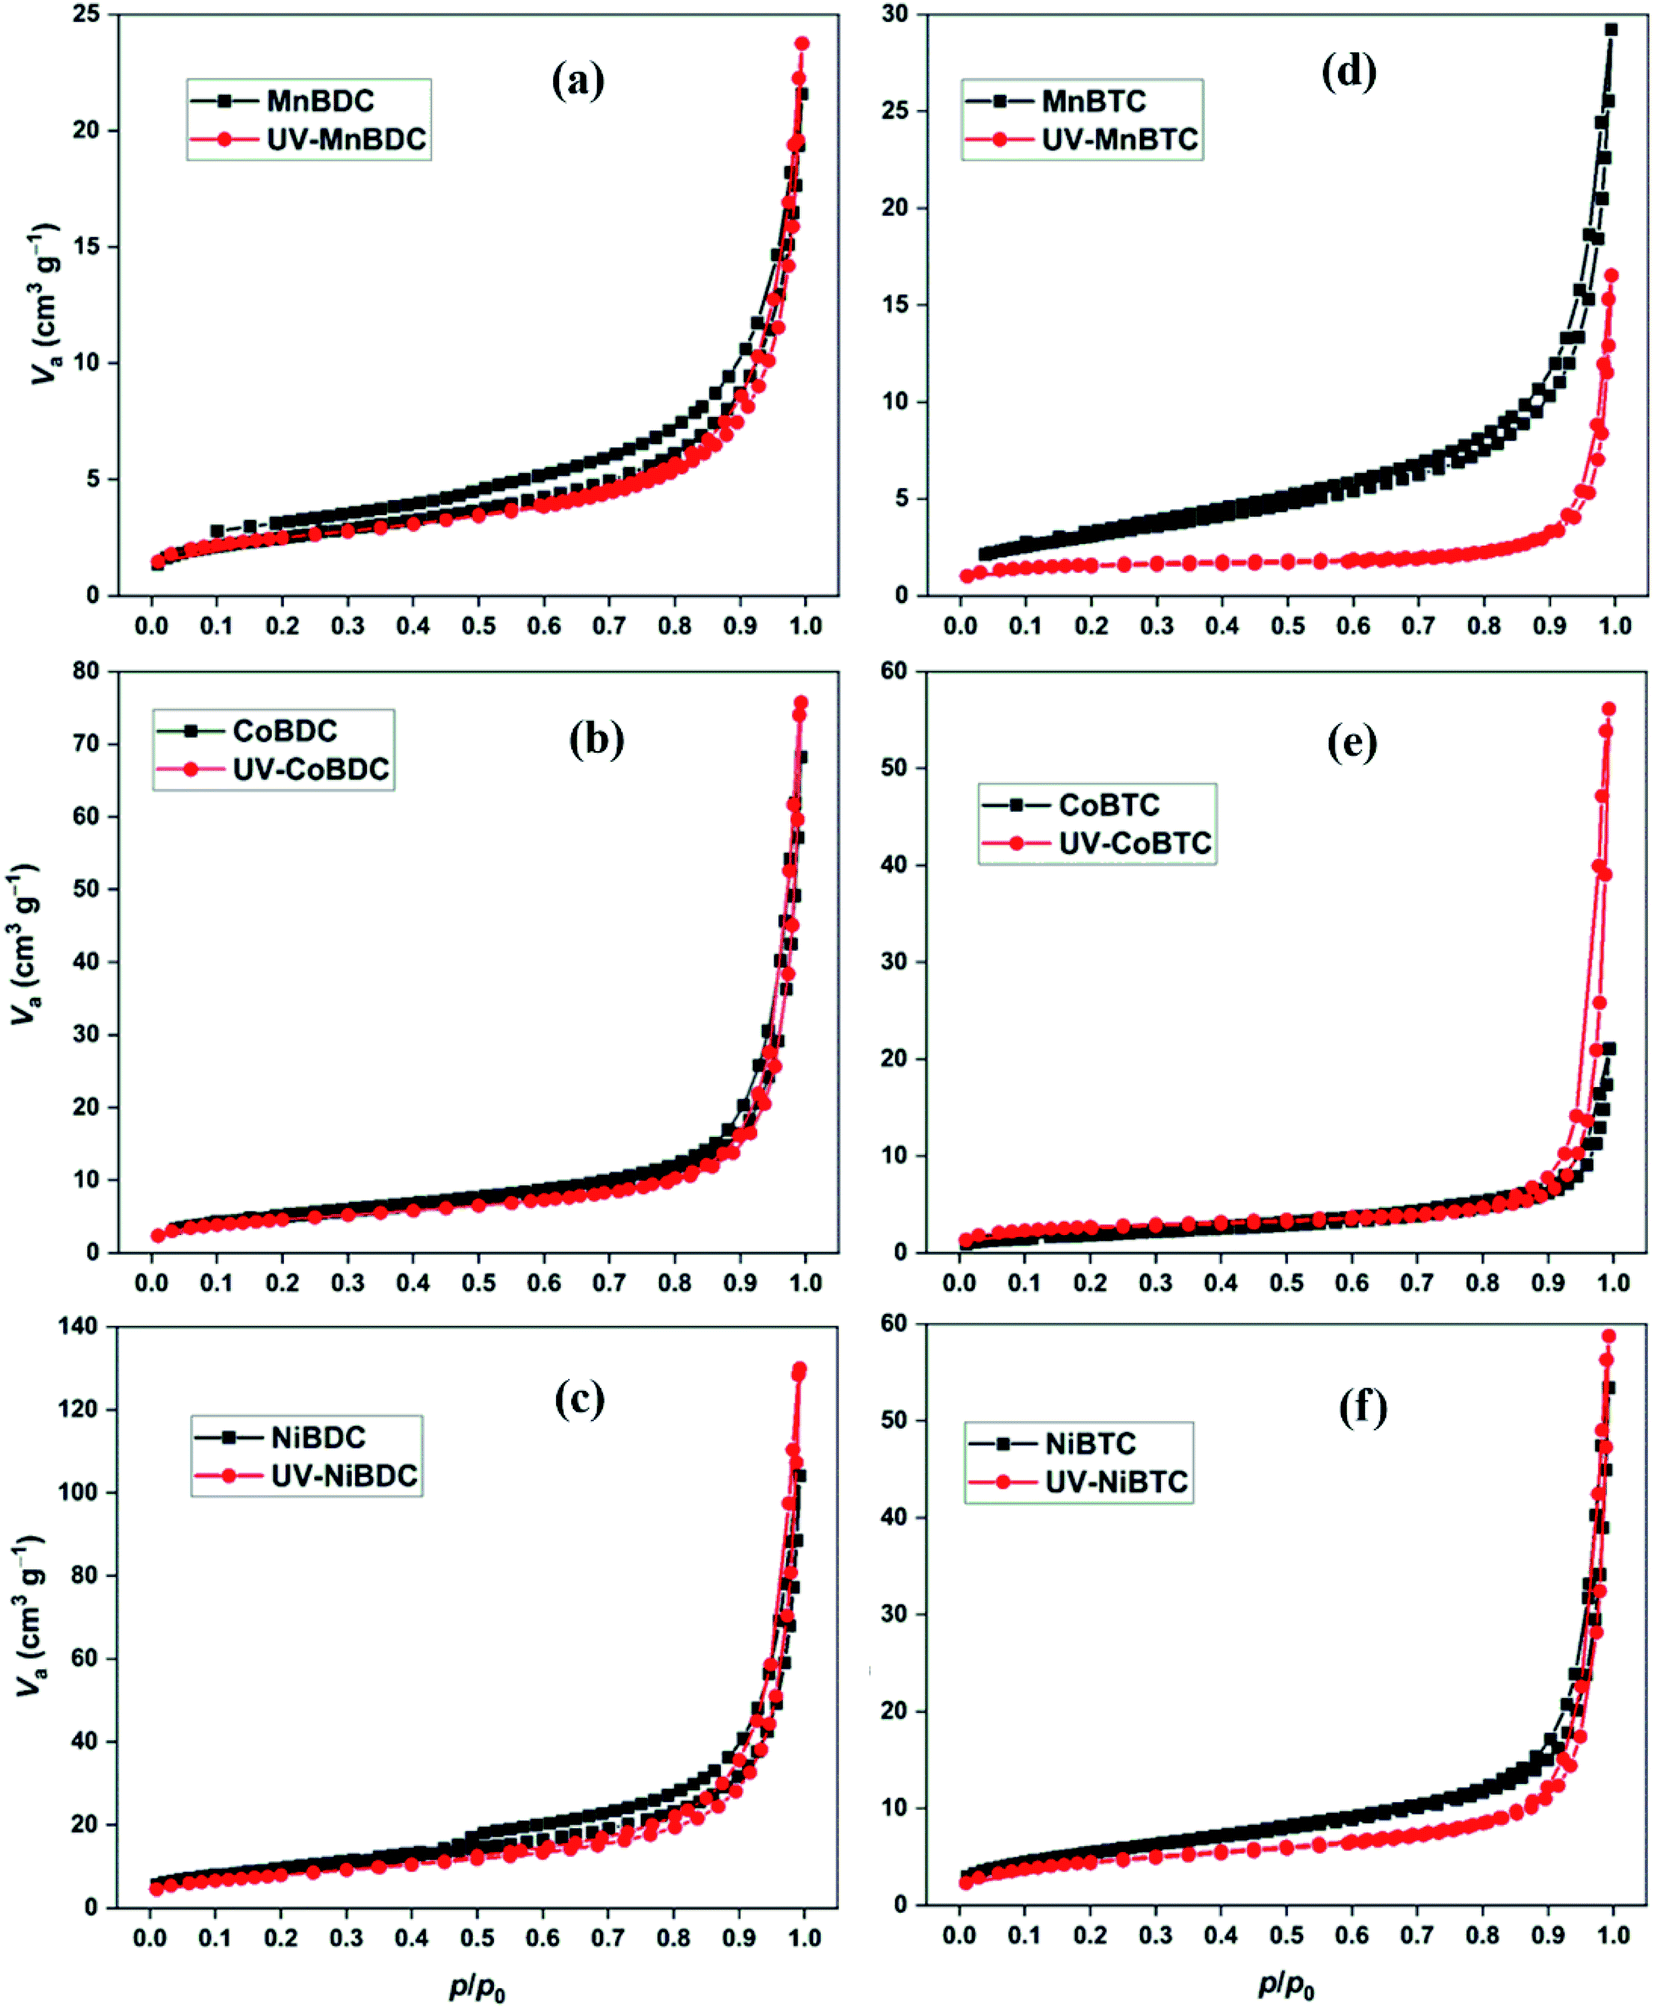
PXRD was partially successful in probing the changes that could have occurred during the irradiation process. Surface area and porosity are important parameters, which have been deduced from the N2 adsorption–desorption isotherms. The UV-irradiated decarboxylation process could decrease the surface area. The generation of defects may lower the surface area due to partial structural collapse.7 In some cases, removal of adsorbed solvent has been observed under UV-exposure, which is generally termed as photothermal activation of MOFs. This could improve the surface area and porosity by knocking-out the solvent molecules from the pores.24 In the present study, all MOFs have similar N2 adsorption–desorption isotherms for mesoporous materials (Fig. 6).49 The BET surface area and pore volume of MOFs before and after UV-irradiation have been listed in Table 2. In the previously reported study on the photostability of terephthalate MOFs, the shapes of isotherms changed after long-term UV irradiation (300 W Xe lamp). The decarboxylation process decreased the surface area of MIL101Cr, MIL125Ti-NH2, MIL101Fe, and UiO66Zr. On the contrary, the surface area of ZIF-8 increased, which showed no decarboxylation.7 The surface area for terephthalate and trimesate MOFs decreased after 40 h of UV-irradiation except for CoBTC. Likewise, the pore volume decreased for MOFs except for NiBDC and CoBTC. Based on TGA profiles, trimesate MOFs had a higher proportion of solvents than the terephthalate MOFs (Fig. S6†). As discussed earlier, UV irradiation could increase the surface area by photothermal activation (loss of solvent) or decrease it by the decarboxylation process. In the present study, both processes were involved in deciding the surface area of the UV-irradiated samples. The terephthalate MOFs had a lower mass loss in the 110–250 °C region (for solvent loss). Thus, a comparatively less improvement in surface area from photothermal activation is expected as compared to the trimesate MOFs. For this reason, a decrease in surface area was observed for terephthalate MOFs arising from the structural deterioration. On the contrary, for trimesate MOFs, the solvent loss was high with CoBTC showing the highest solvent loss, which could improve the surface area. Also, the uncoordinated carboxylates in the trimesate MOFs are an easy target for photodecarboxylation. The strong involvement of both the processes, i.e., photothermal activation and decarboxylation in trimesate MOFs may have led to the exception as CoBTC.
 | ||
| Fig. 6 N2 adsorption–desorption isotherms of (a) MnBDC; (b) MnBTC; (c) CoBDC; (d) CoBTC; (e) NiBDC; (f) NiBTC. | ||
| MOF | S BET (m2 g−1) | V t (cm3 g−1) | MOF | S BET (m2 g−1) | V t (cm3 g−1) |
|---|---|---|---|---|---|
| MnBDC | 8.99 | 0.033 | UV-MnBDC | 8.64 | 0.032 |
| CoBDC | 18.26 | 0.106 | UV-CoBDC | 16.39 | 0.104 |
| NiBDC | 34.00 | 0.161 | UV-NiBDC | 28.80 | 0.183 |
| MnBTC | 11.49 | 0.045 | UV-MnBTC | 5.64 | 0.020 |
| CoBTC | 6.85 | 0.033 | UV-CoBTC | 9.16 | 0.073 |
| NiBTC | 20.13 | 0.083 | UV-NiBTC | 16.00 | 0.080 |
So far, all these techniques could not probe the decarboxylation process. Besides decarboxylation, oxidation state modifications and ligand degradation are important aspects, which are unexplored in the literature. Han et al. 2017 reported micro-adjustments in the benzothiadiazole-4,7-dicarboxylate-Zn(II) MOF by light-driven decarboxylation process.25 The XPS analysis predicted a change in the Zn coordination environment with loss in the intensity for C–O and C![[double bond, length as m-dash]](https://www.rsc.org/images/entities/char_e001.gif) O peaks in the HRXPS C 1s spectrum of irradiated MOF. These changes qualitatively confirmed the decarboxylation process. Thus, XPS is a powerful spectroscopic method for tracing such changes and has been exploited in this study. Under the effect of UV-irradiation, ligand decomposition and decarboxylation are expected which could be traced by the HRXPS C 1s spectrum. The decarboxylation process is expected to lower the carboxylate density, whereas, ligand decomposition via oxidation could improve the C–O intensity at the expense of CC/C–H intensity. Another feature that we are focused on is the change in the oxidation state of transition metals in the UV-irradiated MOFs, which has not been reported in the literature. The spectra were charge corrected to the main line of the carbon 1s spectrum (aromatic carbon) set to 284.7 eV. Spectra were analyzed using CasaXPS software (version 2.3.14). GL(p) = Gaussian/Lorentzian product formula where the mixing is determined by m = p/100, GL(100) is a pure Lorentzian while GL(0) is pure Gaussian. We have used GL(30).50 Curve fitting parameters from high-resolution XPS spectra (HRXPS) are listed in Tables S1–S6.†
O peaks in the HRXPS C 1s spectrum of irradiated MOF. These changes qualitatively confirmed the decarboxylation process. Thus, XPS is a powerful spectroscopic method for tracing such changes and has been exploited in this study. Under the effect of UV-irradiation, ligand decomposition and decarboxylation are expected which could be traced by the HRXPS C 1s spectrum. The decarboxylation process is expected to lower the carboxylate density, whereas, ligand decomposition via oxidation could improve the C–O intensity at the expense of CC/C–H intensity. Another feature that we are focused on is the change in the oxidation state of transition metals in the UV-irradiated MOFs, which has not been reported in the literature. The spectra were charge corrected to the main line of the carbon 1s spectrum (aromatic carbon) set to 284.7 eV. Spectra were analyzed using CasaXPS software (version 2.3.14). GL(p) = Gaussian/Lorentzian product formula where the mixing is determined by m = p/100, GL(100) is a pure Lorentzian while GL(0) is pure Gaussian. We have used GL(30).50 Curve fitting parameters from high-resolution XPS spectra (HRXPS) are listed in Tables S1–S6.†
The HRXPS Mn 2p spectrum of MnBDC had two peaks at ∼644 and ∼656 eV for Mn 2p3/2 and Mn 2p1/2, respectively (Fig. 7a). The Mn 2p3/2 peak had contributions from Mn2+ (641.6 eV) and Mn4+ (643.6 eV) with 22.5 and 77.5% abundance, respectively.51 After UV-irradiation, the binding energy shifted to 641.0 eV (Mn2+) and 642.5 (Mn4+) with 34.4 and 69.6% abundance, respectively (Fig. 7b). As observed in the HRTEM images, the MnO2 nanoparticles partially contributed to the Mn4+ presence in MnBDC. But, the large proportion of Mn4+ species suggested that the MnBDC is composed of mixed valent Mn nodes. The increased proportion of Mn2+ indicated an electron-transfer mechanism from ligands to Mn4+, which reduced Mn4+ to Mn2+ species. The HRXPS C 1s spectrum of MnBDC has four peaks at 284.7, 286.4, 288.2, and 290.2 eV, which were assigned to the CC/C–H, C–O, –COOMn, and –COONa, respectively (Fig. 7c).52 After UV-irradiation, the intensity of the 284.7 eV peak strengthened while the contributions from C–O (47.2 → 27.3%), –COOMn (31.3 → 26.4%), and –COONa/–COOH (10.0 → 5.2%) decreased (Fig. 7d). All these changes confirmed decarboxylation of the linkers in MnBDC, which led to lattice defects and decreased intensity of peaks in the PXRD pattern. For MnBTC, the peaks for Mn2+ and Mn4+ were observed at 641.8 and 643.3 eV, respectively (S. Fig.ure 8a). For UV-MnBTC, Mn4+ peak shifted to 643.8 eV with an insignificant change in the Mn2+/Mn4+ ratio (Fig.ure 8b). The HRXPS C 1s spectrum of MnBTC before and after UV-irradiation had very different insights as compared to MnBDC (Fig.ure 8c and 8d). The proportion of Mn-bound carboxylate (288.5 eV, 26.4%) did not change after UV-irradiation. But, the contribution from –COONa (5.2 to 19.0%) and C–O (23.9 → 34.4%) hiked at the expense of CC/C–H (44.4 → 20.0%). Moreover, the –COONa and C–O shifted to the higher binding energy. These observations suggested ligand decomposition via oxidation of the phenyl ring as a dominating phenomenon in MnBTC as opposed to the decarboxylation in MnBDC.
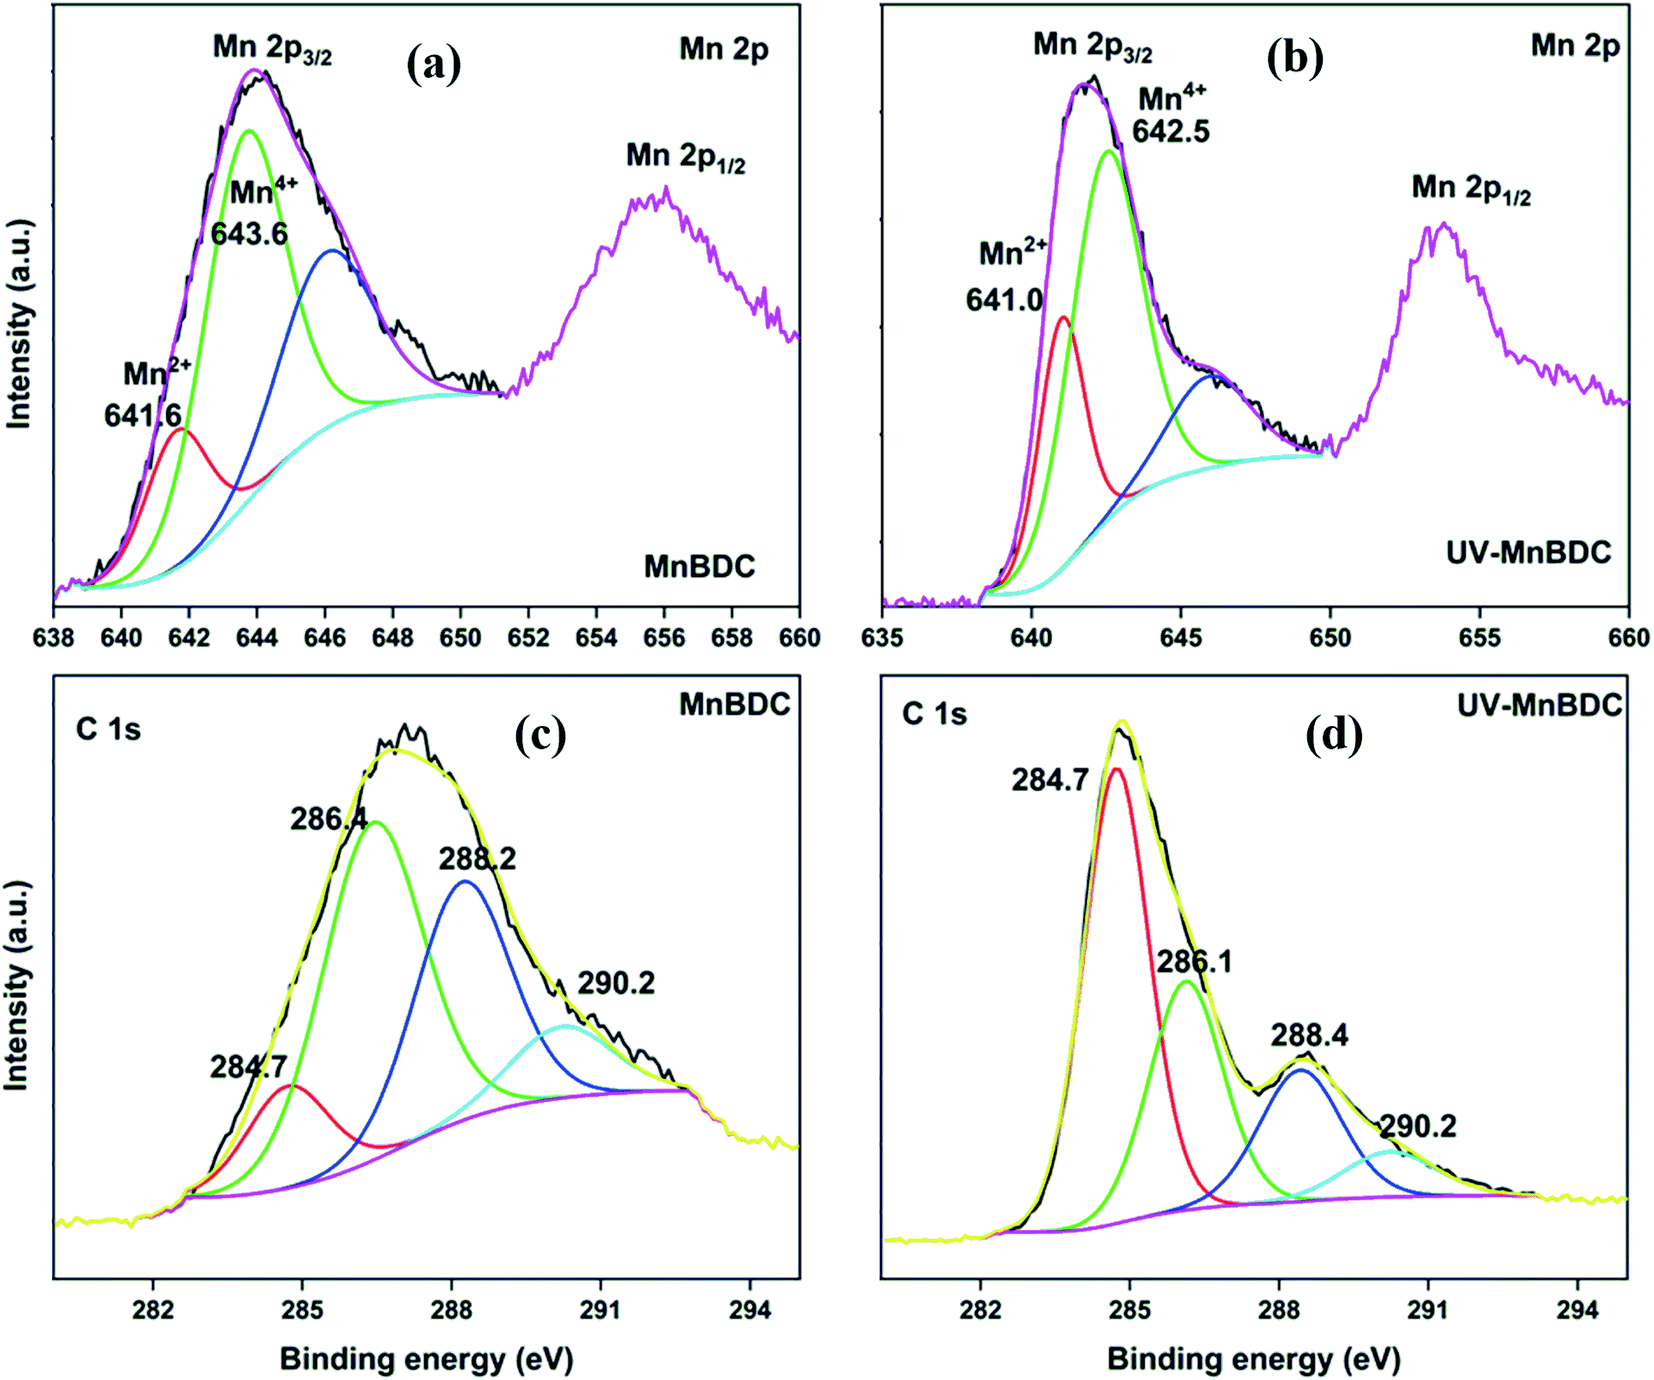 | ||
| Fig. 7 HRXPS Mn 2p spectra of (a) MnBDC; (b) UV-MnBDC; HRXPS C 1s spectra of (c) MnBDC; (d) UV-MnBDC. | ||
The HRXPS Co 2p3/2 spectrum of CoBDC has two components at 781.1 and 782.7 eV for Co3+ (49.1%) and Co2+ (50.9%), respectively (Fig. 8a).53 The most fascinating observation in the present study is the natural abundance of multiple oxidation states of transition metals in the MOFs, which is in alignment with our previously reported work on Cu-based MOFs prepared using a similar synthesis protocol.28 After UV irradiation, the position of the peaks and the area under the curves changed insignificantly (Fig. 8b). The HRXPS C 1s spectrum of CoBDC has four contributions as that observed for MnBDC (Fig. 8c). The UV-irradiated CoBDC showed a decrease in the –COOCo (18.5 → 13.4%) and increase in CC/C–H peak (45.4 → 50.1%) (Fig. 8d). These changes pointed towards decarboxylation with no ligand decomposition, which made CoBDC, a UV-stable MOF. The HRXPS Co 2p3/2 spectrum of CoBTC had two contributions from Co3+ (48.7%) and Co2+ (51.3%) at 781.0 and 782.5 eV, respectively (Fig. S9a†). Under UV-irradiation, these peaks shifted towards higher binding energy, which was at 781.3 eV (Co3+) and 783.3 eV (Co2+) with 38.5 and 61.5% contribution, respectively (Fig. S9b†). The HRXPS C 1s spectrum of CoBTC deconvoluted into four components at 284.7, 286.1, 288.3, and 290.1 for C=C/C–H, C–O, –COOCo, and –COONa, respectively (Fig. S9c†). Under the effect of UV, the shape of the HRXPS C 1s changed with a lowering in the CC/C–H (53.2 → 13.9%). Moreover, the proportion corresponding to the total carboxylate increased (31.0 → 66.7%) with an increase in the C–O intensity (Fig. S9d†). These changes were due to the photocatalytic oxidation of the aromatic linkers in CoBTC with the reduction of Co3+-sites.
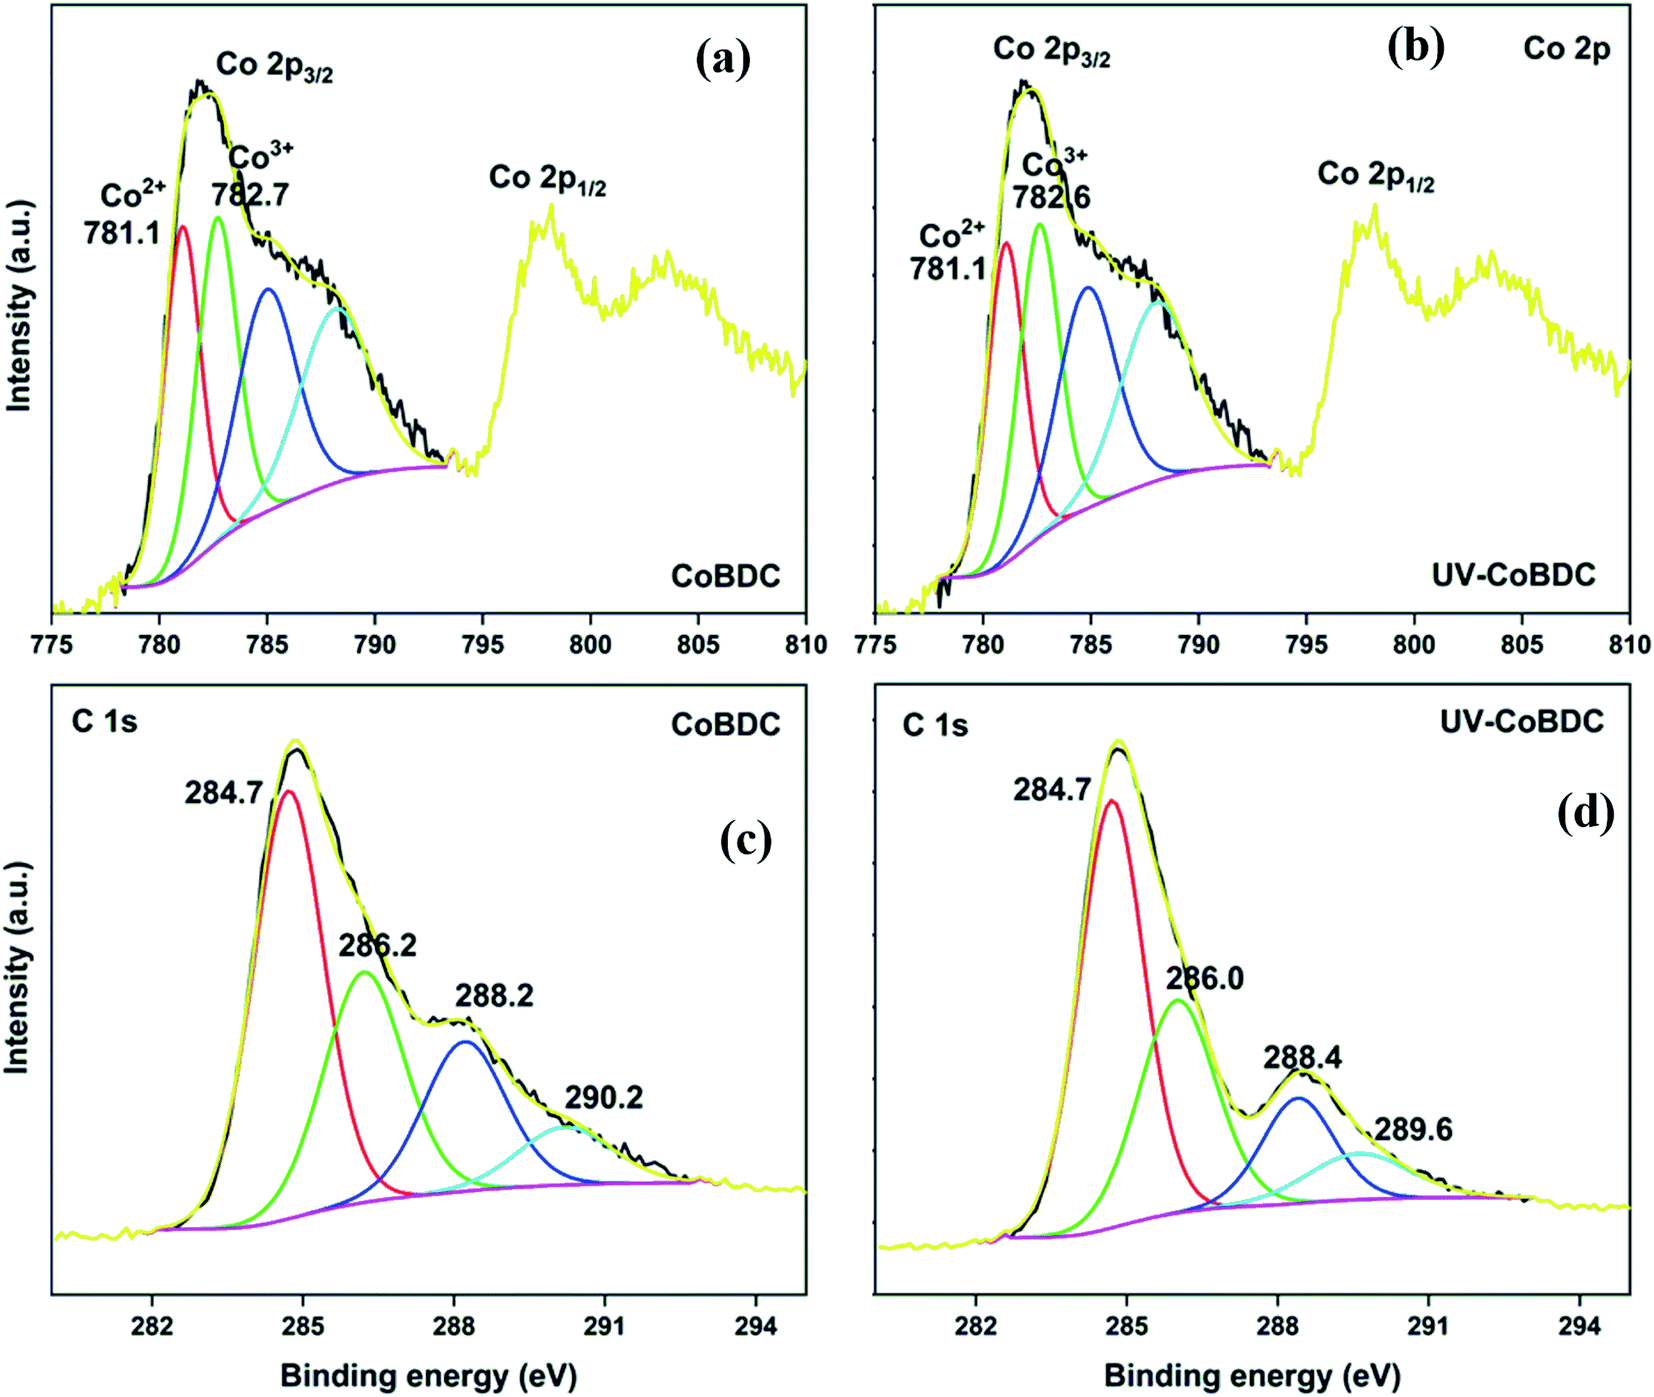 | ||
| Fig. 8 HRXPS Co 2p spectra of (a) CoBDC; (b) UV-CoBDC; HRXPS C 1s spectra of (c) CoBDC; (d) UV-CoBDC. | ||
The HRXPS Ni 2p3/2 in NiBDC has two contributions at 855.7 and 856.9 eV for Ni2+ (52.5%) and Ni3+ (47.5%), respectively (Fig. S10a†).54 Though Ni3+ is not a commonly occurring oxidation state of Ni in MOFs, it has been observed in the present case, probably due to the ultrasonication effect, which may have oxidized the Ni2+ states. UV-irradiation has no effect on the position and area under the curve of both Ni peaks (Fig. S10b†). The HRXPS C 1s spectra of NiBDC (Fig. S10c†) and UV-NiBDC (Fig. S10d†) had similar contributions except that the –COONi (11.3 → 16.1%) and C–O (11.5 → 12.6%) proportion increased at the expense of CC/C–H (74.9 → 68.8%). These changes are due to the ligand oxidation, but the extent of decomposition is considerably low, which is enough to conclude that NiBDC has a high photostability. The HRXPS Ni 2p3/2 peak of NiBTC has similar contributions from Ni2+ and Ni3+ as those observed for NiBDC (Fig. 9a). The Ni2+ proportion reached to 4.1% (from 52.1%) and at the same time, Ni3+ proportion hiked from 47.9 to 95.9% after UV-exposure (Fig. 9b). The HRXPS C 1s spectrum of UV-NiBTC (Fig. 9c) had a different spectral feature as compared to NiBTC (Fig. 9d). A significant drop in the CC peak intensity (66.3 → 12.2%) and increased intensity of C–O (7.5 → 54.0%) and total carboxylate (26.2 → 33.8%) were recorded. Thus, it was conclusive that NiBTC showed phenyl ring decomposition under the effect of UV-irradiation.
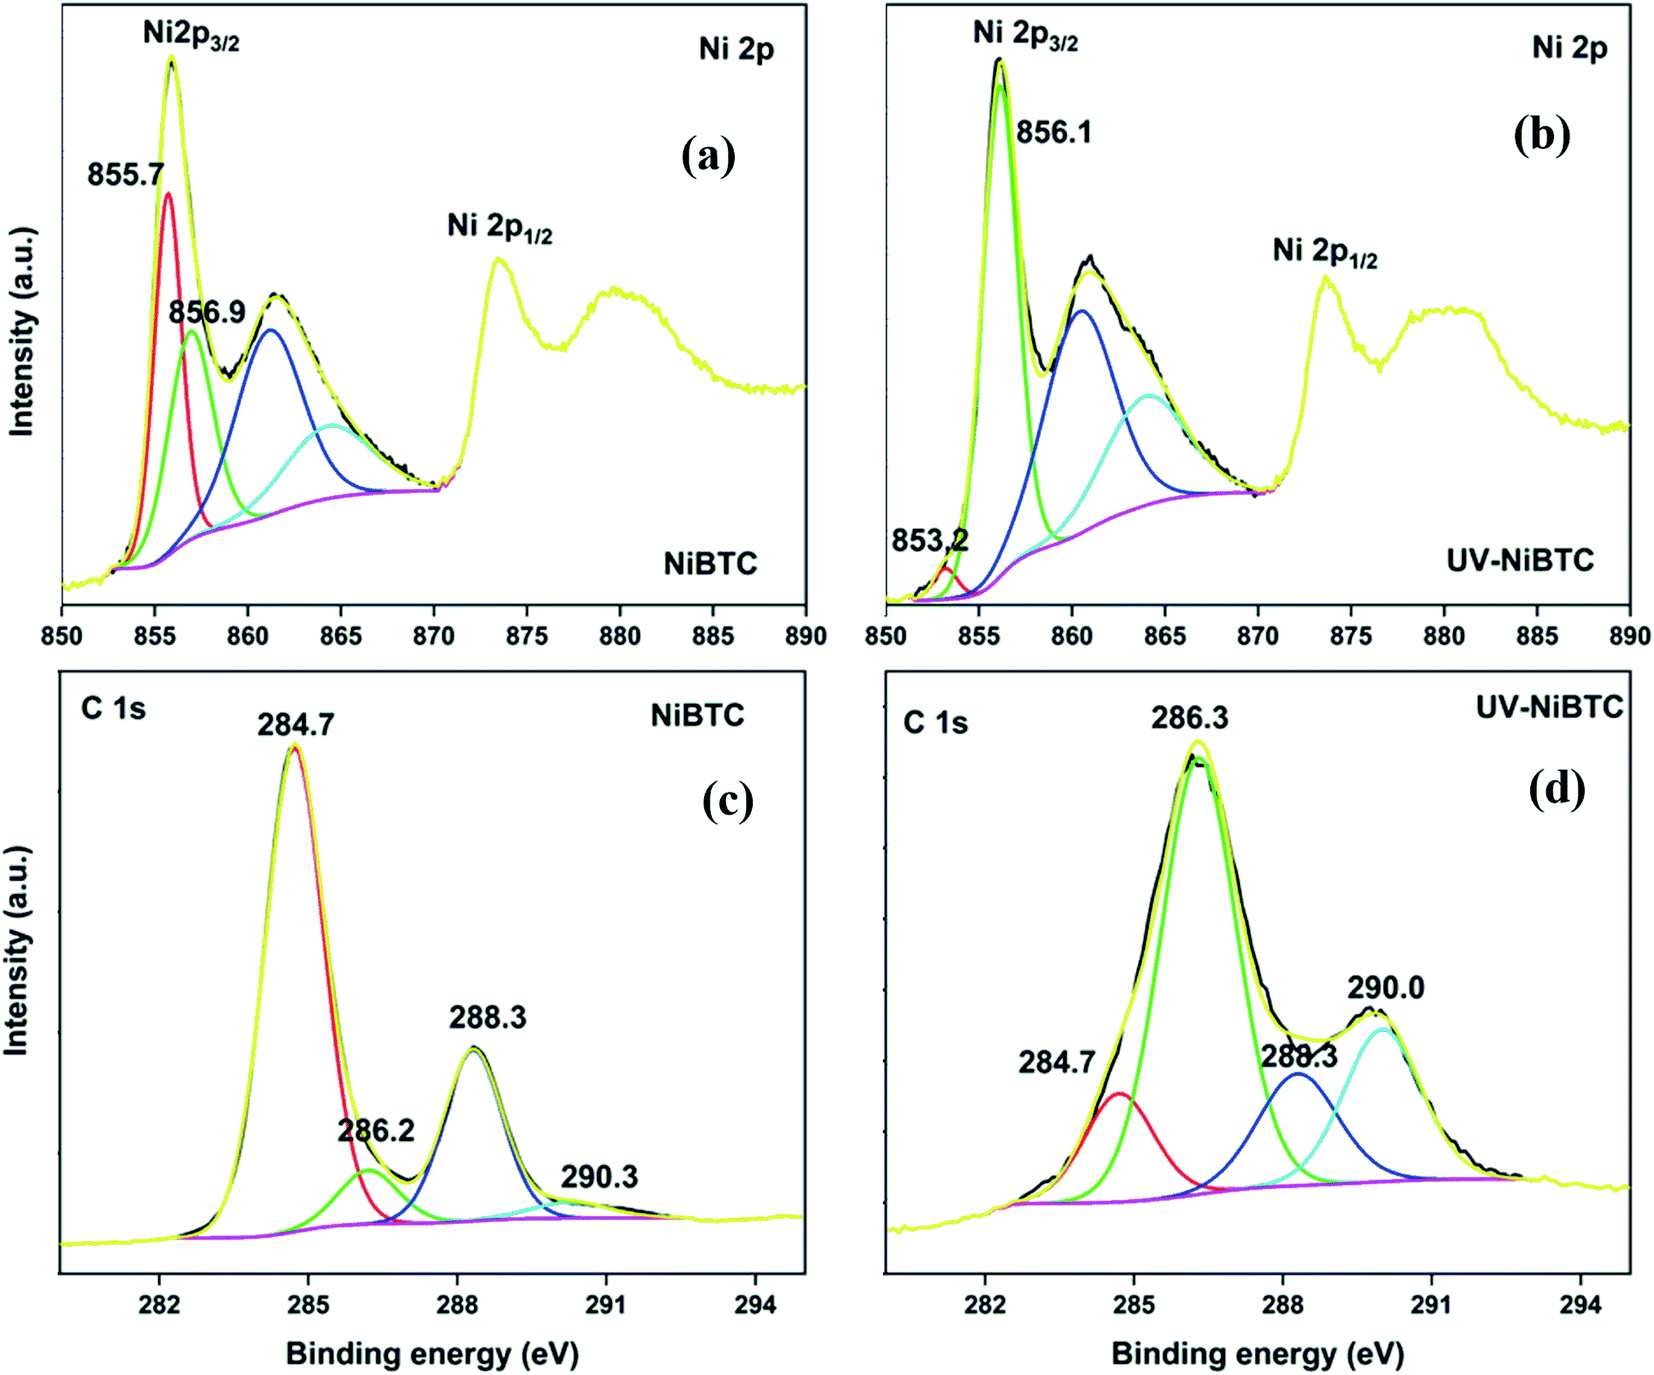 | ||
| Fig. 9 HRXPS Ni 2p spectra of (a) NiBTC; (b) UV-NiBTC; HRXPS C 1s spectra of (c) NiBTC; (d) UV-NiBTC. | ||
The XPS study suggested that the terephthalate-based MOFs have a better resistance against ligand decomposition, though decarboxylation is probable. Whereas, trimesate-MOFs are highly prone to ligand decomposition with the possibility of decarboxylation, which could not be traced well due to the C–O contributions from ligand decomposition. Moreover, redox behavior was observed in all the transition metal MOFs after UV-irradiation. The overall impression from the study is that the terephthalate-based MOFs have a higher photostability as compared to the corresponding trimesate-based MOFs.
4. Conclusion
In summary, we have reported a fast synthesis of terephthalate and trimesate MOFs of Mn, Co, and Ni via ultrasonication method using freshly prepared metal hydroxides as precursors. Some of the synthesized MOFs matched with the reported one, whereas, some new PXRD patterns were recorded for trimesate MOFs due to a low metal-to-ligand ratio of 1:1, instead of 1.5:1.0. The synthesized MOFs were irradiated under an 80 W UV source for 40 h to evaluate their photostability. Routine characterization technique like PXRD was partially successful in tracing the structural changes arising from UV exposure. The surface area and porosity of MOFs decreased under the effect of UV, except for CoBTC. The XPS analysis predicted significant changes in the oxidation state of metal nodes for many MOFs with the presence of Ni3+ as a dominant species in the Ni-based MOFs. Moreover, XPS spectroscopy could trace ligand decomposition and decarboxylation in trimesate and terephthalate-based MOFs, respectively. Based on the study, it was conclusive that terephthalate MOFs were more photostable than trimesate MOFs. Thus, the study presents one of the first views on the photostability of Mn, Co, and Ni-based MOFs through spectroscopic investigations.
Author contributions
N. K. G. was responsible for conceptualization, formal analysis, software, writing original draft, and review and editing. S. K. did the characterization of materials. J. B. and K. S. K were responsible for funding acquisition, investigation, project administration, resources, and supervision.Conflicts of interest
There are no conflicts to declare.Acknowledgements
The authors are very grateful for the funds [Project #20210451-001] provided by the “Korea Institute of Civil Engineering and Building Technology” (KICT), Republic of Korea.References
- Q. Wang and D. Astruc, Chem. Rev., 2020, 120, 1438–1511 CrossRef CAS PubMed.
- A. Kirchon, L. Feng, H. F. Drake, E. A. Joseph and H.-C. Zhou, Chem. Soc. Rev., 2018, 47, 8611–8638 RSC.
- C. Petit, Curr. Opin. Chem. Eng., 2018, 20, 132–142 CrossRef.
- J.-D. Xiao and H.-L. Jiang, Acc. Chem. Res., 2019, 52, 356–366 CrossRef CAS PubMed.
- J. Twilton, C. Le, P. Zhang, M. H. Shaw, R. W. Evans and D. W. C. MacMillan, Nat. Rev. Chem., 2017, 1, 0052 CrossRef CAS.
- M. A. Nasalevich, C. H. Hendon, J. G. Santaclara, K. Svane, B. van der Linden, S. L. Veber, M. V. Fedin, A. J. Houtepen, M. A. van der Veen, F. Kapteijn, A. Walsh and J. Gascon, Sci. Rep., 2016, 6, 23676 CrossRef CAS PubMed.
- D. Mateo, A. Santiago-Portillo, J. Albero, S. Navalón, M. Alvaro and H. García, Angew. Chem., Int. Ed., 2019, 58, 17843–17848 CrossRef CAS PubMed.
- A. Dhakshinamoorthy, A. M. Asiri and H. García, Angew. Chem., Int. Ed., 2016, 55, 5414–5445 CrossRef CAS PubMed.
- D. Wang and Z. Li, Res. Chem. Intermed., 2017, 43, 5169–5186 CrossRef CAS.
- S. Zheng, X. Li, B. Yan, Q. Hu, Y. Xu, X. Xiao, H. Xue and H. Pang, Adv. Energy Mater., 2017, 7, 1602733 CrossRef.
- Q. Sun, M. Liu, K. Li, Y. Han, Y. Zuo, F. Chai, C. Song, G. Zhang and X. Guo, Inorg. Chem. Front., 2017, 4, 144–153 RSC.
- J. E. Bachman, M. T. Kapelewski, D. A. Reed, M. I. Gonzalez and J. R. Long, J. Am. Chem. Soc., 2017, 139, 15363–15370 CrossRef CAS PubMed.
- J. Wang, S. Zhou, C. Chen, L. Lu, B. Li, W. Hu, A. Kumar and M. Muddassir, Dyes Pigm., 2021, 187, 109068 CrossRef CAS.
- P. Salcedo-Abraira, S. M. F. Vilela, A. A. Babaryk, M. Cabrero-Antonino, P. Gregorio, F. Salles, S. Navalón, H. García and P. Horcajada, Nano Res., 2021, 14, 450–457 CrossRef.
- J. Wang, D. Zhou, G.-L. Wang, L. Lu, Y. Pan, A. Singh and A. Kumar, Inorg. Chim. Acta, 2019, 492, 186–191 CrossRef CAS.
- Y. C. López, H. Viltres, N. K. Gupta, P. Acevedo-Peña, C. Leyva, Y. Ghaffari, A. Gupta, S. Kim, J. Bae and K. S. Kim, Environ. Chem. Lett., 2021 DOI:10.1007/s10311-020-01119-1.
- A. Farrokhi, M. Jafarpour and M. Alipour, Polyhedron, 2019, 170, 325–333 CrossRef CAS.
- N. Sharma, A. K. Dey, R. Y. Sathe, A. Kumar, V. Krishnan, T. J. D. Kumar and C. M. Nagaraja, Catal. Sci. Technol., 2020, 10, 7724–7733 RSC.
- A. Kirchon, P. Zhang, J. Li, E. A. Joseph, W. Chen and H.-C. Zhou, ACS Appl. Mater. Interfaces, 2020, 12, 9292–9299 CrossRef CAS PubMed.
- B. Liu, K. Vikrant, K.-H. Kim, V. Kumar and S. K. Kailasa, Environ. Sci.: Nano, 2020, 7, 1319–1347 RSC.
- K. Wang, X.-L. Lv, D. Feng, J. Li, S. Chen, J. Sun, L. Song, Y. Xie, J.-R. Li and H.-C. Zhou, J. Am. Chem. Soc., 2016, 138, 914–919 CrossRef CAS PubMed.
- N. Tannert, S.-J. Ernst, C. Jansen, H.-J. Bart, S. K. Henninger and C. Janiak, J. Mater. Chem. A, 2018, 6, 17706–17712 RSC.
- P. Wu, M. Jiang, Y. Li, Y. Liu and J. Wang, J. Mater. Chem. A, 2017, 5, 7833–7838 RSC.
- J. Espín, L. Garzón-Tovar, A. Carné-Sánchez, I. Imaz and D. Maspoch, ACS Appl. Mater. Interfaces, 2018, 10, 9555–9562 CrossRef PubMed.
- X. Han, Q. Cheng, X. Meng, Z. Shao, K. Ma, D. Wei, J. Ding and H. Hou, Chem. Commun., 2017, 53, 10314–10317 RSC.
- J. Espín, L. Garzón-Tovar, G. Boix, I. Imaz and D. Maspoch, Chem. Commun., 2018, 54, 4184–4187 RSC.
- G.-Y. Jeong, A. K. Singh, M.-G. Kim, K.-W. Gyak, U. Ryu, K. M. Choi and D.-P. Kim, Nat. Commun., 2018, 9, 3968 CrossRef PubMed.
- N. K. Gupta, S. Kim, J. Bae and K. S. Kim, RSC Adv., 2021, 11, 4890–4900 RSC.
- N. K. Gupta, J. Bae, S. Kim and K. S. Kim, Chemosphere, 2021, 274, 129789 CrossRef CAS PubMed.
- A. Aarti, S. Bhadauria, A. Nanoti, S. Dasgupta, S. Divekar, P. Gupta and R. Chauhan, RSC Adv., 2016, 6, 93003–93009 RSC.
- S. Bordiga, C. Lamberti, G. Ricchiardi, L. Regli, F. Bonino, A. Damin, K.-P. Lillerud, M. Bjorgen and A. Zecchina, Chem. Commun., 2004, 2300–2301 RSC.
- H. K. Kim, W. S. Yun, M.-B. Kim, J. Y. Kim, Y.-S. Bae, J. Lee and N. C. Jeong, J. Am. Chem. Soc., 2015, 137, 10009–10015 CrossRef CAS PubMed.
- E. Borfecchia, S. Maurelli, D. Gianolio, E. Groppo, M. Chiesa, F. Bonino and C. Lamberti, J. Phys. Chem. C, 2012, 116, 19839–19850 CrossRef CAS.
- N. K. Gupta, Y. Ghaffari, S. Kim, J. Bae, K. S. Kim and M. Saifuddin, Sci. Rep., 2020, 10, 4942 CrossRef CAS PubMed.
- J. A. Kaduk, Acta Crystallogr. Sect. B Struct. Sci., 2002, 58, 815–822 CrossRef PubMed.
- M. Żyła, G. Smoła, A. Knapik, J. Rysz, M. Sitarz and Z. Grzesik, Corros. Sci., 2016, 112, 536–541 CrossRef.
- H.-M. Ma, J.-W. Yi, S. Li, C. Jiang, J.-H. Wei, Y.-P. Wu, J. Zhao and D.-S. Li, Inorg. Chem., 2019, 58, 9543–9547 CrossRef CAS.
- J. Hafizovic, M. Bjørgen, U. Olsbye, P. D. C. Dietzel, S. Bordiga, C. Prestipino, C. Lamberti and K. P. Lillerud, J. Am. Chem. Soc., 2007, 129, 3612–3620 CrossRef CAS.
- S. Kim, N. K. Gupta, J. Bae and K. S. Kim, J. Hazard. Mater., 2020, 384, 121274 CrossRef CAS PubMed.
- K. M. L. Taylor, W. J. Rieter and W. Lin, J. Am. Chem. Soc., 2008, 130, 14358–14359 CrossRef CAS PubMed.
- A. Nowacka, P. Briantais, C. Prestipino and F. X. Llabrés i Xamena, Cryst. Growth Des., 2019, 19, 4981–4989 CrossRef CAS.
- D. Cheng, M. A. Khan and R. P. Houser, Cryst. Growth Des., 2004, 4, 599–604 CrossRef CAS.
- C. Palomino Cabello, C. O. Arean, J. B. Parra, C. O. Ania, P. Rumori and G. Turnes Palomino, Dalton Trans., 2015, 44, 9955–9963 RSC.
- Z. Guo, Q. Zhang, Z. Cheng, Q. Liu, J. Zuo, B. Jin and R. Peng, ACS Sustainable Chem. Eng., 2020, 8, 4037–4043 CrossRef CAS.
- O. M. Yaghi, H. Li and T. L. Groy, J. Am. Chem. Soc., 1996, 118, 9096–9101 CrossRef CAS.
- S. Kumaraguru, R. Pavulraj and S. Mohan, Trans. IMF, 2017, 95, 131–136 CrossRef CAS.
- D. Saha and S. Deng, J. Colloid Interface Sci., 2010, 348, 615–620 CrossRef CAS.
- D. Saha and S. Deng, J. Phys. Chem. Lett., 2010, 1, 73–78 CrossRef CAS.
- G. Gumilar, Y. V. Kaneti, J. Henzie, S. Chatterjee, J. Na, B. Yuliarto, N. Nugraha, A. Patah, A. Bhaumik and Y. Yamauchi, Chem. Sci., 2020, 11, 3644–3655 RSC.
- H. Viltres, O. F. Odio, L. Lartundo-Rojas and E. Reguera, Appl. Surf. Sci., 2020, 511, 145606 CrossRef CAS.
- H. Gao, Y. Li, K. Park and J. B. Goodenough, Chem. Mater., 2016, 28, 6553–6559 CrossRef CAS.
- A. C. Elder, S. Bhattacharyya, S. Nair and T. M. Orlando, J. Phys. Chem. C, 2018, 122, 10413–10422 CrossRef CAS.
- T.-J. Wang, X. Liu, Y. Li, F. Li, Z. Deng and Y. Chen, Nano Res., 2020, 13, 79–85 CrossRef CAS.
- A. F. Carley, S. D. Jackson, J. N. O'Shea and M. W. Roberts, Surf. Sci., 1999, 440, L868–L874 CrossRef CAS.
Footnote |
| † Electronic supplementary information (ESI) available. See DOI: 10.1039/d1ra00181g |
| This journal is © The Royal Society of Chemistry 2021 |