DOI:
10.1039/D0RA10224E
(Paper)
RSC Adv., 2021,
11, 8940-8950
A catalytic mechanism investigation of TiF3 on hydriding/dehydriding properties of Mg85Cu5Ni10 alloy
Received
4th December 2020
, Accepted 23rd February 2021
First published on 1st March 2021
Abstract
In this research, Mg85Cu5Ni10–x wt% TiF3 (x = 0, 2, 4, 6, 8) alloys were synthetized via ball milling and the catalytic mechanism of TiF3 on hydrogenation and dehydrogenation of Mg85Cu5Ni10 was studied. The microstructure, hydriding/dehydriding kinetics and thermodynamics of the alloys were discussed in detail. The TiF3 catalyzed alloys have faster hydriding/dehydriding kinetics and lower thermodynamic stability. After hydrogen absorption and desorption, TiF3 decomposes into TiH2 and MgF2. TiF3, TiH2 and MgF2 promote to forming crystal defects, dislocations, grain boundaries and nanocrystals which are advantageous to speeding up the rate of hydrogen absorption and desorption. The dehydrogenation activation energy Ea(de) and dehydrogenation enthalpy ΔH(de) are reduced to 81.462 from 116.767 kJ mol−1 and 72.456 from 93.372 kJ mol−1 respectively by 6 wt% TiF3. An appropriate amount of TiF3 can improve the hydriding/dehydriding kinetics and thermodynamics of Mg85Cu5Ni10.
Introduction
Energy is an important material basis for the survival and development of human society.1,2 The rapid development of modern industry relies on the use of a large number of fossil fuels. Basically, our life and work are inseparable from fossil fuels. Nevertheless, all fossil fuels are non-renewable. In addition, environmental pollution and extreme climate change caused by fossil fuels make human beings face severe challenges. At present, all countries around the world are considering carbon emission reduction by reducing the use of fossil fuels and developing and using renewable energy. Therefore, the development of clean and efficient new energy has become an important issue for all countries, which is also an important guarantee to solve the energy crisis and human survival.3–9 So far, there are many new energies that can replace traditional fossil fuels, including solar energy, wind energy, tidal energy, geothermal energy, nuclear energy, and hydrogen energy. Considering the factors of manufacture, transportation, safety, reliability, and environmental friendliness, hydrogen energy is one of the best choices. Since the 1990s, Japan, the United States, and some European countries have carried out hydrogen research and development plans. Toyota launched the second generation Mirai hydrogen fuel cell vehicle in 2019, marking that the fuel cell electric vehicle (FCEV) technology had entered a new stage. Nevertheless, there are still some important technical problems for the hydrogen energy system to fully implement and replace fossil fuels.10–17 The first is cheap and mass-produced hydrogen production technology. The second is hydrogen storage and transportation. The third is to convert hydrogen into electricity and heat energy safely and efficiently in the application process. Among them, high-density, low-cost, safe, and high efficiency hydrogen storage technology are the key links of large-scale use of hydrogen energy.18–20
The advantages of the metal hydride hydrogen storage method are high hydrogen storage capacity, no need for high pressure and heat insulation container and good safety compared with the traditional gas and liquid hydrogen storage methods.21,22 Among many metal hydride hydrogen storage materials, magnesium has a high reversible hydrogen storage capacity (7.6 wt%) which attracts many scholars' interest.23–26 Besides, magnesium has a low price, abundant reserves, excellent heat resistance, good recyclability, and can form solid solution with other elements in equilibrium state. Unfortunately, MgH2 has high thermal stability and needs high temperature to release hydrogen, and the rate of hydrogenation/dehydrogenation evolution is relatively slow, which limits its wide application. Many scholars have improved the poor dynamic and thermodynamic properties of magnesium based alloys by alloying, nanocrystallization and amorphization.27 Generally, transition metal elements or rare earth elements are used to alloy with magnesium to ameliorate the hydrogen storage performance. Yuan et al.28 synthetized Sm5Mg41 and found that its initial dehydriding temperature was 270 °C indicating that alloying with Sm reduced the thermal stability of hydrides. Some studies have shown that nanocrystallization can effectively ameliorate the kinetics of hydriding and dehydriding of magnesium. This is because nanoparticles and nanocrystals have many interfaces. The channel effect and surface effect introduced by nanocrystallization shorten the diffusion distance of hydrogen in the particles, reduce the time of hydrogenation reaction, and accelerate the rate of hydrogen absorption and desorption. Liu et al.29 prepared Mg–6.9 at% Zn ultrafine particles via hydrogen plasma-metal reaction method. They demonstrated that the Mg–Zn nanoparticles could absorb 5.0 wt% H2 at 300 °C in 20 min with 56.3 kJ mol−1 hydrogen absorption activation energy. Furthermore, amorphization by mechanical ball milling and vacuum rapid cooling technology also could improve hydrogen storage performance of magnesium. Zhang et al.30 synthesized (Mg24Ni10Cu2)100−xNdx (x = 0, 5, 10, 15, 20) alloy through rapidly quenched under vacuum and found the alloy with amorphous structure had good electrochemical performance. Moreover, it is easy to add all kinds of catalysts during ball milling to prepare composite materials. As a catalyst, TiF3 is often used to improve the hydrogen storage properties of magnesium based alloys. N. S. Mustafa and M. Ismail31 investigated the effect of TiF3 on the performance of 2NaAlH4–Ca(BH4)2 hydrogen storage properties and they found that the addition of TiF3 reduced the onset decomposition temperature and the ab/desorption kinetic was also improved as compared to the undoped composite. N. N. Sulaiman32 studied the H2 storage properties of MgH2/Cd–TiF3 for the first time. The sorption properties of MgH2/Cd were improved after adding with TiF3. EA for hydrogen desorption of doped composite was lowered to 107.0 kJ mol−1. In addition, our study has proved that TiF3 significantly improved the kinetics of hydrogen absorption and desorption of Mg85Zn5Ni10 alloy, and reduced the dehydrogenation activation energy to 75.514 kJ mol−1.12 Therefore, we choose TiF3 as catalyst to study the catalytic effect on the hydrogen storage properties of Mg–Cu–Ni alloy.
In this investigation, we prepared Mg–Cu–Ni alloy with TiF3 catalyst to study the hydrogen storage properties and catalytic mechanism. The hydriding/dehydriding kinetics and thermodynamics were investigated in detail. The microstructure and characterization were tested and observed by XRD, SEM and HRTEM. The dehydrogenation activation energy, entropy and enthalpy were also fitted and calculated.
Experimental
First of all, the as-cast Mg85Cu5Ni10 alloy was smelted. We used a vacuum induction furnace to prepare the as-cast Mg85Cu5Ni10 alloy under 0.04 MPa He atmosphere as the protective gas. As a result of the high vapor pressure of Mg, it is very easy to burn and volatilize during smelting. According to smelting experience, more 10 wt% Mg was mixed in the smelting process in order to guarantee the designed composition of the as-cast Mg85Cu5Ni10 alloy. Subsequently, the as-cast Mg85Cu5Ni10 alloy was crushed into powders (particle size < 75 μm) mechanically. Finally, the Mg85Cu5Ni10 powders and different contents of TiF3 (produced by Thermo Fisher Technology (China) Co., Ltd) were mixed to ball mill by a planetary-type mill (Made by Instrument Factory of Nanjing University) under Ar atmosphere. The contents of TiF3 were 0, 2, 4, 6 and 8 wt%. The ball to powder was 40![[thin space (1/6-em)]](https://www.rsc.org/images/entities/char_2009.gif) :
:![[thin space (1/6-em)]](https://www.rsc.org/images/entities/char_2009.gif) 1. The milling speed was 350 rpm. In consideration of excess heating caused by milling, the mill process was rested for 1 h after every 1 h working. The total milling time was 5 h. All the block metal materials in this experiment were provided by China Iron & Steel Research Institute Group.
1. The milling speed was 350 rpm. In consideration of excess heating caused by milling, the mill process was rested for 1 h after every 1 h working. The total milling time was 5 h. All the block metal materials in this experiment were provided by China Iron & Steel Research Institute Group.
Hydrogen absorption/desorption kinetics of Mg85Cu5Ni10–x wt% TiF3 (x = 0, 2, 4, 6, 8) alloys were measured by a Sieverts-type apparatus (made by General Research Institute for Nonferrous Metals). At the beginning of tests, all the samples were absorbed and desorbed hydrogen for several cycles to activate completely. Hydrogenation was tested at a pressure of 3 MPa from 100 to 360 °C, and dehydrogenation was tested at a pressure of 1 × 10⁻⁴ MPa from 240 to 360 °C. The purities of He, Ar and H2 gases were 99.999% supplied by China Iron & Steel Research Institute Group.
Phase structures, morphologies and crystalline states of Mg85Cu5Ni10–x wt% TiF3 (x = 0, 2, 4, 6, 8) alloys were detected and observed by X-ray diffraction (XRD) (D/max/2400) using CuKα radiation with scanning rate of 2° min−1, scanning electron microscopy (SEM) (QUANTA 400), scanning electron microscopy (SEM) (QUANTA 400) and high resolution transmission electron microscope (HRTEM) (JEM-2100F).
Results and discussion
Microstructural characteristics
X-ray diffraction (XRD) was used for clarifying the phase composition and hydrogenation and dehydrogenation reaction mechanism of Mg85Cu5Ni10–x wt% TiF3 (x = 0, 2, 4, 6, 8) alloys. Fig. 1 describes the XRD patterns of Mg85Cu5Ni10–x wt% TiF3 (x = 0, 4, 8) alloys after ball milling, hydrogenation and dehydrogenation. Because the patterns of Mg85Cu5Ni10–x wt% TiF3 (x = 2, 4, 6, 8) alloys are basically similar, in order to facilitate displaying and reading, Fig. 1 only shows the XRD patterns of Mg85Cu5Ni10–x wt% TiF3 (x = 0, 4, 8) alloys. As shown in Fig. 1(a), after ball milling, catalyst TiF3 did not decompose. Mg85Cu5Ni10–0 wt% TiF3 consists of Mg, Mg2Ni and Mg2Cu. Mg85Cu5Ni10–x wt% TiF3 (x = 2, 4, 6, 8) alloys are composed of Mg, Mg2Ni, Mg2Cu and TiF3. The little broadened diffraction peaks show that ball milling refines the alloy particles. According to Fig. 1(b), the Mg, Mg2Ni and Mg2Cu in Mg85Cu5Ni10–0 wt% TiF3 become into MgH2, Mg2NiH4 and MgCu2 respectively after hydriding. However, the TiF3 decomposes into TiH2 and MgF2 in the catalyzed Mg85Cu5Ni10 alloys after hydrogenation with the formation of MgH2, Mg2NiH4 and MgCu2. From Fig. 1(c), MgH2, Mg2NiH4 and MgCu2 change into Mg, Mg2Ni and Mg2Cu respectively after dehydriding, meanwhile, the TiH2 and MgF2 still exist in the alloys. It indicates that the thermodynamic properties of TiH2 and MgF2 are stable and do not decompose under the condition of dehydrogenation evolution in this experiment. On the basis of analysis above, the possible hydriding/dehydriding mechanism of Mg85Cu5Ni10–x wt% TiF3 (x = 0, 2, 4, 6, 8) alloys are:
| 2Mg2Cu + 3H2 ↔ MgCu2 + 3MgH2 |
| 2TiF3 + 3Mg + 2H2 → 2TiH2 + 3MgF2. |
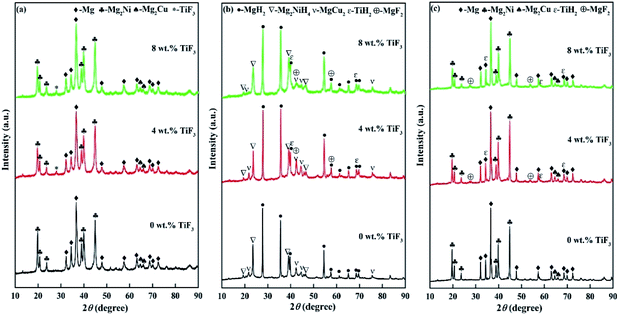 |
| | Fig. 1 XRD patterns of Mg85Cu5Ni10–x wt% TiF3 (x = 0, 4, 8) alloys: (a) before hydrogen absorption, (b) after hydrogen absorption, (c) after hydrogen desorption. | |
High resolution transmission electron microscope (HRTEM) was selected to further study the phase transition and microstructure of Mg85Cu5Ni10–x wt% TiF3 (x = 0, 2, 4, 6, 8) alloys before and after hydriding and dehydriding. Fig. 2 shows the TEM images of Mg85Cu5Ni10–0 wt% TiF3 and Mg85Cu5Ni10–4 wt% TiF3 after hydrogenation and dehydrogenation. On the basis of Fig. 2(a) and (b), Mg85Cu5Ni10–0 wt% TiF3 consists of MgH2, Mg2NiH4 and MgCu2 after hydriding. After dehydriding, it contains Mg, Mg2Ni and Mg2Cu, which is consistent with the results of XRD analysis in the previous section. Instead, Mg85Cu5Ni10–4 wt% TiF3 is composed of MgH2, Mg2NiH4, MgCu2, TiH2 and MgF2 after hydrogenation indicating that the catalyst TiF3 decomposes into TiH2 and MgF2 during hydriding process from Fig. 2(c). Meanwhile, according to Fig. 2(d), Mg85Cu5Ni10–4 wt% TiF3 contains Mg, Mg2Ni, Mg2Cu, TiH2 and MgF2 after dehydrogenation suggesting that TiH2 and MgF2 still exist in the alloy. The TEM image further proves that for Mg85Cu5Ni10 alloy, the catalyst TiF3 decomposes and forms stable TiH2 and MgF2 during the hydrogen absorption and desorption. Furthermore, we can observe the existence of crystal defects, dislocations, grain boundaries, nanocrystals and amorphous illustrating that after ball milling for 5 hours with catalyst TiF3, the microstructure of Mg85Cu5Ni10 alloy changes obviously after hydriding and dehydriding cycles. TiF3 promotes the formation of nanocrystals on the surface of Mg85Cu5Ni10 alloy and introduces high density grain boundaries.
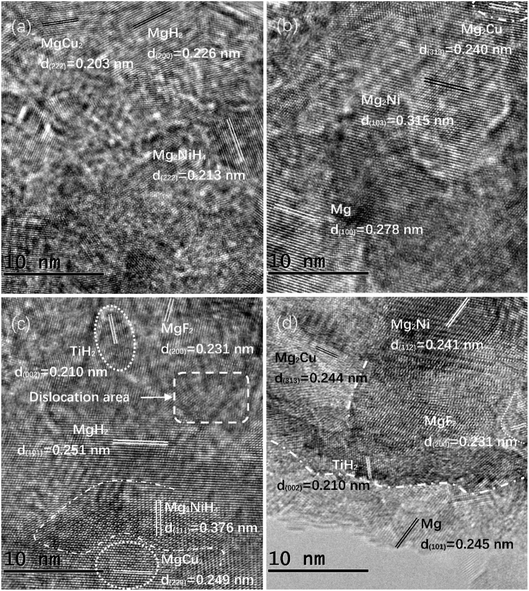 |
| | Fig. 2 HRTEM micrographs of Mg85Cu5Ni10–0 wt% TiF3 and Mg85Cu5Ni10–4 wt% TiF3 after hydrogen absorption (a) and (c), after hydrogen desorption (b) and (d). | |
Fig. 3 shows the SEM images of Mg85Cu5Ni10–0 wt% TiF3 and Mg85Cu5Ni10–4 wt% TiF3 after ball milling, after hydrogen absorption and after hydrogen desorption. From Fig. 3, the alloys particles present irregular spheres. After ball milling, the particle diameter is about 30 μm. However, Mg85Cu5Ni10–0 wt% TiF3 particles agglomerate, and Mg85Cu5Ni10–4 wt% TiF3 particles are pulverized after hydriding and dehydriding. It indicates that TiF3 is helpful to refine alloy particles during hydriding and dehydriding cycles which is beneficial to increase the contact area of hydrogen absorption and desorption reaction. In addition, after the cycles of hydrogen absorption and desorption, some cracks appear on the surface of the particles. Our previous study has confirmed that these cracks contribute to accelerating the rate of hydrogen absorption and desorption.12,27 In addition, it is worth noting that TiF3 decomposes into TiH2 and MgF2 during hydriding and dehydriding process of Mg85Cu5Ni10, while in our previously published work,12 TiF3 does not decompose in Mg85Zn5Ni10. It may be due to fact that MgZn2 is a stable phase in Mg85Zn5Ni10 alloy while there is a transformation between Mg2Cu and MgCu2 in Mg85Cu5Ni10 alloy during hydrogenation and dehydrogenation. The stable MgZn2 and transformation between Mg2Cu and MgCu2 may explain the decomposition of TiF3 in Mg–Cu–Ni alloy. There is a small amount of excess Mg appearing in the Mg2Cu and MgCu2 transformation process, making Ti and F reacting with Mg and H to form MgF2 and TiH2.
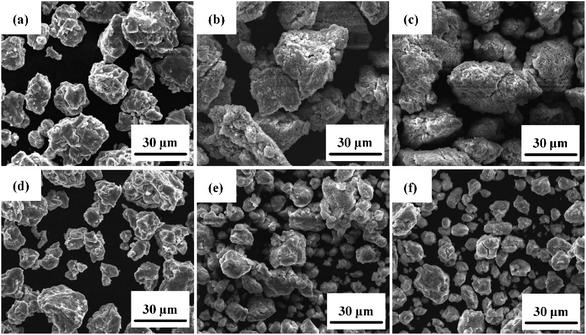 |
| | Fig. 3 SEM images of Mg85Cu5Ni10–0 wt% TiF3 and Mg85Cu5Ni10–4 wt% TiF3 after ball milling (a) and (d), after hydrogen absorption (b) and (e), after hydrogen desorption (c) and (f). | |
Kinetic properties of hydrogenation and dehydrogenation
In order to study the effect of TiF3 on the kinetics of hydrogen absorption and desorption of Mg85Cu5Ni10, the kinetics of hydriding and dehydriding of Mg85Cu5Ni10–x wt% TiF3 (x = 0, 2, 4, 6, 8) alloys was measured at different temperatures after fully activating. Fig. 4(a)–(e) describe the hydrogenation curves of Mg85Cu5Ni10–x wt% TiF3 (x = 0, 2, 4, 6, 8) alloys from 100 to 360 °C. All five alloys have very fast hydrogen absorption rates at high temperatures, and all of them can basically reach the saturation state in a short time on the basis of Fig. 4. However, with the decrease of hydrogen absorption temperature, the kinetic properties of the five alloys are gradually different. According to Fig. 4(a), Mg85Cu5Ni10–0 wt% TiF3 has a rapid hydrogen absorption rate when the temperature is higher than 320 °C. When the temperature is at the range of 300–200 °C, the hydrogen absorption rate and capacity of Mg85Cu5Ni10–0 wt% TiF3 decrease along with temperature decreasing. The hydrogen absorption speed and capacity of Mg85Cu5Ni10–0 wt% TiF3 decrease obviously when the temperature is lower 200 °C. However, the TiF3 catalyzed alloys have faster hydrogen absorption rates when the temperature is lower than 300 °C. The results show that TiF3 improves the hydrogen absorption kinetics of Mg85Cu5Ni10 below 300 °C. The most intuitive embodiment is that the hydrogen absorption curves of the four TiF3 catalyzed alloys at the range of 300–200 °C are closer to those above 300 °C. Fig. 4(f) shows the time required to absorb 3 wt% hydrogen of Mg85Cu5Ni10–x wt% TiF3 (x = 0, 2, 4, 6, 8) alloys at 100 °C. Obviously, the times required for the four alloys containing TiF3 to absorb 3 wt% hydrogen are significantly shorter than that for Mg85Cu5Ni10–0 wt% TiF3 at 100 °C. It illustrates that TiF3 significantly improves and increases the hydrogen absorption rate of Mg85Cu5Ni10. However, due to the decomposition of TiF3 and the formation of TiH2 and MgF2, the saturated hydriding capacities of the alloys also decrease.
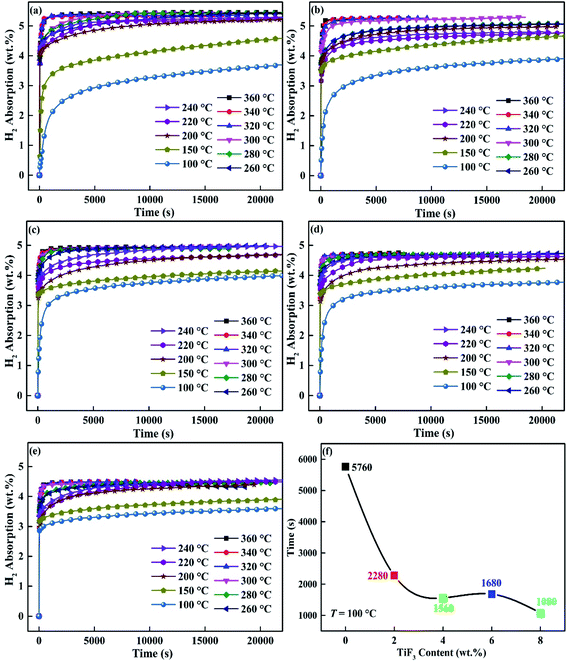 |
| | Fig. 4 Hydrogen absorption kinetic curves of Mg85Cu5Ni10–x wt% TiF3 (x = 2, 4, 6, 8) alloys at different temperatures: (a) x = 0; (b) x = 2; (c) x = 4; (d) x = 6; (e) x = 8 and the time required to absorb 3 wt% hydrogen at 100 °C (f). | |
Fig. 5 shows the dehydrogenation curves of Mg85Cu5Ni10–x wt% TiF3 (x = 0, 2, 4, 6, 8) alloys from 240 to 360 °C. As Fig. 5 describing, temperature affects the dehydrogenation performance of the alloys very much. Mg85Cu5Ni10–x wt% TiF3 (x = 0, 2, 4, 6, 8) alloys can complete all hydrogen release in 10 min with fast rate of dehydriding over 320 °C. When the dehydrogenation temperature is 360 °C, the time required for complete dehydrogenation is 246 s, 144 s, 216 s, 150 s and 192 s respectively (Fig. 5(f)). The dehydrogenation time increases with the decrease of dehydrogenation temperature. Mg85Cu5Ni10–0 wt% TiF3 can completely release hydrogen in 25 min, while the TiF3 catalyzed alloys can completely dehydrogenate in 20 min at 300 °C. Mg85Cu5Ni10–0 wt% TiF3 only can release some hydrogen with more than 1 h, while the TiF3 catalyzed alloys can completely dehydrogenate in 50 min at 280 °C. When the dehydrogenation temperature is below 280 °C, all of the five alloys show poor dehydrogenation performance, and it takes a long time for partial dehydrogenation. The above results and analysis show that the dehydrogenation performance of Mg85Cu5Ni10 is obviously improved after TiF3 catalyzing.
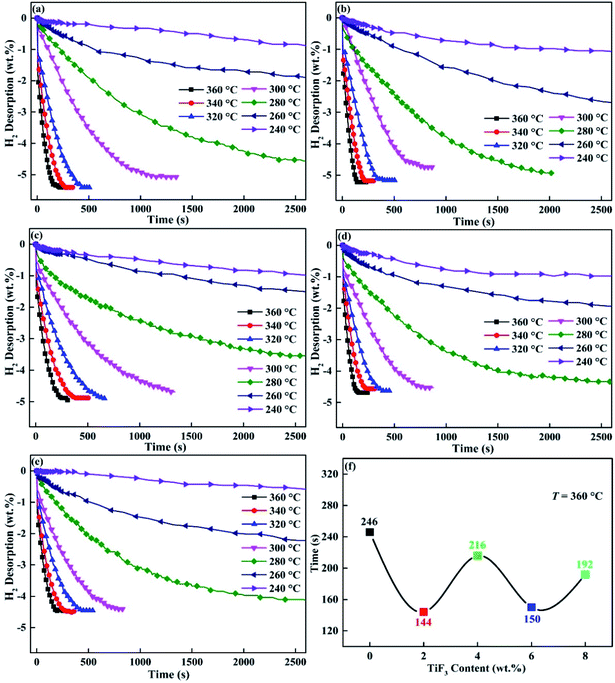 |
| | Fig. 5 Hydrogen desorption kinetic curves of Mg85Cu5Ni10–x wt% TiF3 (x = 2, 4, 6, 8) alloys at different temperatures: (a) x = 0; (b) x = 2; (c) x = 4; (d) x = 6; (e) x = 8 and the time required for complete dehydrogenation at 360 °C (f). | |
Hydrogenation and dehydrogenation cyclic stability
Fig. 6 and 7 express the hydrogenation and dehydrogenation cyclic stability curves of Mg85Cu5Ni10–x wt% TiF3 (x = 0, 2, 4, 6, 8) alloys at 360 °C. As shown in the images, there is nearly no change of hydrogen absorption and desorption capacities for Mg85Cu5Ni10–x wt% TiF3 (x = 0, 2, 4, 6, 8) alloys after 20 cycles. It takes a long time for the five alloys to absorb hydrogen for the first time due to the long process of activating alloys. However, the first dehydrogenation time of Mg85Cu5Ni10–x wt% TiF3 (x = 2, 4, 6, 8) alloys is shorter than that of Mg85Cu5Ni10–0 wt% TiF3 indicating that TiF3 shortens the first dehydrogenation. After the second cycle, the hydrogenation and dehydrogenation rates are obviously accelerated. With the increase of cycle times, the hydrogenation and dehydrogenation rates are gradually improved with good kinetics. The hydrogen absorbing and desorbing cyclic curves are almost identical. It illustrates that the decomposition of TiF3 does not affect the cyclic stability of the alloys. But it reduces the reversible hydrogen storage capacity. Because the decomposing of TiF3 and forming of TiH2/MgF2 can not react with hydrogen in this condition. Therefore, Mg85Cu5Ni10–x wt% TiF3 (x = 2, 4, 6, 8) alloys can not reach the theoretical saturated hydrogen storage capacities. The saturated hydrogen storage capacity decreases with the increase of TiF3 content. On the basis of Fig. 6 and 7, Mg85Cu5Ni10–x wt% TiF3 (x = 0, 2, 4, 6, 8) alloys still have good hydrogenation and dehydrogenation cyclic stability.
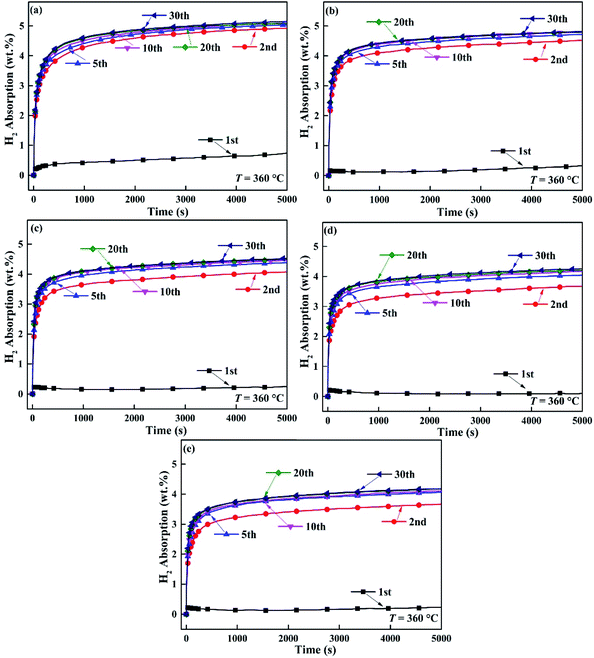 |
| | Fig. 6 Hydrogenation cycling curves of Mg85Cu5Ni10–x wt% TiF3 (x = 2, 4, 6, 8) alloys at 360 °C: (a) x = 0; (b) x = 2; (c) x = 4; (d) x = 6; (e) x = 8. | |
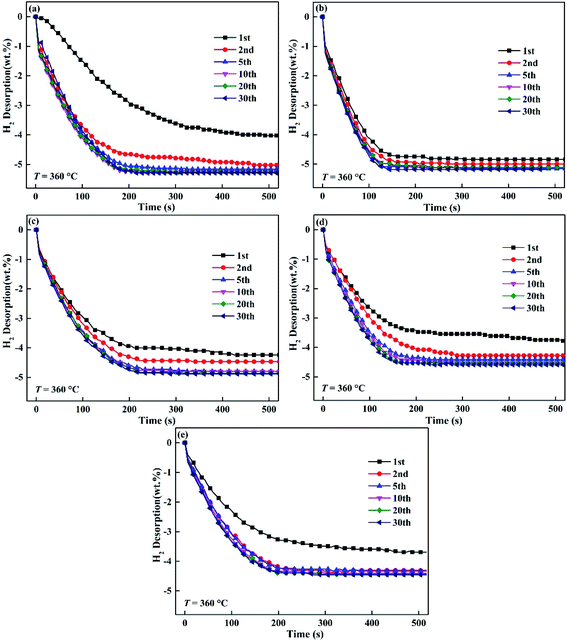 |
| | Fig. 7 Dehydrogenation cycling curves of Mg85Cu5Ni10–x wt% TiF3 (x = 2, 4, 6, 8) alloys at 360 °C: (a) x = 0; (b) x = 2; (c) x = 4; (d) x = 6; (e) x = 8. | |
Dehydrogenation activation energy
For further studying the catalytic effect of TiF3 on the dehydrogenation performance of Mg85Cu5Ni10, we calculated the dehydrogenation activation energy of Mg85Cu5Ni10–x wt% TiF3 (x = 0, 2, 4, 6, 8) alloys. The dehydrogenation activation energy is a key parameter to describe the dehydriding properties. The kinetic performance of dehydriding evolution is mainly determined by the energy barrier required by MgH2 changing to Mg by releasing H2. The dehydrogenation activation energy is the total energy needed to overcome. In general, the kinetic curve of dehydrogenation is fitted by JMA model, and the dehydrogenation activation energy Ea(de) can be calculated by Arrhenius method. Johnson–Mehl–Avrami (JMA) model is expressed by following equation:33–35| |
ln[−ln(1 − α)] = η![[thin space (1/6-em)]](https://www.rsc.org/images/entities/char_2009.gif) ln ln![[thin space (1/6-em)]](https://www.rsc.org/images/entities/char_2009.gif) k + η k + η![[thin space (1/6-em)]](https://www.rsc.org/images/entities/char_2009.gif) ln ln![[thin space (1/6-em)]](https://www.rsc.org/images/entities/char_2009.gif) t t
| (1) |
in this equation, α means the reaction fraction at time t, η represents the Avrami exponent reaction order and k indicates an effective kinetic parameter. Fig. 8 describes JMA curves of ln[−ln(1 − α)] vs. ln![[thin space (1/6-em)]](https://www.rsc.org/images/entities/char_2009.gif) t at different temperatures. The fitting line of JMA curve is almost linear, which illustrates that the dehydriding follows a three-dimensional growth process of instantaneous nucleation followed by interface control. The values of η and η
t at different temperatures. The fitting line of JMA curve is almost linear, which illustrates that the dehydriding follows a three-dimensional growth process of instantaneous nucleation followed by interface control. The values of η and η![[thin space (1/6-em)]](https://www.rsc.org/images/entities/char_2009.gif) ln
ln![[thin space (1/6-em)]](https://www.rsc.org/images/entities/char_2009.gif) k express the slope and intercept of JMA curve, from which the value of rate constant k can be determined. As a result, the dehydrogenation activation energy (Ea) can be calculated based on Arrhenius equation:36,37
k express the slope and intercept of JMA curve, from which the value of rate constant k can be determined. As a result, the dehydrogenation activation energy (Ea) can be calculated based on Arrhenius equation:36,37| |
k = A![[thin space (1/6-em)]](https://www.rsc.org/images/entities/char_2009.gif) exp[−Ea/RT] exp[−Ea/RT]
| (2) |
in this equation, A is a temperature independent coefficient, T represents the absolute temperature and R means universal gas constant. Fig. 8 also shows the Arrhenius plots and dehydrogenation activation energy Ea(de) of Mg85Cu5Ni10–x wt% TiF3 (x = 0, 2, 4, 6, 8) alloys. The dehydrogenation activation energy Ea(de) of Mg85Cu5Ni10–x wt% TiF3 (x = 0, 2, 4, 6, 8) alloys are 116.767, 95.749, 95.531, 81.462 and 89.971 kJ mol−1 respectively listed in Table 1. As a comparison, the dehydrogenation activation energy of MgH2 is 160 kJ mol−1. In our previous study,27 the dehydrogenation activation energy of as-cast Mg85Cu5Ni10 was 119.142 kJ mol−1, and the Ea(de) of Mg85Cu5Ni10–x wt% CeO2 (x = 0, 4, 8) alloys were 116.767, 84.824, and 81.211 kJ mol−1 respectively. According to the results above, TiF3 can decrease the dehydrogenation activation energy of Mg85Cu5Ni10 obviously. But there is a point worth noting, the dehydrogenation activation energy Ea(de) of Mg85Cu5Ni10–x wt% TiF3 (x = 0, 2, 4, 6, 8) alloys decreases first and then increases with the increase of TiF3 content. This may be due to the increase of TiF3 content, which leads to the increase of TiH2 and MgF2 contents, which cover the surface of the alloys, thus affecting the dehydriding evolution performance. In conclusion, TiF3 can significantly reduce the dehydrogenation activation energy Ea(de) and ameliorate the kinetic performance of Mg85Cu5Ni10.
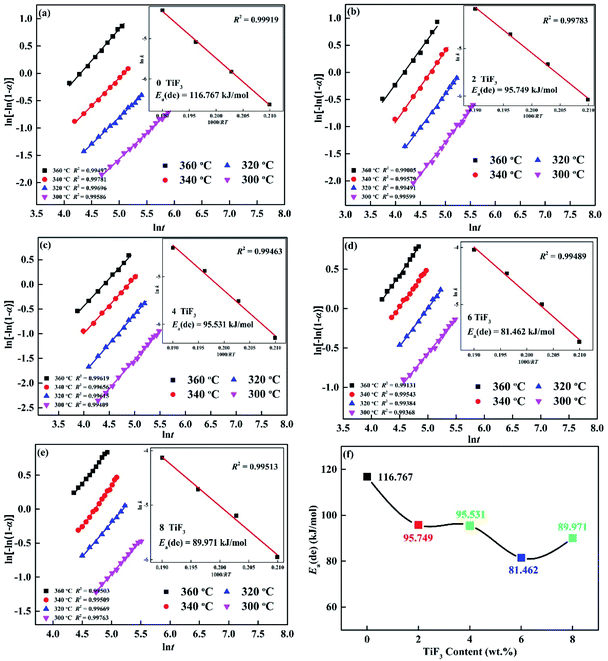 |
| | Fig. 8 JMA graphs of Mg85Cu5Ni10 + x wt% TiF3 (x = 0, 2, 4, 6, 8) alloys different temperatures: (a) x = 0; (b) x = 2; (c) x = 4; (d) x = 6; (e) x = 8 and Ea dehydrogenation (f). | |
Table 1 Hydrogen desorption activation energy (Ea(de)), enthalpy change (ΔH) and entropy change (ΔS) of Mg85Cu5Ni10–x wt% TiF3 (x = 0, 2, 4, 6, 8) alloys and as-cast Mg85Cu5Ni10
| Mg85Cu5Ni10–x wt% TiF3 |
Ea(de) (kJ mol−1) |
ΔHab (kJ mol−1) |
ΔSab (J mol−1 K−1) |
ΔHde (kJ mol−1) |
ΔSde (J mol−1 K−1) |
| As-cast Mg85Cu5Ni10 (ref. 27) |
119.142 |
−98.287 |
−166.292 |
98.892 |
165.755 |
| x = 0 |
116.767 |
−97.254 |
−155.682 |
93.372 |
151.331 |
| x = 2 |
95.749 |
−79.420 |
−135.903 |
80.114 |
134.065 |
| x = 4 |
95.531 |
−74.908 |
−126.432 |
77.227 |
129.059 |
| x = 6 |
81.462 |
−69.336 |
−118.058 |
72.465 |
121.317 |
| x = 8 |
89.971 |
−70.926 |
−121.503 |
77.911 |
131.419 |
Hydrogen storage thermodynamics
For investigating the hydrogen storage thermodynamics of Mg85Cu5Ni10–x wt% TiF3 (x = 0, 2, 4, 6, 8) alloys, the PCT curves were measured at 360, 340 and 320 °C shown in Fig. 9. All the five alloys almost absorb no hydrogen before reaching the platform pressure due to the front of each PCT curve is almost linear rise. When it reaches the plateau pressure with pressure increasing, the alloy begins to absorb a lot of hydrogen, and the first hydrogen absorption platform is formed. This platform belongs to Mg/MgH2 hydriding. With the continuous increase of hydrogen pressure, the amount of hydrogen absorption also increases slowly, and then a second hydrogen absorption platform appears which belongs to Mg2Ni/Mg2NiH4 hydriding. After that, the alloy reaches the saturated state with hydrogen pressure increasing. The dehydriding evolution is the opposite with the decrease of hydrogen pressure. Here we only discuss the pressure of the first platform pressure belonging to Mg/MgH2. According to the pressure value of platform pressure at different temperatures, the enthalpy change (ΔH) and entropy change (ΔS) can be calculated by the van't Hoff equation:38| | |
ln[P(H2)/P0] = ΔH/(RT) − ΔS/R
| (3) |
in this equation, P(H2) is the equilibrium hydrogen gas pressure, P0 means the standard atmospheric pressure, T represents the sample temperature and R expresses the gas constant, respectively. The van't Hoff plots, ΔH and ΔS are also shown in the inserted graphs in Fig. 9. On the basis of Fig. 9(f), the ΔH(de) of Mg85Cu5Ni10–x wt% TiF3 (x = 0, 2, 4, 6, 8) alloys is 93.372, 80.114, 77.227, 72.456 and 77.911 kJ mol−1 respectively shown in Table 1. For comparison, the ΔH(de) of as-cast Mg85Cu5Ni10 was 98.892 kJ mol−1 and the ΔH(de) of Mg85Cu5Ni10–x wt% CeO2 (x = 0, 4, 8) alloys were 92.441, 79.548, and 80.018 kJ mol−1 respectively.27 The ΔH(de) values of TiF3 catalyzed alloys are lower than that of as-cast Mg85Cu5Ni10 alloy and Mg85Cu5Ni10–0 wt% TiF3 illustrating that thermodynamic stability of the alloys decrease. Although TiF3 is decomposed into TiH2 and MgF2 during the hydrogen absorption and desorption cycles, some defects, grain boundaries and nano interfaces are also added. Because the bond energy of Mg–H bond at the grain boundary is relatively low, the thermodynamic properties of the alloys are improved.
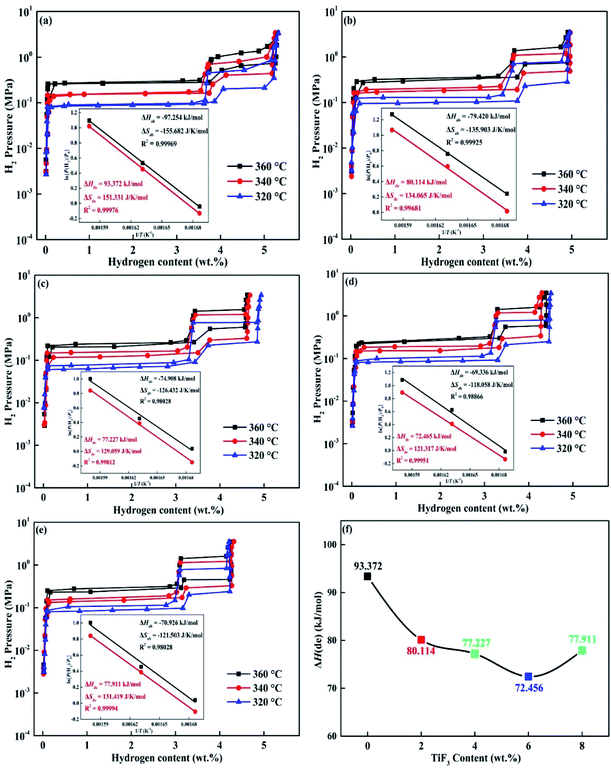 |
| | Fig. 9 PCT curves and corresponding van't Hoff plots of Mg85Cu5Ni10 + x wt% TiF3 (x = 0, 2, 4, 6, 8) alloys different temperatures: (a) x = 0; (b) x = 2; (c) x = 4; (d) x = 6; (e) x = 8 and enthalpy change (ΔH) of dehydrogenation (f). | |
Conclusions
Mg85Cu5Ni10–x wt% TiF3 (x = 0, 2, 4, 6, 8) alloys were prepared via ball milling. The compounds contained Mg, Mg2Ni, Mg2Cu and TiF3. The alloys catalyzed by TiF3 have faster hydriding/dehydriding kinetics and lower thermodynamic stability, even though TiF3 decomposes into TiH2 and MgF2 during hydriding and dehydriding. TiF3, TiH2 and MgF2 promote to forming crystal defects, dislocations, grain boundaries and nanocrystals which have a positive effect on accelerating the rate of hydrogen absorption and desorption. The dehydrogenation activation energy Ea(de) and dehydrogenation enthalpy ΔH(de) are reduced to 81.462 from 116.767 kJ mol−1 and 72.456 from 93.372 kJ mol−1 respectively by 6 wt% TiF3. An appropriate amount of TiF3 can improve the kinetics and thermodynamics of hydrogen absorption and desorption of Mg85Cu5Ni10.
Conflicts of interest
There are no conflicts to declare.
Acknowledgements
This work is financially supported by the National Natural Science Foundations of China (51901105 and 51871125), Natural Science Foundation of Inner Mongolia, China (No. 2019BS05005), and Inner Mongolia University of Science and Technology Innovation Fund (2019QDL-B11).
References
- K. Manickam, P. Mistry, G. Walker, D. Grant, C. E. Buckley, T. D. Humphries, M. Paskevicius, T. Jensen, R. Albert, K. Peinecke and M. Felderhoff, Int. J. Hydrogen Energy, 2019, 44, 7738–7745 CrossRef CAS.
- J. J. Liu, H. H. Cheng, S. M. Han, H. F. Liu and J. Huot, Energy, 2020, 192, 116617 CrossRef CAS.
- C. Milanese, T. R. Jensen, B. C. Hauback, C. Pistidda, M. Dornheim, H. Yang, L. Lombardo, A. Zuettel, Y. Filinchuk, P. Ngene, P. E. de Jongh, C. E. Buckley, E. M. Dematteis and M. Baricco, Int. J. Hydrogen Energy, 2019, 44, 7760–7774 CrossRef.
- S. Yasuoka, J. Ishida, K. Kishida and H. Inui, J. Power Sources, 2017, 346, 56–62 CrossRef CAS.
- Y. H. Zhang, M. Ji, Z. M. Yuan, W. G. Bu, Y. Qi and S. H. Guo, RSC Adv., 2017, 7, 37689–37698 RSC.
- X. Y. Chen, R. R. Chen, X. Ding, H. Z. Fang, X. Z. Li, H. S. Ding, Y. Q. Su, J. J. Guo and H. Z. Fu, Energy, 2019, 166, 587–597 CrossRef CAS.
- N. A. A. Majid, N. Maeda and M. Notomi, Int. J. Hydrogen Energy, 2019, 44, 29189–29195 CrossRef.
- B. Galey, A. Auroux, S. S. Etienne, M. Grellier, S. Dhaher and G. Postole, Sustainable Energy Fuels, 2018, 2, 2335–2344 RSC.
- F. A. H. Yap, N. N. Sulaiman and M. Ismail, Int. J. Hydrogen Energy, 2019, 44, 30583–30590 CrossRef.
- V. A. Yartys, M. Baricco, J. B. von Colbe, D. Blanchard and C. Zlotea, Int. J. Hydrogen Energy, 2019, 44, 7809–7859 CrossRef CAS.
- B. X. Dong, H. Tian, Y. C. Wu, F. Y. Bu, W. L. Liu and Y. L. Teng, Int. J. Hydrogen Energy, 2016, 41, 14507–14518 CrossRef CAS.
- Y. Yin, B. Li, Z. M. Yuan, Y. Qi and Y. H. Zhang, RSC Adv., 2018, 8, 34525–34535 RSC.
- İ. Muz and M. Atiş, J. Alloys Compd., 2016, 667, 275–281 CrossRef.
- Q. Luo, J. D. Li, B. Li, B. Liu, H. Y. Shao and Q. Li, J. Magnesium Alloys, 2019, 7, 58–71 CrossRef CAS.
- N. Lobo, A. Takasaki, K. Mineo, A. Klimkowicz and K. Goc, Int. J. Hydrogen Energy, 2019, 44, 29179–29188 CrossRef CAS.
- K. Kitabayashi, K. Edalati, H. W. Li, E. Akiba and Z. J. Horita, Adv. Energy Mater., 2020, 22, 1900027 CrossRef CAS.
- S. C. Gao, X. H. Wang, H. Z. Liu, T. He, Y. Y. Wang, S. Q. Li and M. Yan, J. Power Sources, 2019, 438, 227006 CrossRef CAS.
- J. Li, B. Li, H. Shao, W. Li and H. Lin, Catalyst, 2018, 8, 89 CrossRef.
- H. Zhang, X. Zheng, X. Tian, Y. Liu and X. Li, Prog. Nat. Sci.: Mater. Int., 2017, 27, 50–57 CrossRef CAS.
- K. Alsabawi, A. Mac, E. Gray and C. J. Webb, Int. J. Hydrogen Energy, 2019, 44, 2976–2980 CrossRef CAS.
- M. M. Hu, X. B. Xie, M. Chen, C. X. Zhu and T. Liu, J. Alloys Compd., 2020, 817, 152813 CrossRef CAS.
- M. Ismail, Y. F. A. Halim, N. N. Sulaiman and M. H. I. Ishak, J. Alloys Compd., 2016, 678, 297–303 CrossRef CAS.
- Z. M. Yuan, B. W. Zhang, Y. H. Zhang, S. H. Guo, X. P. Dong and D. L. Zhao, J. Mater. Sci. Technol., 2018, 34, 1851–1858 CrossRef.
- Z. M. Yuan, W. Zhang, P. L. Zhang, Y. H. Zhang, W. G. Bu, S. H. Guo and D. L. Zhao, RSC Adv., 2017, 7, 56365–56374 RSC.
- Y. H. Zhang, W. Zhang, J. L. Gao, Z. M. Yuan, W. G. Bu and Y. Qi, Acta Metall. Sin., 2017, 11, 10–18 Search PubMed.
- Y. H. Zhang, M. Ji, Z. M. Yuan, J. L. Gao, Y. Qi, X. P. Dong and S. H. Guo, J. Rare Earths, 2018, 36, 409–417 CrossRef CAS.
- Y. Yin, B. Li, Z. M. Yuan, Y. Qi and Y. H. Zhang, J. Rare Earths, 2020, 38, 983–993 CrossRef CAS.
- Z. M. Yuan, T. Yang, W. G. Bu, H. W. Shang, Y. Qi and Y. H. Zhang, Int. J. Hydrogen Energy, 2016, 41, 5994–6003 CrossRef CAS.
- T. Liu, T. W. Zhang, X. Z. Zhang and X. G. Li, Int. J. Hydrogen Energy, 2011, 36, 3515–3520 CrossRef CAS.
- Y. H. Zhang, T. Yang, W. G. Bu, Y. Cai, G. F. Zhang and D. L. Zhao, Trans. Nonferrous Met. Soc. China, 2013, 23, 3668–3676 CrossRef CAS.
- N. S. Mustafa and M. Ismail, Int. J. Hydrogen Energy, 2019, 44, 21979–21987 CrossRef CAS.
- N. N. Sulaiman and M. Ismail, Int. J. Hydrogen Energy, 2019, 44, 30574–30582 CrossRef CAS.
- M. Pourabdoli, S. Raygan, H. Abdizadeh and D. Uner, Int. J. Hydrogen Energy, 2013, 38, 11910–11919 CrossRef CAS.
- G. Barkhordarian, T. Klassen and R. Bormann, J. Alloys Compd., 2006, 407, 249–255 CrossRef CAS.
- L. J. Wei, H. Gu, Y. F. Zhu and L. Q. Li, Int. J. Hydrogen Energy, 2012, 37, 17146–17152 CrossRef CAS.
- T. Liu, Y. R. Cao, C. G. Qin, W. S. Chou and X. G. Li, J. Power Sources, 2014, 246, 277–282 CrossRef CAS.
- T. Kimura, H. Miyaoka, T. Ichikawa and Y. Kojima, Int. J. Hydrogen Energy, 2013, 38, 13728–13733 CrossRef CAS.
- H. Falahati and D. P. J. Barz, J. Hydrogen Energy, 2013, 38, 8838–8851 CrossRef CAS.
|
| This journal is © The Royal Society of Chemistry 2021 |
Click here to see how this site uses Cookies. View our privacy policy here.  Open Access Article
 *ab,
Yuanhong Qia,
Bo Lia,
Hu Gub,
Jinghui Zhaob,
Liqiang Jib,
Bo Zhangb,
Zeming Yuan
 *c and
Yanghuan Zhang
 ac
ac
![[thin space (1/6-em)]](https://www.rsc.org/images/entities/char_2009.gif) :
:![[thin space (1/6-em)]](https://www.rsc.org/images/entities/char_2009.gif) 1. The milling speed was 350 rpm. In consideration of excess heating caused by milling, the mill process was rested for 1 h after every 1 h working. The total milling time was 5 h. All the block metal materials in this experiment were provided by China Iron & Steel Research Institute Group.
1. The milling speed was 350 rpm. In consideration of excess heating caused by milling, the mill process was rested for 1 h after every 1 h working. The total milling time was 5 h. All the block metal materials in this experiment were provided by China Iron & Steel Research Institute Group.


![[thin space (1/6-em)]](https://www.rsc.org/images/entities/char_2009.gif) ln
ln![[thin space (1/6-em)]](https://www.rsc.org/images/entities/char_2009.gif) k + η
k + η![[thin space (1/6-em)]](https://www.rsc.org/images/entities/char_2009.gif) ln
ln![[thin space (1/6-em)]](https://www.rsc.org/images/entities/char_2009.gif) t
t
![[thin space (1/6-em)]](https://www.rsc.org/images/entities/char_2009.gif) t at different temperatures. The fitting line of JMA curve is almost linear, which illustrates that the dehydriding follows a three-dimensional growth process of instantaneous nucleation followed by interface control. The values of η and η
t at different temperatures. The fitting line of JMA curve is almost linear, which illustrates that the dehydriding follows a three-dimensional growth process of instantaneous nucleation followed by interface control. The values of η and η![[thin space (1/6-em)]](https://www.rsc.org/images/entities/char_2009.gif) ln
ln![[thin space (1/6-em)]](https://www.rsc.org/images/entities/char_2009.gif) k express the slope and intercept of JMA curve, from which the value of rate constant k can be determined. As a result, the dehydrogenation activation energy (Ea) can be calculated based on Arrhenius equation:36,37
k express the slope and intercept of JMA curve, from which the value of rate constant k can be determined. As a result, the dehydrogenation activation energy (Ea) can be calculated based on Arrhenius equation:36,37![[thin space (1/6-em)]](https://www.rsc.org/images/entities/char_2009.gif) exp[−Ea/RT]
exp[−Ea/RT]


