 Open Access Article
Pyridine-pyrazole based Al(III) ‘turn on’ sensor for MCF7 cancer cell imaging and detection of picric acid†
Sayan Saha‡
a,
Avik De‡ a,
Arijit Ghoshb,
Avik Ghoshc,
Kaushik Berad,
Krishna Sundar Dasa,
Sohel Akhtar
 a,
Nakul C. Maitid,
Abhijit Kumar Das
 c,
Benu Brata Dasb and
Raju Mondal
 *a
*a
aSchool of Chemical Sciences, Indian Association for the Cultivation of Science, Kolkata-700032, India. E-mail: icrm@iacs.res.in
bLaboratory of Molecular Biology, School of Biological Sciences, Indian Association for the Cultivation of Science, Kolkata-700032, India
cSchool of Mathematical & Computational Sciences, Indian Association for the Cultivation of Science, 2A & 2B, Raja S. C. Mullick Road, Jadavpur, Kolkata-700032, India
dStructural Biology and Bioinformatics Division, CSIR-Indian Institute of Chemical Biology, 4, Raja S.C. Mullick Road, Kolkata 700032, India
First published on 9th March 2021
Abstract
We report herein the development of a new pyridine-pyrazole based bis-bidentate asymmetric chemosensor that shows excellent turn-on chelation-enhanced Al3+-responsive fluorescence. The presence of two ‘hard’ phenolic hydroxyl groups plays a pivotal role in switching-on the sensing through coordination to the ‘hard’ Al3+ ion, while the mechanism can be interpreted by the chelation-enhanced fluorescence (CHEF) process. The X-ray single structure show a planar conjugated structure of the ligand, which was further stabilized by extensive H-bonding and π–π stacking. The photophysical studies related to the sensing behavior of the titular ligand toward aluminum was investigated in detail using various spectroscopic techniques like UV-Vis, photoluminescence, fluorescence and time-correlated single-photon count (TCSPC) and time-resolved NMR. The spectroscopic methods also confirm the selective detection of Al3+ ion in the presence of other metal ions. The theoretical calculations using Density Functional Theory (DFT) and the Time Dependent Density Functional Theory (TD-DFT) provide further insight on the mechanistic aspects of the turn-on sensing behavior including the electronic spectra of both the ligand and the complex. Interestingly, the as-synthesized H2DPC–Al complex can also be utilized as a fluorescence-based sensor for various nitroaromatics including picric acid, for which an INHIBIT logic gate can also be constructed. The as synthesized complex was subsequently used as a fluorescent probe for imaging of human breast adenocarcinoma (MCF7) cells using live cell confocal microscopic techniques.
Introduction
While the jury is still out on the potential health benefits of aluminum (Al) on the human body, it certainly bears the accusation of doing serious harm when somebody is exposed to larger-than-normal amounts.1–5 Al, being the most abundant metal in Earth's crust (8.3% by weight), occurs ubiquitously in the environment. Many things that we see and use in our daily life, ranging from basic household utensils, electrical equipment, cosmetics, to the aviation industry, are made of Al or its alloys.6–8 Al is also one of the most common and often indispensable components of medicine and extensively used in the pharmaceutical industry.9–11 Wide spread use of Al in various food additives and packaging industry further enhance the risk of oral exposure.12 The risk primarily comes from the fact that Al is a well-known neurotoxin and excess accumulation can lead to various neurodegenerative and neurological disorders.13–15 Two such well-documented detrimental effects of Al accumulation would be Parkinson's disease and Alzheimer's disease, for which to date the best solution relies on the philosophical remedy of “prevention is better than cure”.16–19 Naturally as preventive measures, precise sensing and quantitative estimation of Al remain the first and foremost step in the fight against Al-related diseases. It is noteworthy here that the permissible Al consumption limit set by the World Health Organization (WHO) is 7 mg per week per kg body weight, while that of the European Food Safety Authority (EFSA) is 1 mg per week per kg body weight.20,21The above points clearly underline the importance of designing selective and sophisticated yet easy techniques for sensing of Al in its most common trivalent state (Al3+).22 However, sensing of Al3+, because of its unique coordination and chemical characteristics, is somewhat different and challenging from other toxic metal sensing.23 Some of the major limitations include strong hydration enthalpy, poor coordination ability and lack of spectroscopic characteristics.24,25 Notwithstanding above limitations, a vast number of methods for Al-sensing have been developed over the years including atomic absorption spectrometry, inductively coupled plasma atomic emission spectrometry, mass spectrometry, electrochemical detection as well as 27Al NMR technologies.26,27 However, most of these methods suffer from serious limitations like time consuming lengthy experimentations, requirement of costly and sophisticated instruments.28,29 In contrast to these instrumental methods, optical sensing-based methods has recently gained immense interest for providing low-cost, time-saving, efficient, selective results.30,31
Among the optical sensing-based techniques, fluorescence based chemosensor has gained popularity in recent time due to cost effectiveness, ease of synthesis, robust, accurate, low detection limit.32,33 The essence of this method is to use a fluorescent probe as chemosensor which through metal-coordination “turn-on” the Al3+ responsive fluorescence.34,35 The method usually involves three popular mechanisms in inorganic chemistry: chelation-enhanced fluorescence, photoinduced electron transfer (PET) and metal–ligand charge transfer.36–38 Naturally, the successful execution of this method depends on the design of fluorescent probe and its metal–ligand coordination driven luminescent behaviour.39–41
The chelation-enhanced fluorescence of the resultant Al-compounds also exhibits various applications beyond chemosensing.42–45 One such popular application would be fluorescence-based bio-imaging and bio-labeling. The ‘turn-on’ fluorescent probes have widely been used to detect the Al-induced neurotoxicity in rodents and zebrafish.42,46,47
The change in luminescent behavior of Al-complexes upon addition of a chemical probe has turned out to be important tool for sensing and detection itself.48 The most common examples include the ‘turn-off’ or fluorescence quenching based detection of electron deficient nitroaromatics.49 Of particular importance is the detection of picric acid (PA) because of its ambivalent significances. On one hand, picric acid is an essential multipurpose ingredient used in various fields like rocket fuel, leather industry or antiseptic agent.50–54 On the other hand, PA is highly explosive in nature and a notorious environmental pollutant causing serious damage to the aquatic system.55–57 Interestingly, Al-complexes, inter alia, have turned out to be simpler and economical yet efficient analytical technique for faster detection of PA.
We extend our work along these lines using a new pyridine-pyrazole based bis-bidentate asymmetric ligand, (E)-N′-(2,3-dihydroxybenzylidene)-3-(pyridin-2-yl)-1H-pyrazole-5-carbohydrazide (H2DPC). The motivation comes from our earlier work where similar semi-rigid ligands efficiently coordinate to the transition metals as well as ‘hard’ trivalent lanthanides.58–63 Considering comparable coordination behaviors of lanthanides and Al3+, we envisioned that H2DPC containing –CONH, C![[double bond, length as m-dash]](https://www.rsc.org/images/entities/char_e001.gif) N, and –OH groups would lead to similar coordination complex formation with Al3+, while the presence of two phenolic groups should turn-on the desired chelation-enhanced fluorescence. Indeed, H2DPC act as a chemosensor and helps to detect through Al3+-responsive fluorescence. The selective detection of Al3+ ion in presence of other metal ions is also confirmed. The as-synthesized H2DPC–Al complex was further successfully utilized for bio-imaging human breast cancer cells (MCF7). Furthermore, applicability of the as-synthesized H2DPC–Al complex for fluorescence-based sensing of various nitroaromatics including PA have also been investigated in detail.
N, and –OH groups would lead to similar coordination complex formation with Al3+, while the presence of two phenolic groups should turn-on the desired chelation-enhanced fluorescence. Indeed, H2DPC act as a chemosensor and helps to detect through Al3+-responsive fluorescence. The selective detection of Al3+ ion in presence of other metal ions is also confirmed. The as-synthesized H2DPC–Al complex was further successfully utilized for bio-imaging human breast cancer cells (MCF7). Furthermore, applicability of the as-synthesized H2DPC–Al complex for fluorescence-based sensing of various nitroaromatics including PA have also been investigated in detail.
Result and discussions
Design and synthesis of chemosensor
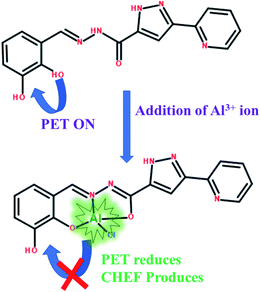
Clearly, the “turn-on” Al3+ responsive fluorescence through metal-coordination is at the heart of the matter, for the current chemosensor design. While the major obstacle remains the metal–ligand coordination, owing to the uncanny coordination behavior of the Al3+ ion. Optimization of coordination behavior of the ligand is therefore the most crucial aspect in Al3+ chemosensor design. We have recently demonstrated the effectiveness of asymmetric semi-rigid pyridine-pyrazole based Schiff base ligands in lanthanide complex formation.58,60 The coordination behavior of lanthanides closely resembles to that of Al3+ and led us believe that pyridine-pyrazole based Schiff base ligands will be equally useful for Al3+.The titular chemosensor of this study, H2DPC, was synthesized in reasonably good yield following a typical condensation reaction between 2,3-dihydroxybenzaldehyde and 3-(pyridin-2-yl)-1H-pyrazole-5-carbohydrazide. We chose ortho-dihydroxybenzene moiety for two reasons: (a) presence of two hard O-chelating sites should favour the coordination to trivalent Al and (b) the phenolic OH-group are well known to induce chromophoric effect, which would definitely be beneficial in inducing turn-on fluorescence. For the current ligand, the PET effect expected to occur due to the lone pair of electrons of conjugated azomethine-N and phenolic-O which concomitantly quenches the fluorescence. But upon addition of Al3+, the metal-coordination is expected to stop the PET effect while enhancing the fluorescence.
The H2DPC molecule was thoroughly characterized by elemental analysis, various spectroscopic techniques like FT-IR, ESI-MS, 1H, 13C NMR as well as diffraction techniques. The FT-IR spectrum of the ligand confirms the presence of two phenolic (–OH) with a characteristics broad peak at 3284 cm−1. On the other hand, sharp peaks at 1680 cm−1 and at 3325.05 cm−1 were observed for amide (O![[double bond, length as m-dash]](https://www.rsc.org/images/entities/char_e001.gif) C) stretch and amide (N–H) stretch, respectively. The 1H and 13C NMR data is consisted with the expected values. A characteristic peak at δ 14.18 ppm confirms the presence of pyrazole hydrogen, whereas peaks for –OH proton appear at 11.38 ppm and 10.79 ppm. The peak for amide hydrogen appears at 12.18 ppm. Further corroboration comes from the ESI-MS spectra which shows a single m/z peak at 324.10 assigned to [H2DPC + H+] and [H2DPC + Na+] at 346.07 (Fig. S1†). For conformation of the suspected complex, we have also collected sequential mass spectra and after addition of AlCl3 solution as a source of Al3+ ion there was a new peak generate at 385.05 presumably for the Al–DPC complex assigned as (H2DPC + Al3+ + Cl− + H+) and another at 408.14 assigned as (H2DPC + Al3+ + Cl− + H+ + Na+) (Fig. S2 and S3†). Furthermore, comparison of isotopic distribution pattern of the complex system with the simulated mass spectra shows that they are superimposable with each other and henceforth confirms the formation of the complex (Fig. S4†).
C) stretch and amide (N–H) stretch, respectively. The 1H and 13C NMR data is consisted with the expected values. A characteristic peak at δ 14.18 ppm confirms the presence of pyrazole hydrogen, whereas peaks for –OH proton appear at 11.38 ppm and 10.79 ppm. The peak for amide hydrogen appears at 12.18 ppm. Further corroboration comes from the ESI-MS spectra which shows a single m/z peak at 324.10 assigned to [H2DPC + H+] and [H2DPC + Na+] at 346.07 (Fig. S1†). For conformation of the suspected complex, we have also collected sequential mass spectra and after addition of AlCl3 solution as a source of Al3+ ion there was a new peak generate at 385.05 presumably for the Al–DPC complex assigned as (H2DPC + Al3+ + Cl− + H+) and another at 408.14 assigned as (H2DPC + Al3+ + Cl− + H+ + Na+) (Fig. S2 and S3†). Furthermore, comparison of isotopic distribution pattern of the complex system with the simulated mass spectra shows that they are superimposable with each other and henceforth confirms the formation of the complex (Fig. S4†).
Suitable single crystals of diffraction quality were also obtained from a MeOH-DMF solvent mixture. The X-ray single crystal structure of H2DPC (monoclinic, P21/c) shows an expected planar orientation of the molecule (Fig. 1 & S5†). The exo-hydroxyl groups of two adjacent H2DPCs form strong O–H⋯O hydrogen bonds with the keto groups to sustain a sideways self-assembly. The sideways arrangement is further supported by pair wise N–H⋯N hydrogen bonds between two juxtaposed pyrazole-pyridine moieties. Strong π–π interactions involving all the aromatic rings, on the other hand, help the supramolecular self-assembly in the perpendicular directions.
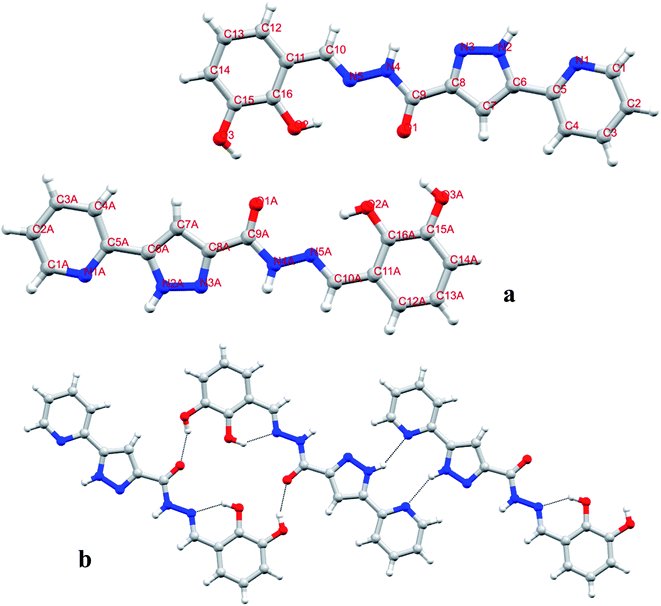 | ||
| Fig. 1 (a) X-Ray single crystal structures of H2DPC (light gray-H, dark gray-C, blue-N, red-O) (in (b) intra and inter molecular hydrogen bonds are shown by black dotted lines). | ||
Although the crystal structure provides sufficient information about the connectivity and solid state self-assembly, it cannot predict the stable solvated form of the ligand. For which, we have carried out theoretical calculations. The experimental crystal structure shows some interesting synergy with the theoretically calculated structure and predicted stable conformer. In the solvent medium, H2DPC may exist in two tautomeric forms, viz., keto and enol form. Our theoretical exploration suggests that the keto form of the ligand is 0.09 eV more stable than the enol form (Fig. S6†). The ground state optimized geometry of keto-H2DPC reveals O1–C1 and C1–N1 bond distances of 1.23 and 1.37 Å respectively, as exhibited in Fig. S6,† with NPA charges −0.689, 0.689 and −0.464 of O1, C1 and N1.
Photophysical studies
Considering the fact that the theme of this work is primarily based on the chelation enhanced ‘turn-on’ Al3+ fluorescence, a detailed photophysical behavior of the ligand and ligand–Al complex were investigated using absorbance (UV-visible), photoluminescence (PL), fluorescence and time-resolved spectroscopic methods. The ligand, H2DPC shows a characteristic absorption band at 302 nm in DMSO–H2O mixture (1![[thin space (1/6-em)]](https://www.rsc.org/images/entities/char_2009.gif) :
:![[thin space (1/6-em)]](https://www.rsc.org/images/entities/char_2009.gif) 1 v/v). In order to check the influence of metal ions on the spectral behavior of the ligand, UV-Vis absorption spectra were collected using the DMSO solution of H2DPC maintained at pH 7.4 by using 10 mM aqueous solution of HEPES buffer. Accordingly, absorption spectrum of 10−4 M ligand solution was recorded upon addition of 10−4 M aqueous solution of different metal ions, such as Na+, K+, Ca2+, Cr3+, Al3+, Mn2+, Ni2+, Co2+ Zn2+, Pb2+ and Cd2+. We have also taken the images for aqueous solutions of mixture of individual metal salt with ligand, under white light and under UV light (365 nm) to observe the differences in bare eyes (Fig. S7†). As illustrated in Fig. 2, the spectral pattern of free ligand does not show any significant change on adding majority of metal ions except Al3+. Addition of Al3+ solution to the ligand brings two significant changes in the absorption spectra (a) a red shift of the absorption band from 302 nm to 330 nm and (b) appearance of a new absorption band at 393 nm, with somewhat lower intensity. The newly developed band towards the visible region is further manifested in the change in the color of the solution, from colorless to yellow, and clearly indicates ligand–Al complex formation.
1 v/v). In order to check the influence of metal ions on the spectral behavior of the ligand, UV-Vis absorption spectra were collected using the DMSO solution of H2DPC maintained at pH 7.4 by using 10 mM aqueous solution of HEPES buffer. Accordingly, absorption spectrum of 10−4 M ligand solution was recorded upon addition of 10−4 M aqueous solution of different metal ions, such as Na+, K+, Ca2+, Cr3+, Al3+, Mn2+, Ni2+, Co2+ Zn2+, Pb2+ and Cd2+. We have also taken the images for aqueous solutions of mixture of individual metal salt with ligand, under white light and under UV light (365 nm) to observe the differences in bare eyes (Fig. S7†). As illustrated in Fig. 2, the spectral pattern of free ligand does not show any significant change on adding majority of metal ions except Al3+. Addition of Al3+ solution to the ligand brings two significant changes in the absorption spectra (a) a red shift of the absorption band from 302 nm to 330 nm and (b) appearance of a new absorption band at 393 nm, with somewhat lower intensity. The newly developed band towards the visible region is further manifested in the change in the color of the solution, from colorless to yellow, and clearly indicates ligand–Al complex formation.
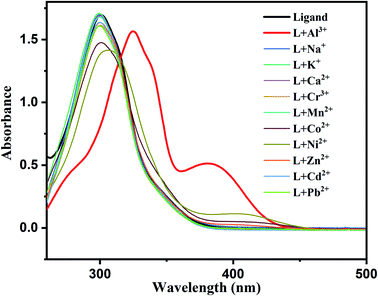 | ||
| Fig. 2 UV-Vis spectra of H2DPC on addition of various metal ions and specific change was observed in case of Al3+ ion. | ||
The marked changes in the absorption spectra enhance the prospect of H2DPC as a turn-on Al3+ chemosensor. In order to have better insight of the interaction of H2DPC with Al3+ ion, we have carried out a spectrophotometric titration at room temperature in DMSO–water (1![[thin space (1/6-em)]](https://www.rsc.org/images/entities/char_2009.gif) :
:![[thin space (1/6-em)]](https://www.rsc.org/images/entities/char_2009.gif) 1, v/v, pH = 7.4) by using aqueous 10 mM HEPES buffer solution. For the UV-Vis titration, 0.5 μL aliquot of 1 × 10⁻³M Al3+ solution was added sequentially into the 1.5 ml, 1 × 10⁻⁵ M H2DPC solution. Thus, we vary the exact concentration of Al3+ in the solution from 3.33 × 10⁻⁷ M to 1.2 × 10⁻⁵ M. Upon gradual addition of metal salts (Al3+), the strong π–π* absorption band of the free ligand at 302 nm shows a red shift to 330 nm with gradual decrease in absorbance value. Concomitantly, a new weak broad band at 393 nm appeared in the spectrum, which might be attributed to ligand to metal charge transfer (LMCT), showed a gradual increase in absorbance value without any significant shifting of the peak (Fig. 3).
1, v/v, pH = 7.4) by using aqueous 10 mM HEPES buffer solution. For the UV-Vis titration, 0.5 μL aliquot of 1 × 10⁻³M Al3+ solution was added sequentially into the 1.5 ml, 1 × 10⁻⁵ M H2DPC solution. Thus, we vary the exact concentration of Al3+ in the solution from 3.33 × 10⁻⁷ M to 1.2 × 10⁻⁵ M. Upon gradual addition of metal salts (Al3+), the strong π–π* absorption band of the free ligand at 302 nm shows a red shift to 330 nm with gradual decrease in absorbance value. Concomitantly, a new weak broad band at 393 nm appeared in the spectrum, which might be attributed to ligand to metal charge transfer (LMCT), showed a gradual increase in absorbance value without any significant shifting of the peak (Fig. 3).
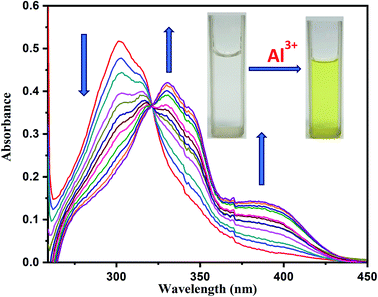 | ||
| Fig. 3 On gradual addition of Al3+ the change in absorbance value of H2DPC spectra. Inset: image of free ligand solution and mixture of ligand and Al3+ solution. | ||
The binding constant was also calculated from the absorption titration experiment using the Benesi–Hildebrand (B–H) plot:
| 1/(A − A0) = 1/{Ka(Amax − A0)[Al3+]} + 1/(Amax − A0) |
On the other hand, appearance of an isosbestic point at 321 nm clearly indicates that the reaction is clean and straightforward. Interestingly, the metal–ligand complex formation can also be monitored visually as gradual addition of the metal solution keep intensifying a yellow tinge to the initial colorless solution of the free ligand which ultimately turns it to a bright yellow solution.
Photoluminescence studies
The Photoluminescence spectra of 1 × 10⁻³ M H2DPC in 3 ml DMSO–water 1![[thin space (1/6-em)]](https://www.rsc.org/images/entities/char_2009.gif) :
:![[thin space (1/6-em)]](https://www.rsc.org/images/entities/char_2009.gif) 1 mixture solution (v/v) was collected after exciting the sample at λex = 417 nm. The free ligand however shows negligible fluorescence intensity. In order to evaluate the possibility of chelation enhance fluorescence, the emission spectra of H2DPC were recorded in presence of other metal salts. Accordingly, spectra were collected for 1.5 ml of aqueous 1 × 10⁻³M chloride salt solutions of individually Na+, K+, Ca2+, Cr3+, Al3+, Mn2+, Ni2+, Co2+, Zn2+, Pb2+, Hg2+ and Cd2+, mixed with 1.5 ml DMSO solution of 1 × 10⁻³ M ligand solution. All the spectra were collected in buffer (pH-7.4) by using aqueous 10 mM HEPES buffer solution in DMSO water mixture (1
1 mixture solution (v/v) was collected after exciting the sample at λex = 417 nm. The free ligand however shows negligible fluorescence intensity. In order to evaluate the possibility of chelation enhance fluorescence, the emission spectra of H2DPC were recorded in presence of other metal salts. Accordingly, spectra were collected for 1.5 ml of aqueous 1 × 10⁻³M chloride salt solutions of individually Na+, K+, Ca2+, Cr3+, Al3+, Mn2+, Ni2+, Co2+, Zn2+, Pb2+, Hg2+ and Cd2+, mixed with 1.5 ml DMSO solution of 1 × 10⁻³ M ligand solution. All the spectra were collected in buffer (pH-7.4) by using aqueous 10 mM HEPES buffer solution in DMSO water mixture (1![[thin space (1/6-em)]](https://www.rsc.org/images/entities/char_2009.gif) :
:![[thin space (1/6-em)]](https://www.rsc.org/images/entities/char_2009.gif) 1 v/v) at room temperature using excitation wavelength 417 nm. As illustrated in Fig. 4, except Zn2+ and Al3+ ion all the other cations did not show any significant enhancement of intensity than that of the ligand. Only a slight enhancement in emission intensity is observed upon the addition of Zn2+ salt. To eliminate the participation of Zn2+ ion in the detection process EDTA has been used as a chelating ligand. The EDTA–Zn2+ complex has higher binding constant than the corresponding Al3+ complex. Naturally, EDTA can easily forms complex with Zn2+ and separated it from Al3+ in the solution phase. To support that we have taken the PL spectra of Zn2+–H2DPC complex and after that we added 1 ml 10−3(M) concentration of aqueous EDTA solution. As a result, the quenching of intensity of the solution was observed because of forming Zn–EDTA complex. Subsequently when some aqueous solution of Al3+ was added the intensity of photoluminescence in the mixture increases abruptly (Fig. S9†).
1 v/v) at room temperature using excitation wavelength 417 nm. As illustrated in Fig. 4, except Zn2+ and Al3+ ion all the other cations did not show any significant enhancement of intensity than that of the ligand. Only a slight enhancement in emission intensity is observed upon the addition of Zn2+ salt. To eliminate the participation of Zn2+ ion in the detection process EDTA has been used as a chelating ligand. The EDTA–Zn2+ complex has higher binding constant than the corresponding Al3+ complex. Naturally, EDTA can easily forms complex with Zn2+ and separated it from Al3+ in the solution phase. To support that we have taken the PL spectra of Zn2+–H2DPC complex and after that we added 1 ml 10−3(M) concentration of aqueous EDTA solution. As a result, the quenching of intensity of the solution was observed because of forming Zn–EDTA complex. Subsequently when some aqueous solution of Al3+ was added the intensity of photoluminescence in the mixture increases abruptly (Fig. S9†).
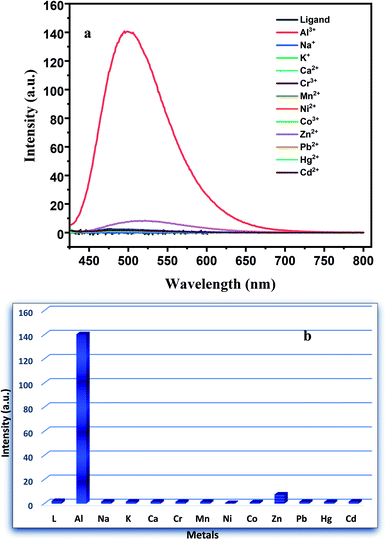 | ||
| Fig. 4 (a) PL spectra of ligand in presence of various metal ions and (b) the corresponding bar plot. | ||
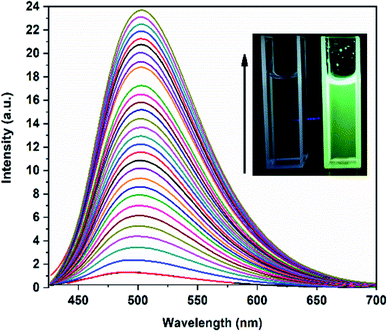
As illustrated in the Fig. 4a, we can observe that for H2DPC + Al3+ solution, a remarkable ca. 18-fold increase of the turn-on fluorescence intensity was observed at 502 nm with a red shift of 18 nm, a subsequent fluorometric titration was performed in DMSO–H2O (1![[thin space (1/6-em)]](https://www.rsc.org/images/entities/char_2009.gif) :
:![[thin space (1/6-em)]](https://www.rsc.org/images/entities/char_2009.gif) 1, v/v, pH 7.4) by using aqueous 10 mM HEPES buffer solution to know more about the reaction of H2DPC and Al3+ (Fig. 5). As per our expectation, sequential addition of Al3+ to the ligand solution leads to a gradual enhance of the fluorescence intensity till it reaches to the saturation point. For the PL titration an 0.5 μL aliquots Al3+ solution with the concentration of 1 × 10⁻³ M were added sequentially into the 1.5 ml solution of the H2DPC having the concentration of 1 × 10⁻⁵ M. Thus, we vary the exact concentration of Al3+ in the solution from 3.33 × 10⁻⁷ M to 1.2 × 10⁻⁵ M. The binding constant of the ligand metal complex was calculated by using the Benesi–Hildebrand (B–H) plot:
1, v/v, pH 7.4) by using aqueous 10 mM HEPES buffer solution to know more about the reaction of H2DPC and Al3+ (Fig. 5). As per our expectation, sequential addition of Al3+ to the ligand solution leads to a gradual enhance of the fluorescence intensity till it reaches to the saturation point. For the PL titration an 0.5 μL aliquots Al3+ solution with the concentration of 1 × 10⁻³ M were added sequentially into the 1.5 ml solution of the H2DPC having the concentration of 1 × 10⁻⁵ M. Thus, we vary the exact concentration of Al3+ in the solution from 3.33 × 10⁻⁷ M to 1.2 × 10⁻⁵ M. The binding constant of the ligand metal complex was calculated by using the Benesi–Hildebrand (B–H) plot:
| 1/(I − I0) = 1/{K(Imax − I0)[Al3+]} + 1/(Imax − I0) |
| limit of detection (LOD) = 3σ/k |
Furthermore, the Job's plot analysis was carried out by plotting fluorescence intensity against different mole fractions of Al3+ while keeping volume of solution constant (Fig. S11a†). A maximum in this plot was obtained at 0.5 mole fraction, which indicates a 1![[thin space (1/6-em)]](https://www.rsc.org/images/entities/char_2009.gif) :
:![[thin space (1/6-em)]](https://www.rsc.org/images/entities/char_2009.gif) 1 complex formation of H2DPC and Al3+. The same experiment was also performed by UV-Vis data (Fig. S11b†).
1 complex formation of H2DPC and Al3+. The same experiment was also performed by UV-Vis data (Fig. S11b†).
The enhancement in the fluorescence intensity can be attributed to the most common two-step processes of turn-on sensing: (a) suspension of photoinduced electron transfer (PET) and (b) activation of chelation enhanced fluorescence (CHEF) through the co-ordination of azomethine-N and phenolic-O with the metal ion. For free ligand, the electrons of both azomethine-N and phenolic-O lone pairs take part in conjugation process and activates the photoinduced electron transfer (PET) and concomitantly quenches the fluorescence. However, as soon as the Al–ligand chelation take place the lone pairs participate in metal coordination which stops PET but activate CHEF with consequential enhancement in fluorescence intensity (Scheme 1).
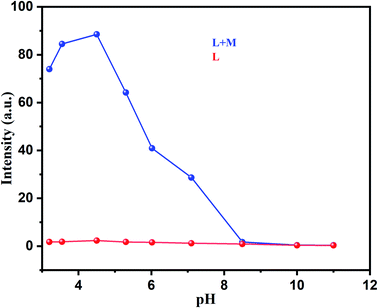
Effect of pH variation on fluorescence intensity of free ligand and Al-complex has also been studied (Fig. 6) in detail. As illustrated in Fig. 6 there was no significant fluorescence emission for free ligand observed between the pH range of 4 to 12. The emission spectra of the ligand were, however, completely different in presence of Al3+ ion. In comparison to the ligand, the Al-ligand chelation leads to the increase in emission intensity between the pH ranges of 3 to 8 (Fig. 6). Though the sharp decrease in PL intensity at the higher pH range more specifically at alkaline medium can be explained in terms of Al(OH)3 precipitation. Interestingly, the occurrence of CHEF at the physiological pH is immensely important for any biological studies, and as such enhances the potential of the as-synthesized Al-complex as a probe for bioimaging, as discussed in later section.
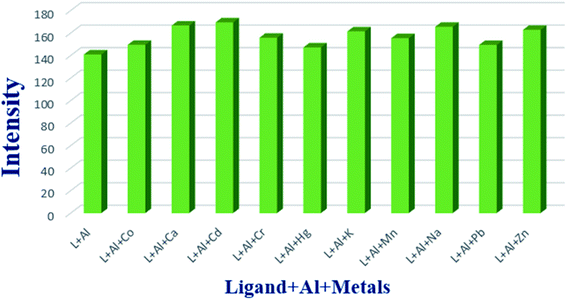
Another important issue of chemosensing is the selectivity towards the concerned metal ion. In order to evaluate the selectivity of H2DPC towards Al, the intensity of photoluminescence of H2DPC + Al in presence of other competitive metal ions (Co2+, Ca2+, Cd2+, Cr3+, Hg2+, K+, Mn2+, Na+, Pb2+, Zn2+) were investigated. As evident from Fig. 7, addition of competitive metal ions did not yield any significant change to the original intensity of the H2DPC + Al solution. The result clearly indicates that H2DPC can detect Al3+ selectively even in presence of other metal ions.
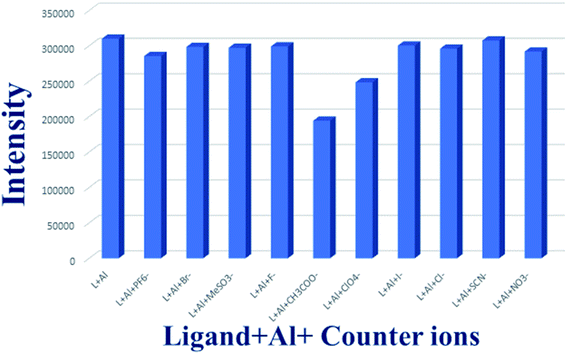
To check the effect of counter anion on the fluorescence of Al–ligand complex similar experiments were performed using different counter anions. The H2DPC molecule showed no significant change in fluorescence intensity when different counter anions were added to the Al3+ solution (Fig. 8). For these experiments, 10−3 M solution of each anion (PF6−, Br−, MeSO3−, F−, CH3COO−, ClO4−, I−, Cl−, SCN−, NO3−) was added into the 2 ml of 10−3 M solution of the ligand–metal system. Interestingly, for CH3COO− and ClO4−, there was very little decrease in the original intensity of the complex (Fig. S12†) were observed. Furthermore, the fluorescence intensities in presence various inorganic acids, such as HCl, HNO3 and H2SO4 (Fig. S13†) were also investigated. The result shows that the intensity was increased in presence of all acids while maximum effect was observed for H2SO4.
Time resolved fluorescence spectroscopy
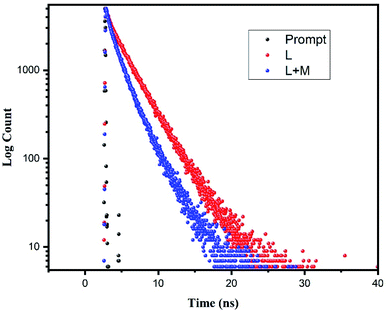
The fluorescence lifetime measurements using time-correlated single-photon count (TCSPC) experiments were carried out to determine and compare the average life-time free H2DPC molecule and Al–H2DPC complex. Lifetime measurement data were taken on excitation at 405 nm and as depicted in Fig. 9, the fluorescence decay plot exhibits a bi-exponential nature. As expected for a CHEF process, the life time of the free ligand (H2DPC, 3.74510 ns) decrease in presence of Al3+ ion, with a corroborating life time 1.8 ns for the Al–H2DPC complex (Table 1). Further support comes from the theoretically calculated values show that the ΔE value for free ligand is higher than the ΔE value of complex. In the theoretical study we have seen that the ΔE value for ligand is 4.12 eV whereas for metal complexes it is 3.72 eV so due to the low energetic HOMO–LUMO gap for complex than ligand. The overall number of transitions between two state getting increase as a result the intensity getting higher after adding Al3+ ion in ligand solution but overall, the average life time for metal complex also getting decrease than only ligand. The values of a1 and a2 are also determined using the equation,and
| Environment | a1 | a2 | τ1 (ns) | τ2 (ns) | χ2 | 〈τ〉 (ns) |
|---|---|---|---|---|---|---|
| H2DPC | 0.2255 | 0.7745 | 0.599995 | 4.66082 | 1.507279991 | 3.74510 |
| H2DPC–Al | 0.7272 | 0.2728 | 1.54612 | 3.00989 | 1.002613126 | 1.94543 |
The value of B1 and B2 are given as 22.55% and 77.45% for ligand and 72.72% and 27.28% for ligand metal complex and B is referred as relative amplitude and the average life time was calculated with the following equation 〈τ〉 = a1τ1 + a2τ2.
1H-NMR titration analysis
For better understanding of the interaction of H2DPC with Al3+ ion, 1H-NMR spectroscopic titration was carried out in DMSO-d6 solvent. The titration was done with sequential addition of AlCl3 (D2O solution) in H2DPC (DMSO-d6) solution. Upon gradual addition of Al3+ solution into the ligand solution led to the disappearance of the peaks for phenolic–OH protons at δ 11.383 ppm and δ 10.792 ppm (Fig. 10). It actually implies the breaking of intra molecular hydrogen bonding between the phenolic–OH and imine –C![[double bond, length as m-dash]](https://www.rsc.org/images/entities/char_e001.gif) N and also the deprotonation of phenolic–OH. We have observed in theoretical structure that the –NH beside the carbonyl group get tautomerized and form C
N and also the deprotonation of phenolic–OH. We have observed in theoretical structure that the –NH beside the carbonyl group get tautomerized and form C![[double bond, length as m-dash]](https://www.rsc.org/images/entities/char_e001.gif) N in complex formation. The time-resolved NMR spectra also exhibits the disappearance of peak for amide H in δ 12.181 ppm upon step by step increase of metal ion concentration, which actually confirms the complex formation. Furthermore, a downfield shift was observed for the proton at δ 8.645 ppm. Based on the titration data we can conclude that because of the high ionic potential of Al3+ there is hard–hard interaction between Al3+ and phenolic (O−), as well as with imine N(−C
N in complex formation. The time-resolved NMR spectra also exhibits the disappearance of peak for amide H in δ 12.181 ppm upon step by step increase of metal ion concentration, which actually confirms the complex formation. Furthermore, a downfield shift was observed for the proton at δ 8.645 ppm. Based on the titration data we can conclude that because of the high ionic potential of Al3+ there is hard–hard interaction between Al3+ and phenolic (O−), as well as with imine N(−C![[double bond, length as m-dash]](https://www.rsc.org/images/entities/char_e001.gif) N), which actually driven the complex formation process.
N), which actually driven the complex formation process.
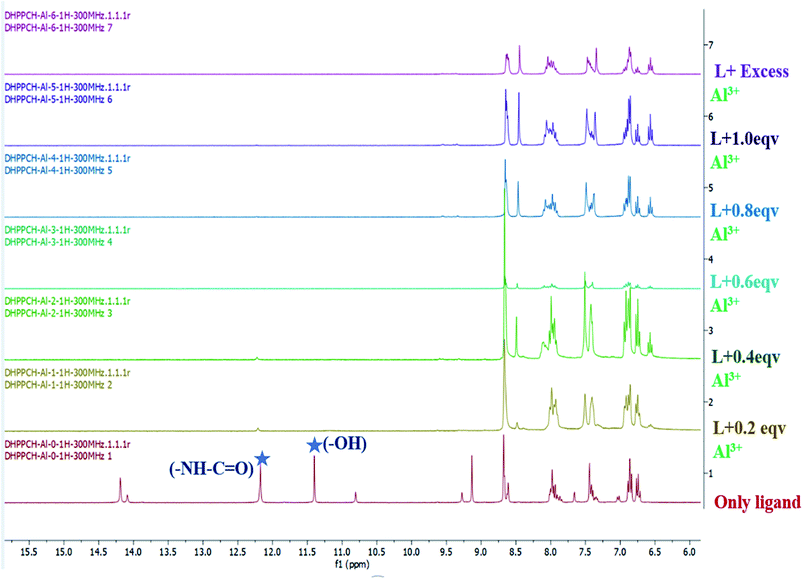 | ||
| Fig. 10 The NMR titration of H2DPC (in DMSO-d6 solution) with gradual addition of Al3+ (in D2O solution). | ||
Theoretical studies
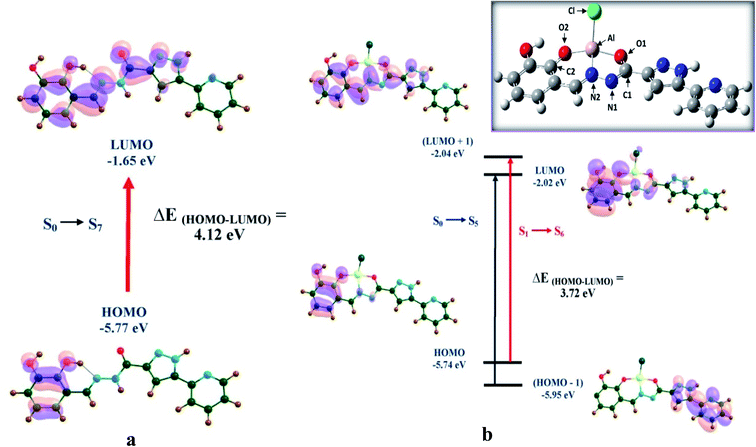
Even after numerous attempts, we could not find a diffraction quality single crystal of the H2DPC–Al complex. This prompts us to carry out theoretical calculation was done on H2DPC–Al. As evident from Fig. 11 (inset) the phenolic oxygen (O2), carbonyl oxygen (O1) and the nitrogen (N2) which is next to amide nitrogen act as the chelating sites in the complex H2DPC–Al, with O–Al–O bond angle of 156.7°. Upon complex formation with Al3+, the distance between C1 and O1 increases to 1.31 Å, while that between N1 and C1 decreases slightly to 1.32 Å, as displayed in (Table S2†). The NPA charges of O1, C1, N1 and Al are found to be −0.880, 0.605, −0.436 and 0.241 respectively, while −0.926, 0.334 and −0.514 of O2, C2, N2.Theoretical outcome shows that the HOMO of keto-H2DPC, in Fig. 11a, is congested over the 2-hydroxyphenol part of the ligand and the LUMO mainly over the 2-hydroxyphenol part, with a slight localization over the pyrazole part, as well. As depicted in Fig. 11b, the HOMO of H2DPC–Al complex is congested over the 2-hydroxyphenol part of the ligand, similar to that of keto-H2DPC, while the (HOMO−1) is distributed solely over the pyrazole part. On the other hand, both the LUMO and (LUMO+1), are distributed nearly over the entire ligand, and not on the Al centre. Thus, it is evident, that the absorption bands are due to intra-ligand n–π* and π–π* electronic transitions and not because of any metal to ligand or ligand to metal charge transfer.
The HOMO–LUMO gap for the ligand is calculated to be 4.12 eV, which gets lowered to 3.72 eV in the complex H2DPC–Al. The decrease in HOMO–LUMO gap by 0.40 eV accounts for the red shift in the UV-visible spectra. The electronic transition, S0 → S5, at 310.8 nm, corresponding to electron transfer from HOMO to LUMO accounts for the experimentally observed peak at 301.52 nm in the UV-visible spectra. The absorption bands at 330.6 and 390.11 nm in the spectra result from the electronic transitions, S0 → S5 (at 346.75 nm) and S1 → S6 (at 370.36 nm), corresponding to (HOMO−1) to LUMO and HOMO to (LUMO+1) electron transfers. The results obtained using TZVP basis set are in accordance with the 6-31++G** values. The TZVP values, along with all the oscillator strength values have been exhibited in Table 2.
| Molecule | Basis set | Energy (eV) | Electronic transition state | Excitation (nm) | Oscillator strength (f) | Experimentally observed transition (nm) | Corresponding MOs |
|---|---|---|---|---|---|---|---|
| Keto-H2DPC | 6-31++ G** | 3.99 | S0–S7 | 310.80 | 1.0790 | 301.52 | HOMO → LUMO |
| TZVP | 3.91 | S0–S7 | 317.48 | 1.0866 | |||
| DPC–Al | 6-31++ G** | 3.58 | S0–S5 | 346.75 | 1.0657 | 330.60 | (HOMO−1) → LUMO |
| TZVP | 3.54 | S0–S5 | 349.80 | 1.0589 | |||
| 6-31++ G** | 3.35 | S1–S6 | 370.36 | 1.1015 | 390.11 | HOMO → (LUMO+1) | |
| TZVP | 3.32 | S1–S6 | 373.99 | 1.1158 |
Application of H2DPC–Al in picric acid sensing
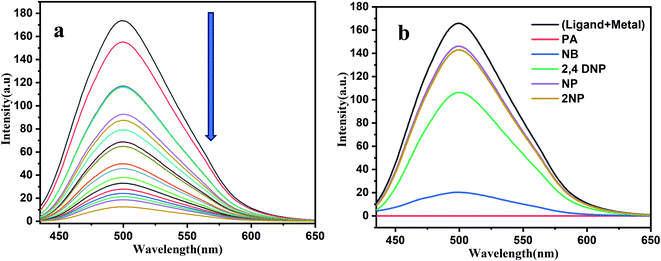
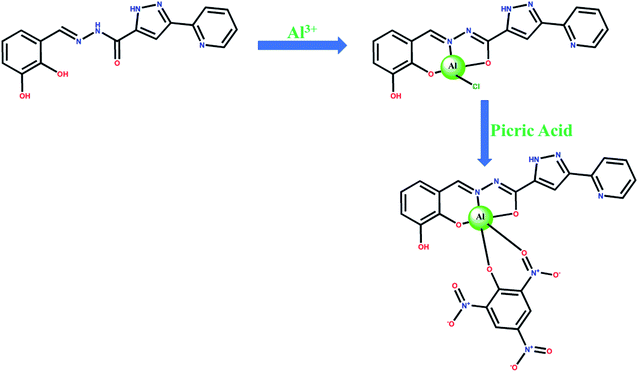
Interestingly, fluorescence properties of H2DPC–Al ensemble are found to be dependent on the presence of nitroaromatic (NA) compounds and therefore can be employed for their detection. The fluorescence of H2DPC–Al compound exhibits the quenching of emission upon the addition of (100 μL) various nitro aromatic compounds including nitrobenzene, 2,4-dinitrophenol, 2-nitrophenol, 2,4,6-trinitrophenol and 4-nitrophenol (Fig. 12b). Such a quenching effect should be attributed to the charge transfer electron transitions from the H2DPC–Al ensembles to NA due to the electron-deficient property of NA and the π–π interactions between complex and NA molecules. Among the different NAs, 2,4,6-trinitrophenol or picric acid, which can also be envisaged as the most important variant of NAs for various ambivalent reasons, shows the most prominent emission quenching. We observed that under UV light the change in intensity for picric acid solution is most pronounce (Fig. S14†). This supports the candidature of H2DPC–Al as a promising luminescent probe for detecting picric acid among all the NAs. For detailed study, the fluorescence intensity of the H2DPC–Al solution was monitored upon sequential addition of small aliquot of picric acid solutions. As depicted in Fig. 12a, quenching of the fluorescence intensity was observed. While the detection limit of the H2DPC–Al ensemble toward PA was calculated using the formula of detection limit = 3σ/k. Here, σ (standard deviation) = 1.384999 and k (slop of the plot) = 33895.77. The value of detection limit is 1.2257 × 10⁻⁴ (M) (Fig. S15†). We have investigated the mechanism for this quenching process. For this, we have collected the mass spectra of the (H2DPC + Al + PA) complex and found that peak at 669.28 is probably due to the H2DPC + Al3++PA + 4Na+ assembly (Fig. S16†). The probable quenching mechanism was shown in Scheme 2. From the mechanism we can easily conclude that due to the strong -I and -R effect the electron cloud is getting shifted towards PA and as a result the luminescent intensity of the overall complex is getting decreased.Formation of logic gate
Applying the reversible behavior of our ligand H2DPC towards Al3+ ion in presence of picric acid in the solution we actually constructed an INHIBIT logic gate with two inputs, Al3+ and picric acid (Fig. 13a). Four combinations are possible. In the first case we only use the ligand but both the inputs are not added to the solution so there is no such fluorescence was observed. We can conclude the result as zero. In the second combination we added only one input that is Al3+ ion and we get an observable fluorescence. We can conclude the result as one. For the third combination we added only the second input that is picric acid. We did not observe any fluorescence, so we can conclude the result as zero. In the fourth combination we added both the inputs. Though Al3+ helps the increase in fluorescence but due to the quenching ability of PA we did not observed any luminescence so we can conclude the result as zero. Thus, in this way we actually constructed a circuit for the INHIBIT gate which ideally follow the truth table of INHIBIT gate (Fig. 13c). We have also taken the picture of all four combinations under UV lamp (Fig. 13b).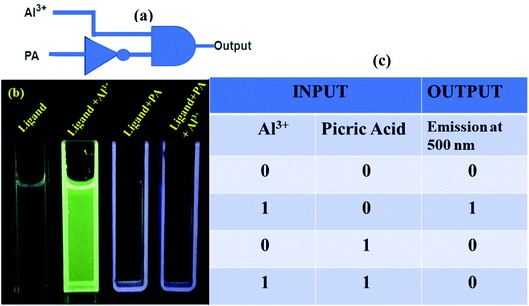 | ||
| Fig. 13 Operation of inhibit logic gate. (a) Pictorial representation of the logic gate (b) visual color outputs. (c) Truth table corresponding to the INHIBIT logic gate. | ||
Biological studies
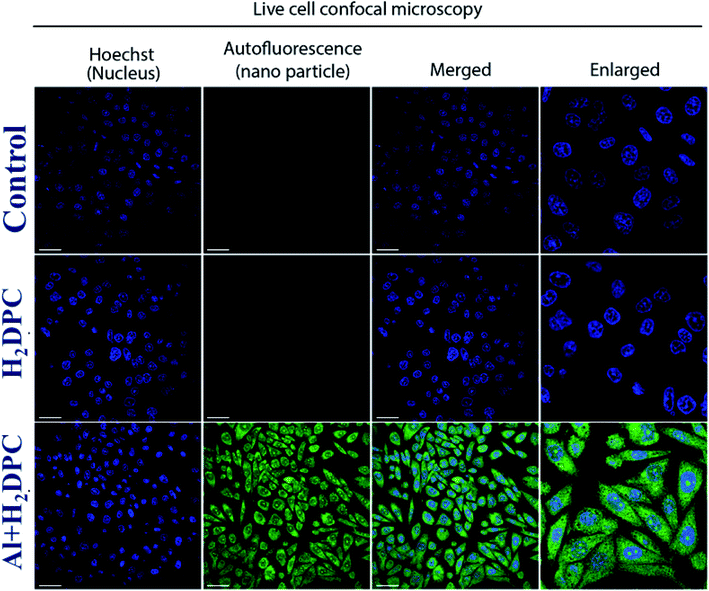
The luminescent properties, particularly the characteristics green luminescence of H2DPC–Al was highly encouraging and prompts us to explore the potential of the complex as a fluorescent probe for cellular imaging. Accordingly, the as-synthesized H2DPC–Al complex has been used as a fluorescent probe for the live cell labeling of human breast adenocarcinoma (MCF7) cells. To be an effective probe for cellular sensing internalization into cell as well as low cytotoxicity are the two most important prerequisites. Accordingly, chances of cytotoxic effects of H2DPC–Al were evaluated using the conventional cell cytotoxicity (MTT) survival assay experiments. In survival assays, MCF7 cells treated with increasing concentrations of H2DPC–Al for 72 hours manifested least cytotoxicity as >90% of the cells remained viable even at 50 μM concentration of the compound. In other words, the H2DPC–Al complex does not exert any adverse effect on the cell and therefore can be termed as nontoxic (Fig. S17†).Having confirmed its non-toxic nature, human breast adenocarcinoma (MCF7) cells seeded in cover glass bottom dish were exposed to 20 μM H2DPC–Al for 6 h and subjected to live cell confocal microscopy thereafter. As illustrated in Fig. 14, the H2DPC–Al complex was achieving the critical cell-permeability as such easily pass through the cell membrane during the incubation period. Following the conventional cellular sensing protocol, the nuclei of the cells were strained with Hoechst 33342 (Blue) nuclear marker. Treatment with H2DPC–Al revealed significant cellular uptake as it permeated easily through the MCF7 cells without causing any considerable damage. Moreover, the nuclei remained intact and showed no significant deformation. The H2DPC–Al (green) localized both in the nucleus and cytoplasm as observed in confocal microscopy. In order to check whether ligand itself can be used as a fluorescence probe, the live cell labelling of human breast adenocarcinoma (MCF7) cells experiment was repeated using the ligand solution of same concentration. However, the ligand did not show appreciable fluorescence intensity. The result has another implication that the ligand is unable to detect the presence of inherent aluminum in MCF7 cells. This could be attributed to the fact that the concentration of aluminum in the cytoplasm of cell and nucleus is in the range of femtomolar64 whereas our ligand has the limit of detection for Al3+ ion is in the range of 10−7 M.
Conclusions
The impetus for the work presented herein was to develop a pyridine-pyrazole based ‘turn on’ chemosensor for Al(III). Accordingly, we have successfully synthesized a new pyridine-pyrazole based bis-bidentate asymmetric ligand fitted with two ‘hard’ –OH groups. The presence of two phenolic groups indeed triggers a turn-on chelation-enhanced Al3+-responsive fluorescence. The sensing mechanism based on the chelation-enhanced fluorescence (CHEF) process was studied in detail using various spectroscopic techniques including UV-Vis, PL, fluorescence as well as NMR titration. The spectroscopic methods also confirm the selective detection of Al3+ ion in presence of other metal ions. Further corroborative support in favor of sensing mechanism comes from the DFT calculations. On the other hand, theoretical results obtained from the Time Dependent Density Functional Theory (TD-DFT) calculations show an excellent agreement with the electronic spectra corresponding to the ligand (H2DPC) and the complex (H2DPC–Al).The as-synthesized H2DPC–Al complex shows an excellent fluorescence-based sensing of various nitroaromatics including picric acid, for which an INHIBIT logic gate can also be constructed. With no apparent cytotoxic adverse effects, the as-synthesized H2DPC–Al complex was further successfully utilized for bio-imaging human breast cancer cells (MCF7) using live cell confocal microscopic techniques.
Experimental section
Materials and general methods
All the reagents and solvents used in this work were purchased from commercial sources & used without further purification. Solid state FT-IR spectra of 400–4000 cm−1 range were collected from Nicolet MAGNA-IR 750 spectrometer with sample prepared as KBr pellets. Elemental analyses were performed with Perkin-Elmer 2400 series CHN analyser. 1H and 13C NMR spectrum were carried out by 400 MHz and 500 MHz Bruker NMR spectrometers respectively dissolving sample in DMSO-d6 solvent. Mass spectra was collected by Q-ToF Micro YA263 high resolution (Waters Corporation) mass spectrometer by positive ion mode electrospray ionization and the spectra were collected in methanol. Absorption spectra were collected with a Jasco V-630 spectrophotometer. Photoluminescence spectra were collected at room temperature using Agilent Cary Eclipse & Hitachi, F-2500 fluorescence spectrophotometer and Horiba scientific TCSPC.Synthesis of (E)-N′-(2,3-dihydroxybenzylidene)-3-(pyridin-2-yl)-1H-pyrazole-5-carbohydrazide (H2DPC)
The ligand, (E)-N′-(2,3-dihydroxybenzylidene)-3-(pyridin-2-yl)-1H-pyrazole-5-carbohydrazide (H2DPC) was synthesized by condensation reaction between 2,3-dihydroxybenzaldehyde (1 mmol, 138 mg) & 3-(pyridin-2-yl)-1H-pyrazole-5-carbohydrazide (1 mmol, 203 mg) in ethanol medium. 3-(Pyridin-2-yl)-1H-pyrazole-5-carbohydrazide was synthesized using previously reported procedure.58 The mixture was stirred for 30 minutes and a drop of glacial acetic acid was added to the suspension. Then the mixture was refluxed for 6 hours under 80 °C. The white precipitate was found. The mixture was cooled to room temperature. Then it was filtered to collect the white precipitate. It was washed with ethanol and recrystallized from methanol (Scheme S1†). The compound was characterized by elemental analysis, FT-IR, ESI-MS & NMR spectrometer. (Yield: 245 mg, 71%). Calcd for C16H13N5O3 (%): C, 59.44; H, 4.05; N, 21.66. Found: C, 59.22; H, 3.65; N, 22.53. IR (400–4000 cm−1): 3325.05(s), 3284(s), 3161(s), 2997(s), 1679(s), 1548(s), 1473(s), 1406(s), 1267(s), 1205(s), 1159(s) (Fig. S18†). 1H NMR (500 MHz, [(CD3)2SO], δ) 14.183 (s, 1Hpyz-H), 12.181 (s, 1H, NH), 11.383 (s, 1H, phenolic-OH), 10.792 (s, 1H, phenolic-OH), 9.133 (s, 1H, imine-H), 7.867–8.512 (4H, py-H), 6.895–7.212 (4H, Ar–H). 7.615 (1H, pz-CH) (Fig. S19†). ESI-MS m/z (M + H): 324.1064 (Fig. S1†).Synthesis of Al3+ complex of H2DPC (H2DPC–Al)
To the solution of H2DPC (0.01 mmol, 3.23 mg) in 0.5 ml DMSO, 0.5 ml of aqueous solution of AlCl3 (0.01 mmol, 1.33 mg) was added. As a result, the colorless ligand solution turned to yellow. After evaporation of the solvent a yellow mass was extracted. The solid mass was washed for several time with water and dried in vacuum. The compound was characterized by elemental analysis, FT-IR, ESI-MS & NMR spectrometer. (Yield: 69%). Calcd for C16H11AlClN5O3 (%): C, 50.08; H, 2.89; N, 18.25. Found: C, 49.22; H, 2.50; N, 17.97. IR (400−4000 cm−1): 3375.20(b), 3168(b), 1662(s), 1625(s), 1606(s), 1585(s), 1465(s), 1286(s), 1205(s), (Fig. S20†) 1H NMR (500 MHz, [(CD3)2SO], δ) 12.193(s, 1H, NH), 7.867–8.512 (4H, py-H), 6.895–7.212 (4H, Ar–H). 7.615 (1H, pz-CH) (Fig. S21†) ESI-MS m/z (M + H): 385.0522 (Fig. S2 and S3†).Live-cell confocal microscopy
Live-cell imaging was carried out using confocal laser-scanning microscope (Leica TCS SP8) with a UV-laser and 63X/1.4 NA oil objective equipped with a heated environmental chamber set to 37 °C with optimal CO2 facility. Briefly, MCF7 cells seeded on cover glass bottom dish (Genetix, Biotech Asia Pvt. Ltd.) were incubated with compounds H2DPC and H2DPC–Al individually for 6 h. Nuclei were subsequently stained with Hoechst 33342 (Blue) (Sigma). This was followed by live cell confocal microscopy. Images were collected and processed using the Leica software and sized in Adobe Photoshop 7.0.65Cell survival assay
MCF7 cells (6 × 10³) were seeded in 96-well plate (BD Biosciences, USA) and treated with compound H2DPC–Al at the indicated concentrations. After 72 h treatment, cell survival was assessed by 3-(4,5-dimethylthiazol-2-yl)-2,5-diphenyltetrazolium bromide (MTT) assay. Briefly, cells were washed with 1× PBS and treated with MTT reagent (Sigma) for 3 h at 37 °C and the resulting formazan was dissolved in 100 μL of DMSO. Plates were analysed on Molecular Devices Spectra Max M2 Microplate Reader at 570 nm. The percent inhibition of viability for each concentration of the compounds was calculated with respect to the control. Data represent mean values ± s.e.m. for three independent experiments.66Computational details
In order to get a better understanding of the sensing mechanism, we have carried out Density Functional Theory (DFT) calculations. All electronic structures and frequency calculations have been performed using Gaussian 09 (ref. 67) suite of quantum chemistry program. The DFT functional considered for the systems under investigation is B3LYP,68,69 in conjunction with 6-31++G** basis set. The self-consistent reaction field (SCRF) method has been implemented using COSMO70,71 to take into account the effect of bulk solvent medium, considering dimethyl sulfoxide (DMSO) as the solvent. To interpret electronic spectra corresponding to the ligand H2DPC and the complex H2DPC–Al, we have carried out Time Dependent Density Functional Theory (TD-DFT) calculations using B3LYP method and basis set 6-31++G**. In order to further validate the obtained results, we have considered TZVP basis set also in conjunction with the same method.Single crystal X-ray crystallography
X-Ray diffraction intensities for the ligand H2DPC was collected at 100 K on a Bruker D8 VENTURE Microfocus diffractometer equipped with PHOTON II Detector, with Mo-Kα radiation (λ = 0.710 73 Å), controlled by the APEX3 (v2017.3-0) software package and processed using SAINT. Raw data were integrated and corrected for Lorentz and polarization effects using the Bruker APEX III program suite. The structures were solved by direct methods in SHELXS and refined by full-matrix least squares on F2 in SHELXL. Crystallographic data are summarized in reference no. 72 and the CIF has been deposited with the Cambridge Crystallographic Data Centre (CCDC).72Conflicts of interest
There are no conflicts to declare.Acknowledgements
RM gratefully acknowledges Department of Science and Technology (DST), India, for financial assistance under Empowerment and Equity Opportunities for Excellence in Science Programme (Project No. EEQ/2018/000194). KSD and AD thank DST-INSPIRE for a research fellowship. SS and SA thank UGC and CSIR respectively for their fellowships.References
- G. Berthon, Aluminium speciation in relation to aluminium bioavailability, metabolism and toxicity, Coord. Chem. Rev., 2002, 228, 319–341 CrossRef CAS.
- E. DeVoto and R. A. Yokel, The biological speciation and toxicokinetics of aluminum, Environ. Health Perspect., 1994, 102, 940–951 CrossRef CAS PubMed.
- D. González-Weller, A. n. J. Gutiérrez, C. Rubio, C. Revert and A. Hardisson, Dietary intake of aluminum in a Spanish population (Canary Islands), J. Agric. Food Chem., 2010, 58, 10452–10457 CrossRef PubMed.
- P. Nayak, Aluminum: impacts and disease, Environ. Res., 2002, 89, 101–115 CrossRef CAS PubMed.
- B. Wang, W. Xing, Y. Zhao and X. Deng, Effects of chronic aluminum exposure on memory through multiple signal transduction pathways, Environ. Toxicol. Pharmacol., 2010, 29, 308–313 CrossRef CAS PubMed.
- G. Ciardelli and N. Ranieri, The treatment and reuse of wastewater in the textile industry by means of ozonation and electroflocculation, Water Res., 2001, 35, 567–572 CrossRef CAS PubMed.
- J. Emsley, Nature's building blocks: an AZ guide to the elements, Oxford University Press, 2011 Search PubMed.
- W. S. Miller, L. Zhuang, J. Bottema, A. J. Wittebrood, P. De Smet, A. Haszler and A. Vieregge, Recent development in aluminium alloys for the automotive industry, J. Mater. Sci. Eng. A, 2000, 280, 37–49 CrossRef.
- T. Asada and H. Tamura, Isolation of bilberry anthocyanidin 3-glycosides bearing ortho-dihydroxyl groups on the B ring by forming an aluminum complex and their antioxidant activity, J. Agric. Food Chem., 2012, 60, 10634–10640 CrossRef CAS PubMed.
- J. L. Greger, J. E. Sutherland and R. Yokel, Aluminum exposure and metabolism, Crit. Rev. Clin. Lab. Sci., 1997, 34, 439–474 CrossRef CAS PubMed.
- B. S. Powell, A. K. Andrianov and P. C. Fusco, Polyionic vaccine adjuvants: another look at aluminum salts and polyelectrolytes, Clin. Exp. Vaccine Res., 2015, 4, 23–45 CrossRef PubMed.
- E. F. S. Authority, Safety of aluminium from dietary intake – Scientific Opinion of the Panel on Food Additives, Flavourings, Processing Aids and Food Contact Materials (AFC), EFSA J., 2008, 6, 754 Search PubMed.
- E. Delhaize, P. R. Ryan, D. M. Hebb, Y. Yamamoto, T. Sasaki and H. Matsumoto, Engineering high-level aluminum tolerance in barley with the ALMT1 gene, Proc. Natl. Acad. Sci., 2004, 101, 15249–15254 CrossRef CAS PubMed.
- J. F. Ma and J. Furukawa, Recent progress in the research of external Al detoxification in higher plants: a minireview, J. Inorg. Biochem., 2003, 97, 46–51 CrossRef CAS PubMed.
- J. Wu, F. Du, P. Zhang, I. A. Khan, J. Chen and Y. Liang, Thermodynamics of the interaction of aluminum ions with DNA: implications for the biological function of aluminum, J. Inorg. Biochem., 2005, 99, 1145–1154 CrossRef CAS PubMed.
- G. D. Fasman, Aluminum and Alzheimer's disease: model studies, Coord. Chem. Rev., 1996, 149, 125–165 CrossRef CAS.
- M. L. Hegde, S. Anitha, K. S. Latha, M. S. Mustak, R. Stein, R. Ravid and K. S. J. Rao, First evidence for helical transitions in supercoiled DNA by amyloid β peptide (1–42) and aluminum, J. Mol. Neurosci., 2004, 22, 19–31 CrossRef PubMed.
- D. P. Perl and A. Brody, Alzheimer's disease: X-ray spectrometric evidence of aluminum accumulation in neurofibrillary tangle-bearing neurons, Science, 1980, 208, 297–299 CrossRef CAS PubMed.
- D. P. Perl, D. C. Gajdusek, R. M. Garruto, R. T. Yanagihara and C. J. Gibbs, Intraneuronal aluminum accumulation in amyotrophic lateral sclerosis and Parkinsonism-dementia of Guam, Science, 1982, 217, 1053–1055 CrossRef CAS PubMed.
- World Health Organization, Aluminium in Drinking-Water: Background Document for Development of WHO Guidelines for Drinking-Water Quality, World Health Organization, 2010, WHO Reference number: WHO/HSE/WSH/10.01/13 Search PubMed.
- European Food Safety Authority (EFSA), Scientific Opinion of the Panel on Food Additives, Flavourings, Processing Aids and Food Contact Materials on a request from European commission on Safety of aluminium from dietary intake, EFSA J., 2008, 754, 1–34 Search PubMed.
- T. Han, X. Feng, B. Tong, J. Shi, L. Chen, J. Zhi and Y. Dong, A novel “turn-on” fluorescent chemosensor for the selective detection of Al3+ based on aggregation-induced emission, Chem. Commun., 2012, 48, 416–418 RSC.
- J.-c. Qin and Z.-y. Yang, Selective fluorescent sensor for Al3+ using a novel quinoline derivative in aqueous solution, Synth. Met., 2015, 209, 570–576 CrossRef CAS.
- J. G. Reyes, P. O. Barrales and A. M. Díaz, Development of a solid surface fluorescence-based sensing system for aluminium monitoring in drinking water, Talanta, 2005, 65, 1203–1208 CrossRef CAS PubMed.
- K. Soroka, R. S. Vithanage, D. A. Phillips, B. Walker and P. K. Dasgupta, Fluorescence properties of metal complexes of 8-hydroxyquinoline-5-sulfonic acid and chromatographic applications, Anal. Chem., 1987, 59, 629–636 CrossRef CAS.
- M. Frankowski, A. Zioła-Frankowska and J. Siepak, New method for speciation analysis of aluminium fluoride complexes by HPLC-FAAS hyphenated technique, Talanta, 2010, 80, 2120–2126 CrossRef CAS PubMed.
- Y.-H. Ma, R. Yuan, Y.-Q. Chai and X.-L. Liu, A new aluminum (III)-selective potentiometric sensor based on N,N′-propanediamide bis(2-salicylideneimine) as a neutral carrier, Mater. Sci. Eng., C, 2010, 30, 209–213 CrossRef CAS.
- A. Sanz-Medel, A. B. S. Cabezuelo, R. Milačič and T. B. Polak, The chemical speciation of aluminium in human serum, Coord. Chem. Rev., 2002, 228, 373–383 CrossRef CAS.
- F. Thomas, A. Masion, J. Y. Bottero, J. Rouiller, F. Montigny and F. Genevrier, Aluminum (III) speciation with hydroxy carboxylic acids. 27Aluminum NMR study, Environ. Sci. Technol., 1993, 27, 2511–2516 CrossRef CAS.
- A. Zioła-Frankowska, M. Frankowski and J. Siepak, Development of a new analytical method for online simultaneous qualitative determination of aluminium (free aluminium ion, aluminium-fluoride complexes) by HPLC-FAAS, Talanta, 2009, 78, 623–630 CrossRef PubMed.
- M. Arduini, F. Felluga, F. Mancin, P. Rossi, P. Tecilla, U. Tonellato and N. Valentinuzzi, Aluminium fluorescence detection with a FRET amplified chemosensor, Chem. Commun., 2003, 1606–1607 RSC.
- V. K. Gupta, A. K. Singh and L. K. Kumawat, Thiazole Schiff base turn-on fluorescent chemosensor for Al3+ ion, Sens. Actuators, B, 2014, 195, 98–108 CrossRef CAS.
- S. Kim, J. Y. Noh, K. Y. Kim, J. H. Kim, H. K. Kang, S.-W. Nam, S. H. Kim, S. Park, C. Kim and J. Kim, Salicylimine-based fluorescent chemosensor for aluminum ions and application to bioimaging, Inorg. Chem., 2012, 51, 3597–3602 CrossRef CAS PubMed.
- Z.-C. Liao, Z.-Y. Yang, Y. Li, B.-D. Wang and Q.-X. Zhou, A simple structure fluorescent chemosensor for high selectivity and sensitivity of aluminum ions, Dyes Pigm., 2013, 97, 124–128 CrossRef CAS.
- G. J. Shree, G. Sivaraman, A. Siva and D. Chellappa, Anthracene-and pyrene-bearing imidazoles as turn-on fluorescent chemosensor for aluminum ion in living cells, Dyes Pigm., 2019, 163, 204–212 CrossRef CAS.
- S. Das, M. Dutta and D. Das, Fluorescent probes for selective determination of trace level Al3+: recent developments and future prospects, Anal. Methods, 2013, 5, 6262–6285 RSC.
- A. Gupta and N. Kumar, A review of mechanisms for fluorescent ‘turn-on’ probes to detect Al3+ ions, RSC Adv., 2016, 6, 106413–106434 RSC.
- M. Sauer, Single-Molecule-Sensitive Fluorescent Sensors Based on Photoinduced Intramolecular Charge Transfer, Angew. Chem., Int. Ed., 2003, 42, 1790–1793 CrossRef CAS PubMed.
- C.-H. Chen, D.-J. Liao, C.-F. Wan and A.-T. Wu, A turn-on and reversible Schiff base fluorescence sensor for Al3+ ion, Analyst, 2013, 138, 2527–2530 RSC.
- J. Kumar, M. J. Sarma, P. Phukan and D. K. Das, A new simple Schiff base fluorescence “on” sensor for Al3+ and its living cell imaging, Dalton Trans., 2015, 44, 4576–4581 RSC.
- S. A. Lee, G. R. You, Y. W. Choi, H. Y. Jo, A. R. Kim, I. Noh, S.-J. Kim, Y. Kim and C. Kim, A new multifunctional Schiff base as a fluorescence sensor for Al3+ and a colorimetric sensor for CN− in aqueous media: an application to bioimaging, Dalton Trans., 2014, 43, 6650–6659 RSC.
- S. Das, U. Mukherjee, S. Pal, S. Maitra and P. Sahoo, Selective sensing of Al3+ ions by nitrophenyl induced coordination: imaging in zebrafish brain tissue, Org. Biomol. Chem., 2019, 17, 5230–5233 RSC.
- A. Hazra, A. Roy, A. Mukherjee, G. P. Maiti and P. Roy, Remarkable difference in Al3+ and Zn2+ sensing properties of quinoline based isomers, Dalton Trans., 2018, 47, 13972–13989 RSC.
- R. Singh, S. Samanta, P. Mullick, A. Ramesh and G. Das, Al3+ sensing through different turn-on emission signals vis-à-vis two different excitations: applications in biological and environmental realms, Anal. Chim. Acta, 2018, 1025, 172–180 CrossRef CAS PubMed.
- S. Sinha, B. Chowdhury and P. Ghosh, A Highly Sensitive ESIPT-Based Ratiometric Fluorescence Sensor for Selective Detection of Al3+, Inorg. Chem., 2016, 55, 9212–9220 CrossRef CAS PubMed.
- B. Platt, G. Fiddler, G. Riedel and Z. Henderson, Aluminium toxicity in the rat brain: histochemical and immunocytochemical evidence, Brain Res. Bull., 2001, 55, 257–267 CrossRef CAS PubMed.
- K. Taïr, O. Kharoubi, O. A. Taïr, N. Hellal, I. Benyettou and A. Aoues, Aluminium-induced acute neurotoxicity in rats: Treatment with aqueous extract of Arthrophytum (Hammadascoparia), J. Acute Dis., 2016, 5, 470–482 CrossRef.
- B. Naskar, A. Bauzá, A. Frontera, D. K. Maiti, C. D. Mukhopadhyay and S. Goswami, A versatile chemosensor for the detection of Al3+ and picric acid (PA) in aqueous solution, Dalton Trans., 2018, 47, 15907–15916 RSC.
- R. Selva Kumar and S. K. A. Kumar, Highly selective fluorescent chemosensor for the relay detection of Al3+ and picric acid, Inorg. Chem. Commun., 2019, 106, 165–173 CrossRef CAS.
- J. Akhavan, The Chemistry of Explosives, Royal Society of Chemistry, 2011 Search PubMed.
- J. Pichtel, Distribution and fate of military explosives and propellants in soil: a review, Appl. Environ. Soil Sci., 2012, 2012, 1–33 CrossRef.
- A. W. Czarnik, A sense for landmines, Nature, 1998, 394, 417–418 CrossRef CAS.
- G. He, H. Peng, T. Liu, M. Yang, Y. Zhang and Y. Fang, A novel picric acid film sensor via combination of the surface enrichment effect of chitosan films and the aggregation-induced emission effect of siloles, J. Mater. Chem., 2009, 19, 7347–7353 RSC.
- S. S. Nagarkar, A. V. Desai and S. K. Ghosh, A fluorescent metal–organic framework for highly selective detection of nitro explosives in the aqueous phase, Chem. Commun., 2014, 50, 8915–8918 RSC.
- U.S. Environmental Protection Agency, Nitrophenols, Ambient Water Qualify Criteria, U.S. Environmental Protection Agency, Washington, DC, 1980.
- K.-M. Wollin and H. Dieter, Toxicological guidelines for monocyclic nitro-, amino-and aminonitroaromatics, nitramines, and nitrate esters in drinking water, Arch. Environ. Contam. Toxicol., 2005, 49, 18–26 CrossRef CAS PubMed.
- J. Ye, L. Zhao, R. F. Bogale, Y. Gao, X. Wang, X. Qian, S. Guo, J. Zhao and G. Ning, Highly Selective Detection of 2, 4, 6-Trinitrophenol and Cu2+ Ions Based on a Fluorescent Cadmium–Pamoate Metal–Organic Framework, Chem.–Eur. J., 2015, 21, 2029–2037 CrossRef CAS PubMed.
- S. Bala, M. Sen, B. Pramanik, S. Khanra, K. M. Fromm, P. Poddar and R. Mandal, Construction of Polymetallic Lanthanide (Ln = DyIII, TbIII, GdIIINdIII) Cage Complexes using novel Pyridine-Pyrazole based ligands: Versatile Molecular Topologies, Luminescent Property and SMM behavior, Inorg. Chem., 2015, 54, 8197–8206 CrossRef CAS PubMed.
- S. Bala, A. Goswami, S. Sengupta, S. Ganguly, S. Bhattacharya, S. Khanra and R. Mondal, Metal-Directed Formation of Molecular Helix, Cage, and Grid Using an Asymmetric Pyridine-Pyrazole Based Bis-Chelating Ligand and Properties, Cryst. Growth Des., 2013, 13, 5068–5075 CrossRef CAS.
- S. Bala, A. Adhikary, S. Bhattacharya, M. Sen Bishwas, P. Poddar and R. Mondal, Ln8 (Ln = Gd, Ho, Er, Yb) Butterfly Core Exhibiting Magnetocaloric Effect and Field-Induced SMM Behavior for Er Analogue, ChemSelect, 2017, 2, 11341–11345 CAS.
- S. Bala, A. De, A. Adhikary, S. Saha, S. Akhtar, K. S. Das, M.-L. Tong and R. Mondal, Influence of Semirigidity and Diverse Binding Modes of an Asymmetric Pyridine-pyrazole Based Bis-chelating Ligand in Controlling Molecular Architectures and Their Properties, Cryst. Growth Des., 2020, 20, 5698–5708 CrossRef CAS.
- S. Bhattacharya, S. Bala and R. Mondal, Ln-MOFs using a Compartmental Ligand with an Unique Combination of hard-soft Terminals and Their Magnetic, Gas Adsorption and Luminescence Properties, CrystEngComm, 2019, 21, 5665–5672 RSC.
- A. De, S. Bala, S. Saha, K. S. Das, S. Akhtar, A. Adhikary, A. Ghosh, G.-Z. Huang, S. P. Chowdhuri, B. B. Das, M.-L. Tong and R. Mondal, Lanthanide Clusters of Phenanthroline Containing Pyridine-Pyrazole Based Ligand: Magnetism and Cell Imaging, Dalton Trans., 2021 10.1039/d0dt04122j.
- C. Exley and J. Derek Birchall, The cellular toxicity of aluminium, J. Theor. Biol., 1992, 159, 83–98 CrossRef CAS PubMed.
- A. Ghosh, S. Bhattacharjee, S. P. Chowdhuri, A. Mallick, I. Rehman, S. Basu and B. B. Das, SCAN1-TDP1 trapping on mitochondrial DNA promotes mitochondrial dysfunction and mitophagy, Sci. Adv., 2019, 5, eaax9778 CrossRef CAS PubMed.
- I. Rehman, S. Basu, S. K. Das, S. Bhattacharjee, A. Ghosh, Y. Pommier and B. B. Das, PRMT5-mediated arginine methylation of TDP1 for the repair of topoisomerase I covalent complexes, Nucleic Acids Res., 2018, 46, 5601–5617 CrossRef CAS PubMed.
- M. J. Frisch, G. W. Trucks, H. B. Schlegel, G. E. Scuseria, M. A. Robb, J. R. Cheeseman, G. Scalmani, V. Barone, B. Mennucci, G. A. Petersson, H. Nakatsuji, M. Caricato, X. Li, H. P. Hratchian, A. F. Izmaylov, J. Bloino, G. Zheng, J. L. Sonnenberg, M. Hada, M. Ehara, K. Toyota, R. Fukuda, J. Hasegawa, M. Ishida, T. Nakajima, Y. Honda, O. Kitao, H. Nakai, T. Vreven, J. A. Montgomery Jr, J. E. Peralta, F. Ogliaro, M. Bearpark, J. J. Heyd, E. Brothers, K. N. Kudin, V. N. Staroverov, R. Kobayashi, J. Normand, K. Raghavachari, A. Rendell, J. C. Burant, S. S. Iyengar, J. Tomasi, M. Cossi, N. Rega, J. M. Millam, M. Klene, J. E. Knox, J. B. Cross, V. Bakken, C. Adamo, J. Jaramillo, R. Gomperts, R. E. Stratmann, O. Yazyev, A. J. Austin, R. Cammi, C. Pomelli, J. W. Ochterski, R. L. Martin, K. Morokuma, V. G. Zakrzewski, G. A. Voth, P. Salvador, J. J. Dannenberg, S. Dapprich, A. D. Daniels, Ö. Farkas, J. B. Foresman, J. V. Ortiz, J. Cioslowski and D. J. Fox, Gaussian 09, (Revision A.08), Gaussian, Inc., Wallingford CT, 2009 Search PubMed.
- A. D. Becke, Density-functional thermochemistry. III. The role of exact exchange, J. Chem. Phys., 1993, 98, 5648–5652 CrossRef CAS.
- C. Lee, W. Yang and R. G. Parr, Development of the Colle-Salvetti correlation-energy formula into a functional of the electron density, Phys. Rev. B: Condens. Matter Mater. Phys., 1988, 37, 785–789 CrossRef CAS PubMed.
- C. Gonzalez and H. B. Schlegel, Reaction path following in mass-weighted internal coordinates, J. Phys. Chem., 1990, 94, 5523–5527 CrossRef CAS.
- A. Klamt and G. Schüürmann, COSMO: a new approach to dielectric screening in solvents with explicit expressions for the screening energy and its gradient, J. Chem. Soc., Perkin Trans. 2, 1993, 799–805 RSC.
- Crystallographic data for compound H2DPC (C16H13N5O3): CCDC deposition number = 2052615, chemical formula weight = 323.31, monoclinic, space group: P21/c, a = 15.476(9) Å, b = 11.366(7) Å, c = 16.349(9) Å, α = 90°, β = 90.290°(17), γ = 90°, V =2876(3) Å3, R1 = 0.0635, wR2 = 0.1599, Z = 8, reflections collected = 25084, unique reflections = 6258, observed reflections [I > 2σ(I)] = 3914, D = 1.494 g cm−3, μ = 0.108 mm−1.
Footnotes |
| † Electronic supplementary information (ESI) available. CCDC 2052615. For ESI and crystallographic data in CIF or other electronic format see DOI: 10.1039/d1ra00082a |
| ‡ Contributed equally. |
| This journal is © The Royal Society of Chemistry 2021 |

