 Open Access Article
Topological investigation of the reaction mechanism of glycerol carbonate decomposition by bond evolution theory†
Abel Idrice Adjieufack abc,
Vincent Liégeois
 *c,
Ibrahim Mbouombouo Ndassa
 b and
Benoît Champagne
 *c
*c
aPhysical and Theoretical Chemistry Laboratory, University of Yaoundé 1, Cameroon
bComputational Chemistry Laboratory, High Teacher Training College, University of Yaoundé 1, Cameroon
cLaboratory of Theoretical Chemistry and Namur Institute of Structured Matter (NISM), University of Namur, Rue de Bruxelles, 61, B-5000 Namur, Belgium. E-mail: vincent.liegeois@unamur.be; benoit.champagne@unamur.be
First published on 9th March 2021
Abstract
The reaction mechanisms of the decomposition of glycerol carbonate have been investigated at the density functional theory level within the bond evolution theory. The four reaction pathways yield to 3-hydroxypropanal (TS1), glycidol (TS2a and TS2b), and 4-methylene-1,3-dioxolan-2-one (TS3). The study reveals non-concerted processes with the same number (four) of structural stability domains for each reaction pathway. For the two decarboxylation mechanisms, the two first steps are similar. They correspond to the cleavage of two single CO bonds to the detriment of the increased population of the lone pairs of two O atoms. These are followed, along TS1, by the transformation of a CO single bond into a double bond together with a proton transfer to create a CH bond. For TS2a and TS2b, the last step is a cyclization by CO bond formation. For the TS3 pathway, the first stage consists in the cleavage of a CH bond and the transfer of its electron population to both a proton and a C atom, the second step corresponds to the formation of an OH bond, and the last one describes the formation of a CC double bond. Moreover, the analysis of the energies, enthalpies, and free enthalpies of reaction and of activation leads to the conclusion that 3-hydroxypropanal is both the thermodynamic and kinetic product, independent of the method of calculation.
1. Introduction
Glycerol carbonate is a stable and colorless liquid deriving from the molecule of glycerol. The molecule is attracting the interest of the academic and industrial communities since it can be used as a novel component of gas separation membranes, of surfactants, detergents, and coatings and also as a nonvolatile solvent for several types of materials, including in the paint industry.1–5 Glycerol carbonate is also a source of new polymeric materials for the production of polycarbonates and polyurethanes.6,7 The search for different synthetic processes of glycerol carbonate has increased in parallel with its applications.8 For that, the selected strategy for its synthesis relies on basic experimental criteria such as low reaction time, simple separation and purification methods, and catalytic activity and selectivity.9 For some time, several experimental and computational chemistry studies have been devoted to the synthesis as well as to the reactivity and decomposition of glycerol carbonate.Zhang et al.10 have reported on the synthesis of glycerol carbonate from glycerol and urea (Scheme 1), where under microwave irradiation and in the presence of ZnSO4 as catalyst, glycerol carbonate is formed with high yield (93.7%). Juanjuan et al.11 have studied the same reaction using acidic, basic, and neutral ionic liquids as catalysts. They showed that neutral ionic liquids present a good catalytic activity due to the synergistic effects of the cation and anion (the cation activates urea while the anion activates glycerol).
Similarly to the previous work, Ochoa-Gómes et al.3 reported the synthesis of glycerol carbonate by transesterification of glycerol and dimethyl carbonate in the presence of homogeneous (H2SO4, KOH, NaOH and K2CO3) and heterogeneous (CaO, CaCO3 and MgO) catalysts (Scheme 2). These authors found that a very high conversion yield is obtained when using base catalysts. Employing another catalytic procedure, Hongguang et al.12 have synthesized the glycerol carbonate through the direct carbonylation of glycerol with carbon dioxide over heterogenous catalysts, modified by halogen anions (F−, Cl− and Br−) because they present a high catalytic activity (Zn/Al/La/X, with X = F, Cl and Br).
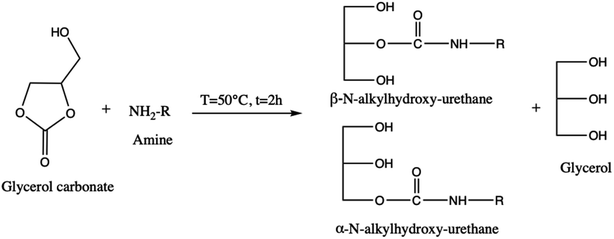
About its reactivity, Nohra et al.13 have studied the aminolysis reaction of glycerol carbonate (Scheme 3). They showed that in the presence of primary amine, both in organic and hydroorganic media, the reaction leads to the formation of two isomers of hydroxyurethane as well as to a partial decomposition of glycerol carbonate into glycerol. Furthermore, during the esterification process, the glycerol carbonate formed in the presence of catalysts (anhydrous sodium sulfate14 and zeolites4) can be decomposed into glycidol (employed in textile, plastics, pharmaceutical, and cosmetics industries)15–17 and generate carbon dioxide (Scheme 4).
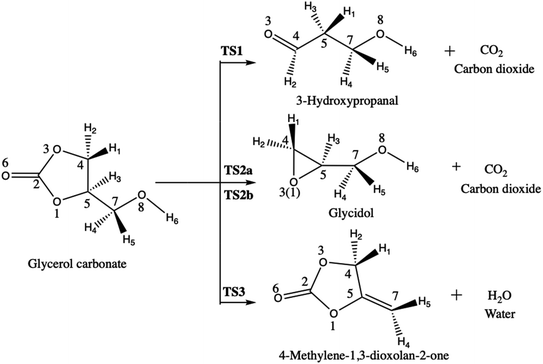
However, when used as biofuel or fuel additive, the pyrolysis of glycerol carbonate could generate carbon dioxide, water, and carbon monoxide molecule. Following this, Sőzri et al.18 have explored the different possible reaction pathways of glycerol carbonate pyrolysis by combining ab initio and RRKM-master equation methods (Scheme 5). They have found that CO2 and 3-hydroxypropanal molecules are the exclusive products for the pyrolysis of glycerol carbonate at 800–2000 K. Sőzri et al.18 have also studied theoretically (MP2/cc-pVTZ level) the potential energy surface (geometrical and thermodynamic aspects) of the different reaction channels of decomposition of glycerol carbonate. Three pathways were unraveled. They differ by the nature of the molecule that is released, carbon dioxide (pathways 1 and 2a–b) or water (pathway 3) (Scheme 5). Each reactive pathway of the decomposition process involves breaking and forming chemical bonds, but these detailed chemical insights have not yet been unraveled. This is the topic of the current investigation.
To provide a mathematical basis for describing the chemical bonds drawn following Lewis theory,19 an approach based on the analysis of electron density topology is needed. This idea is inspired by cartography, where geographers are used to share the land in river basins, lakes, oceans, etc. A basin is where every drop of water ends its existence. Similarly, mathematicians have generalized this type of concept in a theory known as the theory of dynamical systems. The sharing of space is conditioned by the nature of the mathematical function used and the physico-chemical information it possesses. In the 1990s, from quantum chemistry calculations Bader20,21 proposed to carry out a topological analysis of the simplest local function, namely the electron density through a theory named “quantum theory of atoms in molecule (QTAIM)”. The QTAIM method uses a topological approach to study electron density and to break down the molecular space into atomic domains. It also allows certain electron density properties to be integrated into the “volume of an atom” in order to access atomic properties such as partial charges. This method is based on the topological analysis of the gradients of the density and gives an atomic picture of the system. Though it provides an objective definition of the atoms in the molecule, QTAIM theory has its limitations. It does not provide information on the electron pairing, a concept universally used in chemistry. On the other hand, Electron Localization Functions (ELFs) give a more complete description of the chemical bond.22,23 For more than twenty years, the topological analysis of the ELFs has been adapted to the study of different types of chemical bonds24–26 and reaction mechanisms.27–41 Indeed, such an approach enables to divide the space into different regions corresponding to the chemical objects developed in Lewis valence theory19 or in the Valence Shell Electron Pair Repulsion (VSEPR) theory,42–44 i.e. the bonds, free pairs, π systems, etc.
The main objective of this paper is to analyze the changes of electron density associated to the different reaction pathways for the decomposition of glycerol carbonate proposed by Sőzri et al.18 However, in our analysis, for the formation of glycidol, the two reaction pathways, where either O3 attacks C5 (TS2a) or O1 attacks C4 (TS2b), are considered while only the later pathway was investigated in ref. 18. To achieve this, electron localization functions combined with catastrophe theory are employed in order to describe: (1) how the electron density rearranges during the decomposition pathways, (2) how the electron flow accompanies the bond breaking/forming processes, and (3) whether the mechanism is stepwise or concerted. These issues are important for understanding the nature of the decomposition mechanism of glycerol carbonate.
2. Theoretical and computational background
Defined in 1990 by Becke and Edgecombe,22 the electron localization function (ELF) denoted (η) quantifies the maximal probability for finding an electron pair in a molecule or a crystal. The following equation gives its mathematical expression:
 | (1) |
 is the electron localization of the targeted system while
  is the one for a homogenous electron gas. Expressions for these two quantities read:
 | (2) |
 | (3) |
 is the kinetic energy density and
  is the electron spin density for spin σ. Within this topological analysis, the electron localization functions allow to divide the molecular space into different basins following the Silvi–Savin approach.45 In accordance with a clear chemical signification, two types of basins are identified: core and valence basins. Valence basins are necessary for the description of the chemical bonds and can also be subdivided into two classes, namely monosynaptic basins [V(A)] and disynaptic basins [V(A,B)]. The monosynaptic basins describe lone pairs while disynaptic basins describe shared electrons. For the labeling of the different basins [V(A) and V(A,B)], we have decided, consistently with Lewis theory, to use SB(A,B) for a single bond between atoms A and B, DB(A,B) for a double bond, LP(A) for a lone pair and P(A) for positive charge on atom A.
The electronic structures as well as the fully optimized ground state geometries of the reactants, products, and transition states were first determined with a selection of DFT exchange-correlation (XC) functionals, namely B3LYP,46 ωB97X-D47 and M06-2X,48 and the 6-311G(d,p) basis set. The synchronous transit-guided quasi-Newton method49 was used to locate the transition state structures. The vibrational frequencies were calculated for the optimized structures. The calculations confirmed that the latter are minima on the potential energy hypersurface for the reactants (all frequencies are real) or saddle points for transition states (one frequency is imaginary). These data were used in a statistical thermodynamics treatment in order to evaluate the enthalpies, entropies, and free enthalpies of activation and reaction at T = 298.15 K and P = 1 atm. Then, to select the best XC functional for the topological analysis, additional calculations were performed at the second-order Møller–Plesset perturbation theory (MP2)50 and coupled-cluster singles, doubles, and perturbative triples [CCSD(T)]51 levels of approximation. The same types of calculations were carried out at the MP2/6-311G(d) level as with DFT. Then, using the geometries of the transition states, reactants, and products, as optimized at the MP2/6-311G(d) level, single point MP2 and CCSD(T) calculations were performed with a selection of Dunning atomic basis sets (cc-pVDZ, cc-pVTZ, cc-pVQZ, aug-cc-pVDZ, and aug-cc-pVTZ). These enable to provide reference values for the enthalpies and free enthalpies of reaction by combining the single point CCSD(T) electronic energies with the thermal and entropic MP2 contributions. Note that CCSD(T) vibrational frequencies and therefore thermal and entropic corrections are beyond reach for these reactions with our current computational resources.
The topological analysis within the BET theory was carried out at the M06-2X/6-311G(d,p) level. First, the wavefunction was obtained for each point of the IRCs52–54 and, then, the ELF analysis was enacted by using the TopMod package55 considering a grid step of 0.2 bohr. The ELF basin positions are visualized using the DrawMol56 and the basin populations evolution along the IRC by DrawProfile.57 All first principles calculations were performed using the Gaussian16 package.58
3. Results and discussions
3.1. Thermodynamical and geometrical aspects
The decomposition of glycerol carbonate takes place through four reaction pathways via the transition states TS1, TS2(a–b), and TS3 yielding respectively to 3-hydroxypropanal (P1), glycidol (P2), and 4-methylene-1,3-dioxolan-2-one (P3) (Scheme 5). Only R-glycerol carbonate was considered because the same results would be obtained with its enantiomer. Note also that the absolute configuration is kept along the reaction pathways so that only R-glycidol is formed along TS2a–b (the other products are not chiral). Table 1 displays the activation and reaction energies (ΔE, ΔH°, ΔS°, and ΔG°) of all species engaged in these different pathways, as determined at different levels of approximation. Reference ΔE values were obtained at the CCSD(T)/cc-pVQZ level of approximation, owing to their convergence as a function of the basis set size (Table S1 in ESI†). The reference ΔH° and ΔG° values were then obtained by considering thermal and entropic corrections evaluated at the MP2 level. At that reference level, the decomposition of glycerol carbonate into 3-hydroxypropanal via transition state TS1 is the most favored reaction pathway. In fact, ΔE of TS1 is 6.2 and 7.4 kcal mol−1 lower than those TS2a and TS2b, which correspond to the formation glycidol. Consistent trends are observed for the ΔH° (7.5 and 8.7 kcal mol−1) and ΔG° (7.1 and 8.1 kcal mol−1) of activation. So, the attack of C5 by O3 (TS2a) is slightly more favorable than the attack of C4 by O1 (TS2b). Unlike these transition states leading to the release of carbon dioxide, TS3, which defines a path towards the dehydration of glycerol carbonate, has a larger ΔE (1.3 kcal mol−1), ΔH° (0.9 kcal mol−1) and ΔG° (2.0 kcal mol−1) than TS1, while it is lower than TS2a and TS2b. Considering these activation energy values, the formation of 3-hydroxypropanal and 4-methylene-1,3-dioxolan-2-one are more feasible reaction pathways for the decomposition of glycerol carbonate than the formation of glycidol. In agreement with the work of Sőzri et al.,18 the decarboxylation yielding to 3-hydroxypropanal (P1) is thermodynamically more favorable than those leading to the formation of glycidol (P2) and 4-methylene-1,3-dioxolan-2-one (P3). The formations of P1 and P3 are exergonic with ΔG° values of −18 and −5 kcal mol−1 whereas the reaction leading to P2 is endergonic (ΔG° = 5 kcal mol−1).| ΔE | ΔH° | ΔS° | ΔG° | |
|---|---|---|---|---|
| B3LYP/6-311G(d,p) | ||||
| TS1 | 63.4 | 58.6 | 4.4 | 57.3 |
| TS2a | 69.1 (7.7) | 65.8 (7.2) | 5.6 (1.2) | 64.1 (6.8) |
| TS2b | 71.8 (8.4) | 68.3 (9.7) | 5.1 (0.7) | 66.8 (9.5) |
| TS3 | 70.5 (7.1) | 65.4 (6.8) | −1.3 (5.6) | 65.8 (8.5) |
| P1(+CO2) | −10.3 | −13.1 | 41.7 | −25.5 |
| P2(+CO2) | 14.6 (24.9) | 12.1 (25.2) | 39.0 (−2.7) | 0.4 (25.9) |
| P3(+H2O) | 11.2 (21.5) | 7.6 (20.7) | 36.4 (−5.4) | −3.2 (22.3) |
![[thin space (1/6-em)]](https://www.rsc.org/images/entities/char_2009.gif) |
||||
| M06-2X/6-311G(d,p) | ||||
| TS1 | 72.4 | 67.6 | 3.1 | 66.7 |
| TS2a | 82.0 (9.6) | 78.8 (11.2) | 12.1 (9.0) | 77.4 (10.7) |
| TS2b | 83.8 (11.4) | 80.5 (12.8) | 4.5 (1.5) | 79.2 (12.5) |
| TS3 | 74.5 (2.1) | 69.8 (2.1) | −0.7 (3.7) | 70.0 (3.3) |
| P1(+CO2) | 0.4 | −2.5 | 42.2 | −15.2 |
| P2(+CO2) | 20.8 (20.5) | 18.2 (15.7) | 40.0 (−2.8) | 6.3 (21.5) |
| P3(+H2O) | 16.7 (16.3) | 13.0 (10.5) | 37.7 (−4.5) | 1.8 (17.0) |
![[thin space (1/6-em)]](https://www.rsc.org/images/entities/char_2009.gif) |
||||
| ωB97X-D/6-311G(d,p) | ||||
| TS1 | 69.6 | 64.9 | 2.9 | 64.0 |
| TS2a | 77.1 (7.5) | 73.8 (8.9) | 17.7 (14.8) | 72.5 (8.5) |
| TS2b | 79.3 (9.7) | 76.0 (11.1) | 3.5 (0.6) | 74.9 (10.9) |
| TS3 | 74.3 (4.7) | 69.4 (4.5) | −1.8 (4.7) | 69.9 (5.9) |
| P1(+CO2) | −4.1 | −7.1 | 41.7 | −19.5 |
| P2(+CO2) | 19.2 (23.2) | 16.6 (23.7) | 38.7 (−3.0) | 5.1 (24.6) |
| P3(+H2O) | 15.6 (19.7) | 12.0 (19.1) | 36.2 (−5.5) | 1.3 (20.8) |
![[thin space (1/6-em)]](https://www.rsc.org/images/entities/char_2009.gif) |
||||
| MP2/6-311G(d,p) | ||||
| TS1 | 72.4 | 67.9 | 2.5 | 67.1 |
| TS2a | 81.3 (8.9) | 78.1 (10.2) | 12.4 (9.9) | 76.9 (9.8) |
| TS2b | 82.5 (10.1) | 79.3 (11.4) | 4.7 (2.2) | 77.9 (10.8) |
| TS3 | 74.9 (2.5) | 70.0 (2.1) | −1.0 (3.5) | 70.3 (3.2) |
| P1(+CO2) | −11.7 | −14.7 | 42.8 | −27.5 |
| P2(+CO2) | 12.5 (24.2) | 9.8 (24.5) | 39.8 (−3.0) | −2.0 (25.5) |
| P3(+H2O) | 14.6 (26.3) | 10.7 (25.4) | 41.4 (−1.5) | −1.6 (25.9) |
![[thin space (1/6-em)]](https://www.rsc.org/images/entities/char_2009.gif) |
||||
| CCSD(T)/cc-pVQZ [MP2 thermal and entropy contributions] | ||||
| TS1 | 77.4 | 72.9 | 2.5 | 72.1 |
| TS2a | 83.6 (6.2) | 80.4 (7.5) | 12.4 (9.9) | 79.2 (7.1) |
| TS2b | 84.8 (7.4) | 81.6 (8.7) | 4.7 (2.2) | 80.2 (8.1) |
| TS3 | 78.7 (1.3) | 73.8 (0.9) | −1.0 (3.5) | 74.1 (2.0) |
| P1(+CO2) | −2.2 | −5.2 | 42.8 | −18.0 |
| P2(+CO2) | 19.9 (22.1) | 17.2 (22.4) | 39.8 (−3.0) | 5.4 (23.4) |
| P3(+H2O) | 11.6 (13.8) | 7.7 (12.9) | 41.4 (−1.5) | −4.6 (13.4) |
From comparing the results obtained with the three XC functionals together with the 6-311G(d,p) basis set to the reference values, one finds that M06-2X is performing best and for this reason M06-2X was selected for the BET analysis. The ωB97X-D results agree slightly less with the reference than the M06-2X ones but both M06-2X and ωB97X-D demonstrate superior reliability than B3LYP. This holds for both the absolute energies (in the broad sense) of reaction and activation as well as for their relative values. Typically, B3LYP underestimates the ΔE of activation by 8–14 kcal mol−1, ωB97X-D by 1–6 kcal mol−1, while M06-2X and MP2 by 1–5 kcal mol−1. After adding the thermal and entropic effects, the differences with respect to the reference values for the ΔG° of activation are similar to those observed for ΔE. Then, M06-2X overestimates the ΔE of reaction by 1–5 kcal mol−1. For comparison, ωB97X-D and MP2 underestimate (P1) or overestimate (P2 and P3) these energies of reaction while B3LYP systematically underestimates these by 1 to 8 kcal mol−1. The trends are similar for the enthalpies and free enthalpies of reactions. Still the latter are systematically more negative by about 12 kcal mol−1 since the reactions release CO2 or H2O, which is accompanied by an increase of entropy, of the order of 40 cal mol−1 K−1.
Key bond length values of the optimized geometries of the TSs are given in Fig. 1. For the TS1 and TS2 engaged in the decarboxylation process, the lengths of broken O–C bonds attain 2.255 Å (O1–C5) and 1.667 Å (C2–O3) for TS1, 1.655 Å (C2–O3) and 2.316 Å (O1–C5) for TS2a, and 1.630 Å (O1–C2) and 2.240 Å (O3–C4) for TS2b. Differences between the lengths of the broken C–O bonds are small for these three transition states. In TS1, the hydrogen transfer has already partly taken place since the H1–C4 bond length has increased to 1.205 Å while the H1–C5 bond has started to form with a distance of 1.602 Å. For TS3 belonging to the water elimination channel, the bond lengths of the breaking bonds are: 1.660 Å (H3–C5) while the H3–O8 bond is almost formed [d(H3–O8) = 1.096 Å]. Then, using the geometrical structures of the TSs of the decarboxylation processes, an asynchronicity parameter (AS) of the bond cleavage was estimated by taking the difference between the lengths of the breaking bonds, AS = |dO1–C5 − dC2–O3|. The AS values amount to 0.59 Å at TS1, 0.66 Å at TS2a, and 0.61 Å at TS2b. For the water elimination process, the AS value was estimated from the difference of the variations of bond lengths between TS3 and the reactant (glycerol carbonate, GC): AS = |ΔdH3–C5 − ΔdC7–O8| with ΔdH3–C5 = dH3–C5(TS3) − dH3–C5(GC) and ΔdC7–O8 = dC7–O8(TS3) − dC7–O8(GC). AS of TS3 amounts to 0.31 Å. This suggests a stronger asynchronous character for the decarboxylations (TS1, TS2a, and TS2b) than for the water elimination (TS3).
 | ||
| Fig. 1 M06-2X/6-311G(d,p) optimized geometries of TSs engaged in the decomposition of glycerol carbonate. | ||
3.2. Bond evolution theory analysis along the decomposition pathways
A BET analysis was performed for the four reactions pathways, by focusing on the electron populations of the atoms engaged in the decomposition processes. Scheme 5 has given the atoms labeling adopted for the BET analysis.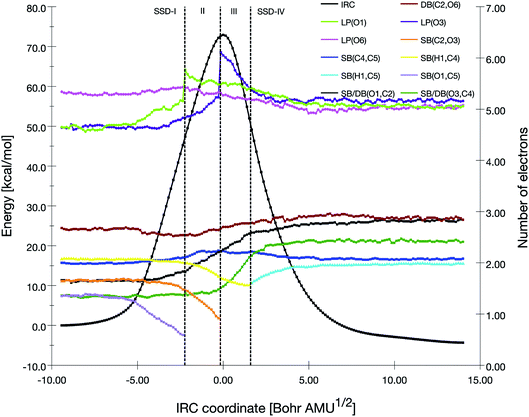 | ||
| Fig. 2 Population evolution (in e) of selected basins along the IRC associated with the TS1 reaction pathway together with the relative potential energy curve. | ||
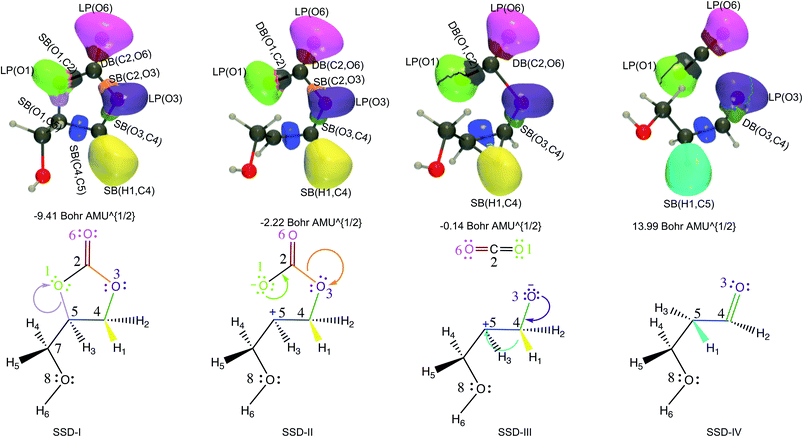 | ||
| Fig. 3 ELF basin isosurfaces (η = 0.75) for specific points of the successive structural stability domains and Lewis structures along TS1 reaction pathway. The color labeling of the basins was performed according to Fig. 2 and for each point, the corresponding intrinsic reaction coordinate is provided. | ||
At the beginning of SSD-II, the disynaptic SB(O1,C5) disappears and its electron population is transferred to LP(O1), which records an increase of 1.12 e. A similar topological transformation takes place at the SSD-II to SSD-III boundary (just before the TS) with the breaking of the SB(C2,O3) and the increase of LP(O3) basin population, which then reaches 6.11 e. Then, the electron populations of the LPs decrease, the populations of SB(O1,C2) and SB(O3,C4) increase and the single bonds are transformed into double bonds. This occurs during domains SSD-II and SSD-III, respectively. At the end of the SSD-III domain, the two SB/DB(O1,C2) and SB/DB(O3,C4) disynaptic basins hold 2.57 and 2.11 e, as electron population.
The final domain SSD-IV begins with the transformation of the SB(H1,C4) basin into SB(H1,C5) basin. This chemical topological change illustrates the hydrogen transfer between the C4 and C5 carbon atoms. The population of SB(H1,C5) at the end of SSD-IV (1.98 e) is almost equal to the one of SB(H1,C4) at the beginning of SSD-I (2.07 e). In addition, the populations of DB(O3,C4) and LP(O3) basins are 2.41 and 5.16 e, respectively. This high population of SB/DB(O3,C4) basin illustrates the total transformation of the single O3–C4 to a double bond, where the electron population is coming from the LP(O3) basin.
When examining the electron population of the lone pairs LP(O1), LP(O3) and LP(O6), at the beginning and the end of the reaction, we observe a transition from a situation that distinguishes the keto (C![[double bond, length as m-dash]](https://www.rsc.org/images/entities/char_e001.gif) O) and ether (C–O–C′) functional groups to a situation with three similar keto functions.
O) and ether (C–O–C′) functional groups to a situation with three similar keto functions.
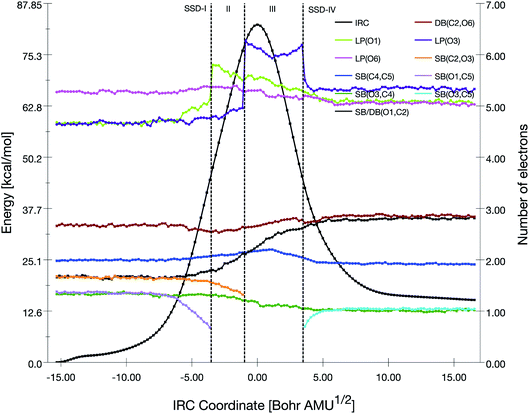 | ||
| Fig. 4 Population evolution (in e) of selected basins along the IRC associated with the TS2a reaction pathway together with the relative potential energy curve. | ||
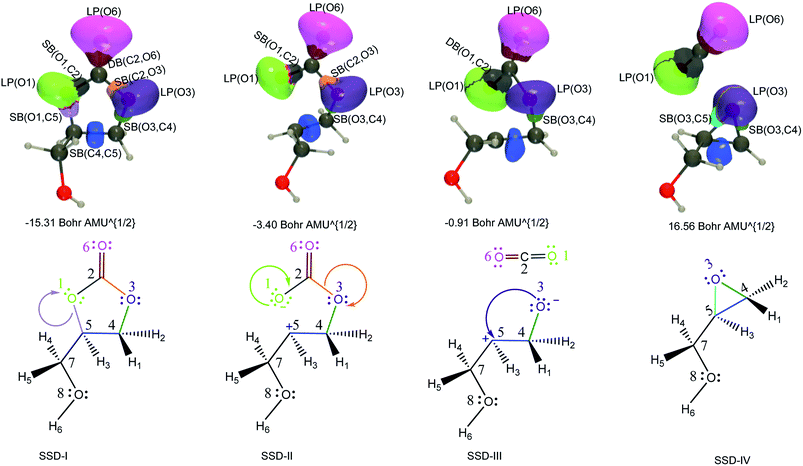 | ||
| Fig. 5 ELF basin isosurfaces (η = 0.75) for specific points of the successive structural stability domains and Lewis structures along TS2a reaction pathway. The color labeling of the basins was performed according to Fig. 4 and, for each point, the corresponding intrinsic reaction coordinate is provided. | ||
The TS2b reaction pathway is described by an equivalent BET analysis, besides the fact that the atoms are interchanged (Fig. S1, S2 and Table S4†). In the present case, the successive events are 1°) the disappearance of the SB(O3,C4) basin and the transfer of the electron population to LP(O3), 2°) the disappearance of the SB(O1,C2) basin and the transfer of the electron population to LP(O1), and 3°) the formation of SB(O1,C4) and the decrease of the population of LP(O1).
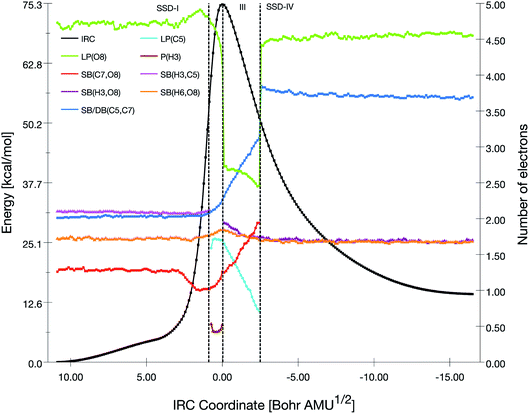 | ||
| Fig. 6 Population evolution (in e) of selected basins along the IRC associated with the TS3 reaction pathway together with the relative potential energy curve. | ||
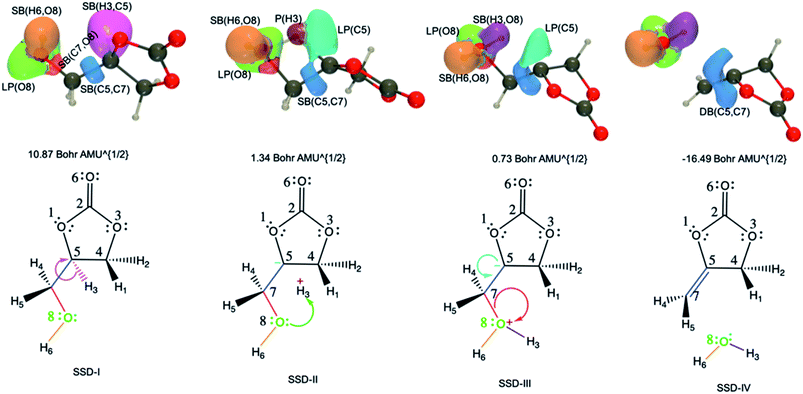 | ||
| Fig. 7 ELF basin isosurfaces (η = 0.75) for specific points of the successive structural stability domains and Lewis structures along TS3 reaction pathway. The color labeling of the basins was performed according to Fig. 6 and, for each point, the corresponding intrinsic reaction coordinate is provided. | ||
The initial topology (SSD-I) includes disynaptic basins SB(C7,O8) with 1.26 e, SB(C5,C7) with 2.01 e, SB(H3,C5) with 2.10 e, and the monosynaptic basin LP(O8) with 4.73 e. The transition from SSD-I to SSD-II corresponds to the transformation of the SB(H3,C5) basin into two monosynaptic basins, namely P(H3) and LP(C5), which illustrates the cleavage of the H3–C5 bond. This cleavage generates two pseudo centers with a positive charge on H3 hydrogen atom and a negative one on carbon C5. So, at the beginning of SSD-II, P(H3) has an electron population of 0.53 e while LP(C5) holds 1.59 e. This P(H3) monosynaptic basin disappears at the beginning of the third domain with the creation of the SB(H3,O8) disynaptic basin having an electron population of 1.94 e. This corresponds to the attack of the positive charge on the H3 hydrogen atom by one of the lone pairs of O8 to form a single bond.
Along SSD-III, the LP(C5) population decreases together with a simultaneous increase of SB(C7,O8) and SB(C5,C7). In fact, the latter disynaptic SB basin is transformed into a double bond, as evidenced by the increase of its electron population from 2.10 to 3.12 e. At the beginning of SSD-IV, the disynaptic basin SB(C7,O8) with 1.94 e disappears to the detriment LP(O8), which whom the population increases by the same amount. This consists of the liberation of a water molecule. Simultaneously, the transfer of the remaining electron population of LP(C5) to DB(C5,C7) is completed.
4. Conclusions
The decomposition reaction of glycerol carbonate has been investigated using a combination of first principles methods, density functional theory as well as the MP2 and CCSD(T) wavefunction methods. Four reaction pathways yielding to 3-hydroxypropanal (TS1), glycidol (TS2a and TS2b), and 4-methylene-1,3-dioxolan-2-one (TS3), have been revealed and analyzed. They correspond to the decarboxylation (TS1, TS2a, and TS2b) and dehydration (TS3) of glycerol carbonate. The analysis of the energies, enthalpies, and free enthalpies of reaction and of activation leads to the conclusion that the 3-hydroxypropanal is the thermodynamic and kinetic product, independently of the method of calculation. Comparisons between reference wavefunction values and the DFT results highlight the best performance of the M06-2X XC functional, followed by ωB97X-D, both being more reliable than B3LYP. The M06-2X XC functional has therefore been selected to unravel the successive bond breaking and bond formation processes along the reaction coordinates, using electron localization functions within bond evolution theory.Along the reaction pathways towards the formation of 3-hydroxypropanal (TS1), four SSDs have been recorded and are summarized as follows: (1) the first two stages deal with breaking of the O1–C5 and C2–O3 single bonds in favor of an increase of the electron population on the O1 and O3 lone pairs, followed (2) by the transformation of the O3–C4 single bond into a double bond owing to the transfer of the lone pair on O3, while (3) the last stage corresponds to the hydrogen transfer between the C4 and C5 atoms. For the glycidol formation (TS2a), the two first stages are identical to TS1 but then the O3 lone pair forms a single bond with the C5 atom. There is an alternative pathway (TS2b), leading to the same product via the formation of the O1–C4 bond instead of the O3–C5 one. The TS2b free enthalpy of activation is only 1 kcal mol−1 higher than that of the TS2a pathway. For the dehydration process, four SSDs have also been identified. The first stage corresponds to splitting of the SB(H3–C5) disynaptic basin into the P(H3) and LP(C5) monosynaptic basins. At the second stage, the O8–H3 bond is formed while the last one stage corresponds the C5–C7 double bond formation resulting from to the disappearance of lone pair on C5.
This BET analysis along the processes leading to the formation 3-hydroxypropanal and glycidol have showed that the disappearance of electron population of two disynaptic basins SB(O1,C5) and SB(C2,O3) is related to an increase of energy, leading to the transition state. The topological changes linked to these two bond cleavages occur with additive energy costs of 45 and 27 kcal mol−1 for TS1, 44 (49) and 32 (26) kcal mol−1 for TS2a (TS2b), respectively, with respect to the origin of their IRC curves. On the other hand, for the formation of 4-methylene-1,3-dioxolan-2-one, the first topological change (cleavage of the H3–C5 bond) needs 55 kcal mol−1 while the formation of the SB(H3,O8) disynaptic basin requires additionally 29 kcal mol−1 more. Finally, the last topological change (transformation of the O3–C4 single bond to a double bond, the cyclization by the creation of the O3–C5/O1–C4 bond, and transformation of the C5–C7 single bond into a double bond gives back between 70 and 80 kcal mol−1.
Conflicts of interest
There are no conflicts to declare.Acknowledgements
A. I. A. thanks the University of Namur (Belgium) for his UNamur-CERUNA PhD Mobility Fellowship. V. L. thanks the F.R.S.-FNRS for his Research Associate position. The calculations were performed on the computers of the Consortium des Équipements de Calcul Intensif (CÉCI, http://www.ceci-hpc.be) and particularly those of the Technological Platform of High-Performance Computing, for which the authors gratefully acknowledge the financial support of the FNRS-FRFC, of the Walloon Region, and of the University of Namur (Conventions no. 2.5020.11, GEQ U.G006.15, 1610468, and RW/GEQ2016).References
- M. O. Sonnati, S. Amigoni, E. P. Tan de Givenchy, T. Darmanin, O. Choulet and F. Guittard, Green Chem., 2013, 15, 283–306 RSC.
- A. Behr, J. Eilting, K. Irawadi, J. Leschinski and F. Lindner, Green Chem., 2008, 10, 13–30 RSC.
- J. R. Ochoa-Gómez, O. Gómez-Jiménez-Aberasturi, B. Maestro-Madurga, A. Pesquera-Rodrguez, C. Ramirez-Lopez, L. Lorenzo-Ibarreta, J. Torrecilla-Soria and M. C. Villaran-Velasco, Appl. Catal., A, 2009, 366, 315–324 CrossRef.
- M. Pagliaro, R. Ciriminna, H. Kimura, M. Rossi and C. DellaPina, Angew. Chem., Int. Ed., 2007, 46, 4434–4440 CrossRef CAS PubMed.
- C. Vieville, J. W. Yoo, S. Pelet and Z. Mouloungui, Catal. Lett., 1998, 56, 245–247 CrossRef CAS.
- Z. Ilham and S. Saka, SpringerPlus, 2016, 5, 1–6 CrossRef CAS PubMed.
- G. Rokicki, P. Rakoczy, P. Parzuchowski and M. Sobiecki, Green Chem., 2005, 7, 529–539 RSC.
- C. Magniont, G. Escadeillas, C. Oms-Multon and P. De Caro, Cem. Concr. Res., 2010, 40, 1072–1080 CrossRef CAS.
- J. R. Ochoa-Gómez, O. Gómez-Jiménez-Aberasturi, C. Ramérez-López and M. Belsué, Org. Process Res. Dev., 2012, 16, 389–399 CrossRef.
- L. Zhang, Z. Zhang, C. Wu, Q. Q. J. Ma, L. Jiang and B. Han, Pure Appl. Chem., 2017, 90, 1–6 CrossRef.
- C. Juanjuan, W. Chang, D. Bin, L. Wenguang, H. Jun, G. Rile and G. Yanan, Chin. J. Catal., 2015, 36, 336–343 CrossRef.
- L. Hongguang, X. Chunling, J. Xi, Z. Ning, X. Fukui, L. Lei, W. Wei and S. Yuhan, J. Mol. Catal. A: Chem., 2015, 402, 71–78 CrossRef.
- B. Nohra, L. Candy, J.-F. Blanco, Y. Raoul and Z. Mouloungui, J. Am. Oil Chem. Soc., 2012, 89, 1125–1133 CrossRef CAS.
- M. Uno and M. Okutsu, US pat., 7,888,517B2, 2011 Search PubMed.
- E. J. Vandenberg, J. Polym. Sci., Polym. Chem. Ed., 1985, 23, 915–949 CrossRef CAS.
- S. Palermo, L. Waykole, K.-M. Chen, M. Prashad, K. Prasad, O. Repic and T. J. Blacklock, Synth. Commun., 1997, 27, 1757–1761 CrossRef CAS.
- R. Bai, H. Zhang, F. Mei, S. Wang, T. Li, Y. Gu and G. Li, Green Chem., 2013, 15, 2929–2934 RSC.
- M. Sőzri, B. R. Giri, Z. Wang, A. E. Dawood, B. Viskolcz and A. Farooq, Sustainable Energy Fuels, 2018, 2, 2171–2178 RSC.
- L. N. Gilbert, J. Am. Chem. Soc., 1916, 38, 762–785 CrossRef.
- R. F. W. Bader, T. T. Nguyen-Dang and Y. Tal, Rep. Prog. Phys., 1981, 44, 893 CrossRef.
- R. F. W. Bader, Atoms in Molecules - A Quantum Theory, Oxford University Press, UK, 1990 Search PubMed.
- A. D. Becke and K. E. Edgecombe, J. Chem. Phys., 1990, 92, 5397–5403 CrossRef CAS.
- A. Savin, O. Jepsen, J. Flad, O. K. Andersen, H. Preuss and H. G. von Schnering, Angew. Chem., Int. Ed., 1992, 31, 187–188 CrossRef.
- S. Berski, A. J. Gordon and Z. Latajka, J. Phys. Chem. A, 2014, 118, 4147–4156 CrossRef CAS PubMed.
- S. N. Steinmann, Y. Mo and C. Corminboeuf, Phys. Chem. Chem. Phys., 2011, 13, 20584–20592 RSC.
- M. E. Alikhani, Y. Bouteiller and B. Silvi, J. Phys. Chem., 1996, 100, 16092–16097 CrossRef CAS.
- V. Polo, J. Andres, S. Berski, L. R. Domingo and B. Silvi, J. Phys. Chem. A, 2008, 112, 7128–7136 CrossRef CAS PubMed.
- P. Gonzalez-Navarrete, J. Andrés, S. Berski and S. J. Phys, Chem. Lett., 2012, 3, 2500–2505 CAS.
- N. Gillet, R. Chaudret, J. Contreras-Garcia, W. Yang, B. Silvi and J.-P. Piquemal, J. Chem. Theory Comput., 2012, 8, 3993–3997 CrossRef CAS PubMed.
- J. Andrés, S. Berski and B. Silvi, Chem. Commun., 2016, 52, 8183–8195 RSC.
- J. Andrés, P. Gonzalez-Navarrete, V. S. Safont and B. Silvi, Phys. Chem. Chem. Phys., 2017, 19, 29031–29046 RSC.
- A. I. Adjieufack, I. Mbouombouo Ndassa, I. Patouossa, J. Ketcha Mbadcam, V. S. Safont, M. Oliva and J. Andres, Phys. Chem. Chem. Phys., 2017, 19, 18288–18302 RSC.
- P. Merino, T. Tejero, I. Delso and R. Matute, Org. Biomol. Chem., 2017, 15, 3364–3375 RSC.
- C. Nana Nouhou, A. I. Adjieufack, M. Mbah Bake, C. Fon Abi, I. Mbouombouo Ndassa, M. Rios-Gutierrez and L. R. Domingo, ChemistrySelect, 2019, 4, 13313–13319 CrossRef.
- A. I. Adjieufack, L. K. Djogang, R. B. Lekene Ngouateu, M. Mbah Bake, C. Nana Nouhou, A. Emadak, J. Ketcha Mbadcam and I. Mbouombouo Ndassa, J. Mol. Graphics Modell., 2020, 96, 107513 CrossRef PubMed.
- A. I. Adjieufack, V. Liégeois, I. Ndassa Mboumbouo, J. Ketcha Mbadcam and B. Champagne, J. Phys. Chem. A, 2018, 122, 7472–7481 CrossRef CAS PubMed.
- I. Mbouombouo Ndassa, A. I. Adjieufack, J. Ketcha Mbadcam, B. Slawomir, M. Rios-Gutiérrez and L. R. Domingo, Int. J. Quantum Chem., 2017, 117, 25451 CrossRef.
- E. Zahedi, S. Shaabani and A. Shiroudi, J. Phys. Chem. A, 2017, 121, 8504–8517 CrossRef CAS PubMed.
- E. Chamorro, M. Duque-Norena, S. Kaya, E. Rincon and P. Perez, J. Mol. Model., 2018, 24, 305 CrossRef PubMed.
- A. I. Adjieufack, M. Mbah Bake, J. Ketcha Mbadcam, I. Mbouombouo Ndassa, J. Andrés, M. Oliva and V. S. Safont, Int. J. Quantum Chem., 2019, 119, 25985 CrossRef.
- E. Cherni, A. I. Adjieufack, B. Champagne, M. Abderrabba, S. Ayadi and V. Liégeois, J. Phys. Chem. A, 2020, 124, 4068–4080 CrossRef CAS PubMed.
- R. Gillespie and R. S. Q. Nyholm, Rev. Chem. Soc., 1957, 11, 339–380 RSC.
- R. Gillespie and E. Robinson, Angew. Chem., Int. Ed., 1996, 35, 495–514 CrossRef CAS.
- S. Noury, B. Silvi and R. Gillespie, Inorg. Chem., 2002, 41, 2164–2172 CrossRef CAS PubMed.
- B. Silvi and A. Savin, Nature, 1994, 371, 683–686 CrossRef CAS.
- A. D. Becke, J. Chem. Phys., 1993, 98, 5648–5652 CrossRef CAS.
- J.-D. Chai and M. Head-Gordon, Phys. Chem. Chem. Phys., 2008, 10, 6615–6620 RSC.
- Y. Zhao and D. G. Truhlar, Theor. Chem. Acc., 2008, 120, 215–241 Search PubMed.
- J. B. Foresman and A. Frisch, Exploring Chemistry with Electronic Structure Methods, Gaussian, Inc, 2nd edn, 1996 Search PubMed.
- C. Moller and M. S. Plesset, Phys. Rev., 1934, 46, 618–622 CrossRef CAS.
- Z. Rolik, L. Szegedy, I. Ladjanszki, B. Ladoczki and M. Kallay, J. Chem. Phys., 2013, 139, 94105 CrossRef PubMed.
- K. Fukui, J. Phys. Chem., 1970, 74, 4161–4163 CrossRef CAS.
- C. Gonzalez and H. B. Schlegel, J. Phys. Chem., 1990, 94, 5523–5527 CrossRef CAS.
- C. Gonzalez and H. B. Schlegel, J. Chem. Phys., 1991, 95, 5853–5860 CrossRef CAS.
- S. Noury, X. Krokidis, F. Fuster and B. Silvi, Comput. Chem., 1999, 23, 597–604 CrossRef CAS.
- V. Liégeois, DrawMol, UNamur, https://www.unamur.be/sciences/chimie/drawmol, 2021 Search PubMed.
- V. Liégeois, DrawProfile, UNamur, https://www.unamur.be/sciences/chimie/drawprofile, 2021 Search PubMed.
- M. J. Frisch, G. W. Trucks, H. B. Schlegel, G. E. Scuseria, M. A. Robb, J. R. Cheeseman, G. Scalmani, V. Barone, G. A. Petersson, H. Nakatsuji, X. Li, M. Caricato, A. V. Marenich, J. Bloino, B. G. Janesko, R. Gomperts, B. Mennucci, H. P. Hratchian, J. V. Ortiz, A. F. Izmaylov, J. L. Sonnenberg, D. Williams-Young, F. Ding, F. Lipparini, F. Egidi, J. Goings, B. Peng, A. Petrone, T. Henderson, D. Ranasinghe, V. G. Zakrzewski, J. Gao, N. Rega, G. Zheng, W. Liang, M. Hada, M. Ehara, K. Toyota, R. Fukuda, J. Hasegawa, M. Ishida, T. Nakajima, Y. Honda, O. Kitao, H. Nakai, T. Vreven, K. Throssell, J. A. Montgomery Jr, J. E. Peralta, F. Ogliaro, M. J. Bearpark, J. J. Heyd, E. N. Brothers, K. N. Kudin, V. N. Staroverov, T. A. Keith, R. Kobayashi, J. Normand, K. Raghavachari, A. P. Rendell, J. C. Burant, S. S. Iyengar, J. Tomasi, M. Cossi, J. M. Millam, M. Klene, C. Adamo, R. Cammi, J. W. Ochterski, R. L. Martin, K. Morokuma, O. Farkas, J. B. Foresman and D. J. Fox, Gaussian 16, Revision A.03, Gaussian, Inc., Wallingford CT, 2016 Search PubMed.
Footnote |
| † Electronic supplementary information (ESI) available. See DOI: 10.1039/d0ra09755a |
| This journal is © The Royal Society of Chemistry 2021 |


