DOI:
10.1039/D0RA10877D
(Paper)
RSC Adv., 2021,
11, 14140-14147
Ethylene glycol based acid pretreatment of corn stover for cellulose enzymatic hydrolysis
Received
28th December 2020
, Accepted 8th April 2021
First published on 14th April 2021
Abstract
A highly efficient pretreatment strategy using ethylene glycol with dilute sulfuric acid was developed for the fractionation of lignocellulose. The pretreatment behaviors were related to the composition analysis and structure of the samples analyzed by SEM, XRD, FTIR and 2D HSQC NMR, resulting in 80.3% delignification and 84.7% retention of cellulose under the selected conditions (120 °C, 60 min, and 0.6 wt% H2SO4 (w/w)). The enzymatic hydrolysis sugar yield significantly increased from 24.1 to 70.6% (3 FPU g−1), which displayed immense improvement compared with untreated corn stover (24.1%), nearly 3-fold higher than its untreated counterparts. Besides, the regenerated lignin could be fitted to valorize renewable aromatic chemicals and alkane fuels. The present study shows that the pretreatment is a simple, efficient and promising process for corn stover biorefinery.
1 Introduction
The fossil fuels shortage and emerging environmental consequences have provoked strong motivation to develop programs of biomass conversion.1–4 Lignocellulose, the most abundant form of biomass, is considered as a promising renewable feedstock and mainly consists of three component materials: hemicellulose, cellulose, and lignin.5–7 The cellulose, hemicellulose and lignin in lignocellulose can be used as feedstocks to produce biofuels, biochemicals and biomaterials. However, due to the strongly interlinked lignocellulose structure in the plant cell walls, biomass pretreatment is an essential step to break down complex structure and remove lignin for improving the ability of enzymatic hydrolysis.8–13
The main goal of pretreatment is to weaken the resistance of the lignin-hemicellulose matrix and producing digestible cellulose residual. Up to now, different pretreatment techniques including chemical, biological and physical methods have been started prior to enzymatic hydrolysis.14–17 Many pretreatment strategies based on organic solvent,18 surfactant,19 hydrothermal,20 acid,21 alkaline,22 ionic liquids23 or biological method24 have been used to pretreat lignocellulose to improve its enzymatic hydrolysis. These pretreatment strategies often liberate substantial amounts of lignin from biomass. Ether and ester bonds may be cleaved and, through reasonably well-understood mechanisms, condensation reactions occur to an extent dependent on the fractionation conditions (pH, residence time, solvent). Among various pretreatment techniques, the acidic pretreatment method is usually selected, which can break the biomass natural barriers easily. However, because of the differences of biomass in structural features, it is hard to achieve efficient fractionation of three main components and maximum retention of cellulose by single acid pretreatment. Hence, isolation of lignocellulosic biomass to carbohydrate fraction and lignin has been developed via a two-step strategy pretreatment. An et al. studied HCl followed by alkaline wet oxidation pretreatments enhance sugar recovery facilitated 86.1% lignin removal and 71.5% of glucan yield with a low enzyme dosage (3 FPU g−1).25 Liu et al. found that dilute hydrochloric acid followed by Fenton oxidation could improve enzymatic hydrolysis yield, resulting in 81.0% xylose removal and 71.3% of glucose yield with a very low cellulase dosage (3 FPU g−1).26 However, many defects such as long craft route, high energy input, wastewater and chemicals consumption, were inevitable in two-stage pretreatment.
In the raw lignocellulosic biomass, cellulose will be encapsulated by lignin and hemicellulose, protecting cellulose from chemical and biological attack to a certain extent. The separation of lignin will release the carbohydrates fraction, which is good for the chemical and biological degradation of carbohydrates. Therefore, the removal of lignin plays a crucial role in facilitating the enzymatic hydrolysis of cellulose and the structure of lignin directly affects its conversion into high value-added product.27–29 Estimating the structural changes of lignin during the pretreatment process will present some useful understandings. A conventional delignification process appears under harsh processing conditions using sulfite, sodium sulfide or sodium hydroxide at an approximate temperature of 170 °C for more than 2 hours, producing irreversible degradation of lignin, which is not accorded with the current concept of economical and valuable biorefineries. It is essential that a simple one-step pretreatment method need to be exploited to realize a low chemical consumption and short craft route, simultaneously obtaining efficient lignin removal and enzymatic digestibility of cellulose.
As a biomass derived organic alcohol, ethylene glycol is cheap and abundant, which can be used in the pretreatment process.30,31 Mixture of ethylene glycol and H2O have an efficient dissolution of enfolding lignin, which allows it plays an issue point in separation of lignin.32 When the ethylene glycol solution is diluted with water below the minimum hydrotrope concentration, the precipitated lignin can be obtained from the enriched-lignin solvent. However, the lignin removal is poor using pure ethylene glycol solution for pretreatment.33 In this study, a system of ethylene glycol coupled with dilute sulfuric acid (the catalyst) was performed on corn stover. The dilute sulfuric acid could cleave the lignin-carbohydrate complexes (LCCs) bonds, achieving the separation of lignin, hemicellulose and cellulose. The lignin could be dissolved in ethylene glycol to avoid its deposition on the surface of lignocellulose and the cellulose in the solid residual was used for enzymatic hydrolysis to produce monosaccharides. Composition analysis, scanning electron microscope (SEM), X-ray diffraction (XRD) and Fourier transformed infrared spectra (FTIR) were utilized to characterize the structure and composition variations of lignocellulose. Nuclear magnetic resonance (NMR) was applied to characterize the changes of lignin structure after pretreatment.
2 Materials and method
2.1 Materials
The corn stover was produced from the northern of Anhui Province, and they were crushed into fragment. Firstly, the corn stover was washed to remove the external mud. Then, after drying the clean corn stover in an oven at 80 °C for 72 hours, the corn stover was ground with a cutter and passed through a 40-mesh screen. The cellulase 1.5 L (cellulose complex, produced by Trichoderma reesei) and Novozyme 188 (b-glucosidase, produced by Aspergillus niger) were donated by Novozymes (China) Investment Co., Ltd. The enzyme activities was 67.8 filter paper units (FPU) mL−1 (expressed as micromoles of glucose produced per minute, with filter paper as a substrate) and 210.5 cellobiose units (CBU) mL−1 (expressed as micromoles of cellobiose that is converted to glucose per minute, with cellobiose as a substrate) for Celluclast 1.5 L and Novozyme 188, respectively.34 All chemicals were purchased from Sinopharm Chemical Reagent Co., Ltd. (Shanghai, China), and were used directly without the further purification step.
2.2 Ethylene glycol based pretreatment
Corn stover (4 g) was mixed with ethylene glycol coupled with dilute sulfuric acid (40 mL) and the mixture was carried out in a 70 mL reactor equipped with a mechanical agitation. The processing conditions for pretreatment were 120 °C, 60 min and 0.6 wt% H2SO4 (w/w). The temperature was upraised from 20 to 120 °C with a 5 °C min−1 heating rate and held for 60 min. After the pretreatment reaction, the reactor was cooled to 20 °C with water. The solid fractions were separated from the reaction mixture by filtration. Then, the solid faction was washed twice with 200 mL ethylene glycol solution (50/50 (v/v) EG/water) to remove the residual acid and lignin. Finally, the solid fraction and liquid phase were preserved at 4 °C for next enzymatic hydrolysis and isolation of lignin, respectively.
2.3 Enzymatic hydrolysis of cellulose
The enzymatic hydrolysis of substrates (0.2 g dry substrate) was executed in 5 mL centrifuge tube in a rotating incubator with 5% (w/v) mass concentration according to our previous report.25 The 0.05 M sodium acetate buffer (pH 4.8) and sodium azide (0.03 g mL−1) were added into the tube, which could restrain the microbial infection. In the mixture, cellulase (3 FPU per gram substrate) and beta-glucosidase (20 CBU per gram substrate) were appended into the tube. The enzymatic hydrolysis was carried out in a shaking incubator at 50 °C and 120 rpm for 72 hours. After the enzymatic hydrolysis process, the mixture was centrifuged at 10![[thin space (1/6-em)]](https://www.rsc.org/images/entities/char_2009.gif) 000 rpm for 5 min to separate the enriched-sugar liquid from slurry. Finally, sugars concentrations were determined by HPLC. As comparison, the untreated sample was also performed. Each reaction was carried out in duplicate.
000 rpm for 5 min to separate the enriched-sugar liquid from slurry. Finally, sugars concentrations were determined by HPLC. As comparison, the untreated sample was also performed. Each reaction was carried out in duplicate.
2.4 Analytical methods
2.4.1 Composition analysis of corn stover. The chemical compositions of untreated and pretreated samples were measured according to the National Renewable Energy Laboratory procedure “Determination of structural carbohydrates and lignin in biomass”.35 The ash content of raw corn stover was measured by gravimetric analysis of lignocellulose calcined in air at 575 °C for 6 h. The original lignocellulosic extractives were determined by the thorough (24 hours) Soxhlet extraction method, and then by solvent evaporation and residual gravimetric analysis. The wt% moisture of the biomass samples equilibrated at ambient conditions was determined by drying at 105 °C for 6 h.
2.4.2 Sugar determination. The glucose, xylose and other monosaccharides concentration was recorded on Waters 2414 HPLC with a HPX-87H column (Bio-Rad, USA) and differential refractive index detector (Waters 2414, USA). The temperature of the column and detector were 63 °C and 50 °C, respectively, and 5 mM H2SO4 was used as mobile phase of the system. The yields were calculated by eqn (1)–(5):| | |
Solid recovery (%) = 100% × (grams of recovered solid residual)/(grams of raw corn stover),
| (1) |
| | |
Lignin removal rate (%) = [1 − (grams of lignin in solid residual/grams of lignin in raw corn stover)] × 100%,
| (2) |
| | |
Xylan retention rate (%) = (grams of xylan in solid residual/grams of xylan in raw corn stover) × 100%,
| (3) |
| | |
Glucan retention rate (%) = (grams of glucan in solid residual/grams of glucan in raw corn stover) × 100%,
| (4) |
| | |
Glucan yield (%) = [(grams of glucose in hydrolysate) × 0.9]/(grams of glucan in raw corn stover) × 100%,
| (5) |
2.4.3 SEM analysis of samples. The surface texture morphology of pretreated and untreated samples was measured by Genimi SEM 500 at a magnification of 2000 times and an accelerating voltage of 10 kV. All analysed samples were prepared using freeze-dried method to maintain structure of original samples. Before imaged, the samples were sputer-coated with a thin layer of gold.
2.4.4 Crystallinity measurement. The crystal structure of the raw corn stover and treated (0.6 wt% H2SO4, 120 °C, 60 min) was detected by a Rigaku TTR-III diffractometer (Rigaku Denki Co., Ltd) and the working voltage and current were 40 kV and 15 mA, respectively. The scattering angle was ranged from 5° to 55° and the CrI of samples was calculated according to the formula of CrI = (I002 − Iam)/I002.
2.4.5 Functional groups characterization of samples. The FT-IR spectrums of corn stover were measured using the Nicolet iS50 FT-IR Spectrometer (Nicolet, USA), which was applied to reveal the changes of the functional groups. Samples were prepared by grinding and pressing into thin sheets with KBr at a ratio of 1:100 (w/w). The spectra pattern were ranged from 500–4000 cm−1 with a resolution of 4 cm−1, and each sample was scanned 32 times.
2.4.6 Nuclear magnetic resonance (NMR) analysis. The concentrated liquid was mixed with 10 volumes of deionized water to precipitate the dissolved lignin. Next, the mixture was centrifuged at 10000 rpm for 10 min by the centrifuge. The solid was isolated by vacuum filtration, and washed by deionized water until reaching a neutral pH. Finally, the obtained solid was lignin (Lignin_120), which was freeze-dried and analyzed by 2D heteronuclear single-quantum coherence (HSQC) NMR. The Lignin_120 was obtained at reaction conditions of 120 °C, 60 min, 0.6 wt% H2SO4 (w/w). DMSO-d6 (0.5 mL) was added into a technical Shigemi NMR tubes followed by dissolving of 90 mg lignin. The 2D HSQC NMR spectra were accomplished with a Bruker AVANCE 500 MHz spectrometer furnished with a 5 mm double resonance broadband BBI inverse probe using a coupling constant J1 CeH of 147 Hz. The HSQC experiment was carried out on a Bruker phase sensitive gradient-edited HSQC pulse sequence ‘hsqcetgpsisp2’. The spectra were processed by MestReNova software.36
3 Results & discussion
3.1 Influences of ethylene glycol with H2SO4 pretreatment of corn stover
There were mainly three compositions in raw corn stover materials: 31.3% glucan, 22.5% xylan, and 18.9% acid-insoluble lignin. Besides, there also existed a few components in raw corn stover as follows: 2.8% acid-soluble lignin, 2.1% arabinan, 9.6% extractive, 4.1% ash, and 8.7% other components. Pretreatment could change compositions of lignocellulose, which would directly affect its enzymatic hydrolysis. It was beneficial to analyse the composition of lignocellulose for exploring the enhancement mechanism of pretreatment on enzymatic hydrolysis. Therefore, different combinations of temperature, time and dilute acid concentrations were performed according to single-factor experiments (Fig. 1–3; and Table 1).
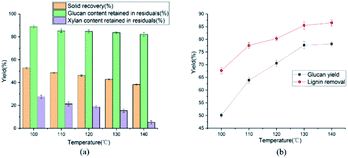 |
| | Fig. 1 Pretreatment condition: 4 g corn stover in 40 mL (80 vol% ethylene glycol) solution at 0.6 wt% H2SO4 (w/w) for 60 min. (a) Effect of pretreatment temperature on solid recovery, glucan and xylan content retained in residual. (b) Effect of pretreatment temperature on enzymatic hydrolysis of cellulose and the removal of lignin. | |
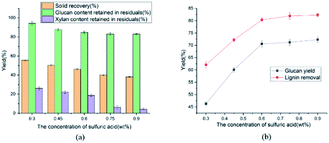 |
| | Fig. 2 Pretreatment condition: 4 g corn stover in 40 mL (80 vol% ethylene glycol) solution at 120 °C for 60 min. (a) Effect of pretreatment concentration of sulfuric acid on solid recovery, glucan and xylan content retained in residual. (b) Effect of pretreatment concentration of sulfuric acid on enzymatic hydrolysis of cellulose and the removal of lignin. | |
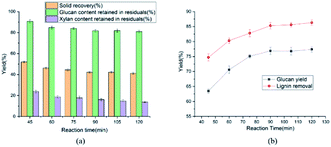 |
| | Fig. 3 Pretreatment condition: 4 g corn stover in 40 mL (80 vol% ethylene glycol) solution at 120 °C and 0.6 wt% H2SO4 (w/w). (a) Effect of pretreatment reaction time on solid recovery, glucan and xylan content retained in residual. (b) Effect of pretreatment reaction time on enzymatic hydrolysis of cellulose and the removal of lignin. | |
Table 1 Component changes of pretreated corn stover with ethylene glycola
| Sample |
EG:water (v/v) |
SRb (%) |
Solid compositions (%) |
Recovery of compositions (%) |
Sugars yields |
| Glucan |
Xylan |
Lignin |
Glucan |
Xylan |
Lignin |
Glucan |
| Pretreatment condition: 4 g corn stover in 40 mL (80 vol% ethylene glycol) solution for 60 min. Solid recovery. Raw corn stover. Treated only with ethylene glycol at 120 °C for 60 min. Treated only with 0.6 wt% H2SO4 (w/w) at 120 °C for 60 min. EG-100, EG-110 etc. represented that the samples were treated with 0.6 wt% H2SO4 (w/w) for 60 min, but the temperature was 100 °C, 110 °C, 120 °C, 130 °C, and 140 °C. |
| RCSc |
— |
— |
31.3 |
22.5 |
21.7 |
— |
— |
— |
— |
| EGd |
100:0 |
88.6 |
33.4 |
23.5 |
17.7 |
94.6 |
92.5 |
72.3 |
30.1 |
| H2SO4e |
0:100 |
64.5 |
45.0 |
7.1 |
24.8 |
92.8 |
20.3 |
73.6 |
38.2 |
| EG-100 |
80:20 |
52.8 |
52.7 |
11.7 |
13.2 |
88.9 |
27.5 |
32.2 |
50.1 |
| EG-110 |
80:20 |
48.7 |
54.8 |
9.9 |
10.0 |
85.3 |
21.3 |
22.4 |
63.9 |
| EG-120 |
80:20 |
46.2 |
57.4 |
9.1 |
9.2 |
84.7 |
18.7 |
19.7 |
70.6 |
| EG-130 |
80:20 |
42.9 |
61.1 |
8.1 |
7.8 |
83.7 |
15.4 |
14.5 |
77.7 |
| EG-140 |
80:20 |
38.3 |
67.2 |
3.0 |
7.6 |
82.2 |
5.2 |
13.5 |
78.2 |
The effects of pretreatment temperature (100 to 140 °C) on glucan and xylan content retained in residual were illustrated in Fig. 1(a). The solid recovery decreased from 52.8 to 38.3% when the treatment temperature increased from 100 to 140 °C, because of the removal of lignin and hemicellulose. Simultaneously, the recovery of cellulose was ranged from 88.9 to 82.2%, maintaining a high cellulose recovery. Besides, the cellulose content in solid residual had a little changes as the temperature increased from 130 to 140 °C. These phenomena could be attributed to the compact structure of the cellulose, and LCCs were more likely to break down.37 Therefore, in present work, ethylene glycol with H2SO4 pretreatment was performed at 120 °C.
The Fig. 2(a) presented the effects of dilute sulfuric acid concentration on glucan and xylan content retained in residual. As the increasing of dilute sulfuric acid concentration (0.3 to 0.6 wt%), the solid residual recovery steadily decreased from 55.4 to 46.2%. Meanwhile the contents of cellulose and hemicellulose retained in pretreated solid residual reduced from 94.3 to 84.7% and 26.1 to 18.7%, respectively. When the concentration of H2SO4 exceeded 0.75 wt%, most of the hemicellulose was removed, indicating that severe reaction conditions would facilitate the cleaving of LCCs bonds. It was explained that the carbohydrates, especially hemicellulose, could be degraded effectively under the acidic conditions. Xylan was most abundant in hemicellulose and easily degraded to monosaccharide under acidic environment.38 Obviously, the chemical structures of lignocellulosic biomass might be changed due to the lignin and hemicellulose removal after pretreatment. Besides, as H2SO4 concentration increased from 0.6 to 0.9 wt%, the cellulose content retained in solid residuals decreased from 84.7 to 82.9%, which exhibited negligible changes. Overall, for high recovery of cellulose, 0.6 wt% was selected as the H2SO4 concentration.
The influences of reaction time on glucan and xylan content retained in residual were showed in the Fig. 3(a). As the reaction time ranged from 45 to 60 min, the solid recovery and the cellulose content retained in solid residual gradually minified from 52.0 to 46.2% and 90.7 to 84.7%, respectively. Meanwhile, hemicellulose content retained in pretreated solid residual diminished from 23.8 to 18.7% and the lignin removal raised from 74.7 to 80.3%. As we had seen, more than 80% glucan was still remained in the pretreated substrates, no matter which the pretreatment conditions were used in this study. Considering the efficiency and energy consumption of pretreatment, 1 h was chosen as the appropriate pretreatment time. In order to elevate the hydrolysis of cellulose as well as the substantial removal of hemicellulose and lignin from corn stover, the conditions were selected as 0.6 wt% H2SO4 (w/w) at 120 °C for 1 h. Under the selected conditions, the results were 80.3% delignification and 84.7% retention of cellulose. The mechanism of ethylene glycol with H2SO4 pretreatment was analyzed below. Firstly, the dilute sulfuric acid could cleave the lignin-carbohydrate complexes (LCCs) bonds, achieving the separation of lignin, hemicellulose and cellulose. Furthermore, the lignin could be dissolved in ethylene glycol to avoid its deposition on the surface of lignocellulose and the cellulose in the solid residual was used for enzymatic hydrolysis to produce monosaccharides.
3.2 Enzymatic hydrolysis
The effect of temperature on enzymatic hydrolysis was investigated in Fig. 1(b). When the temperature elevated from 100 to 140 °C, the glucan yield clearly upped from 50.1 to 78.2% with 3 FPU g−1 enzyme dosage of substrate. Meanwhile, the removal of lignin was augmented from 67.7 to 86.5%. The removal of lignin increased the adsorption of cellulase, thereby enhancing the efficiency of enzymatic hydrolysis. The effect of sulfuric acid concentration on enzymatic hydrolysis of cellulose was also evaluated in this study and the results were shown in Fig. 2(b) and 3(b). From Fig. 2(b), as the sulfuric acid concentration increased from 0.3 to 0.9 wt%, the removal of lignin increased from 62.1 to 82.3%. Meanwhile, the glucan yield was extended from 46.3 to 72.3% at the enzyme dosage of 3 FPU g−1 substrate. Compared with the raw corn stover (24.1% of glucan yield), the glucan yield was greatly boosted (3 times). It could be explained that the removal of lignin could decrease the adsorption of non-productive cellulase and destruct the dense matrix structure of substrate. When the H2SO4 increased from 0.6 to 0.9 wt%, glucan yield changed little (70.6 to 72.3%). It indicated that there might be other important structural and morphological factors affecting the enzymatic hydrolysis efficiency with lignin and hemicellulose removal to a certain extent.39,40 From the Fig. 1(a)–3(a), the content of cellulose maintained above 80%. The results suggested that cellulose was impenetrable to degrade because of its semi crystalline structure. The effect of reaction time on enzymatic hydrolysis of cellulose was explored, and the results were shown in Fig. 3(b). As can be seen from the figure, when the reaction time was prolonged from 45 to 120 minutes, the lignin removal was expanded from 74.7 to 86.3%. In the meantime, the glucan yield increased from 63.5 to 77.4% with 3 FPU g−1 substrate of enzymatic dosage.
The Fig. 4 represented the effect of ethylene glycol concentration on the pretreatment performance. It was interesting to note that adding ethylene glycol to the mixture solvent significantly enhanced the lignin removal. As the ethylene glycol content increased, lignin removal reached to 80.3% at the ethylene glycol/water mixture ratio of 80/20 (v/v). However, the lignin removal by sole ethylene glycol sharply decreased to 27.7% (Table 1). This is mainly because H+ released from mineral acids could catalyze the hydrolysis of carbohydrates and the cleavage of α- and β-aryl ether bonds in lignin. When the ethylene glycol/water increased from 50 to 90% (v/v), glucan yield was reached a plateau (70.6%). The excellent lignin removal capability of ethylene glycol/water mixture solvent could due to its strong ability to dissolve lignin. Hildebrand δH theory has been found to be effective for the development of suitable organic solvent pretreatment media.41 It is generally believed that if the δH of organic solvent pretreatment of medium value is close to lignin, the lignin removal will be favorable.42 The δH of mixture solvent can be calculated by: δmix = vsolventδsolvent + vwaterδwater, where δmix, δsolvent and δwater are the δH values of the mixture solvent, pure organic solvent and water, respectively; vsolvent and vwater are the volume ratio (v/v) of organic solvent and water in the mixture, respectively. The δH value of ethylene glycol was 32.9 (J cm−3)−1/2 and the δH value of water was 47.8 (J cm−3)−1/2.43 According to δmix formula, the δmix values of 50% EG, 60% EG, 70% EG, 80% EG and 90% EG, were calculated to be 40.4, 38.86, 37.7, 35.9 and 34.4 (J cm−3)−1/2, respectively. As the concentration of EG increased, the value of δmix gradually decreased, approaching to δH of the organosolv lignin (30 (J cm−3)−1/2). Hence, 80% EG and 90% EG were more beneficial to lignin removal. With the effective removal of lignin, the corresponding hemicellulose removal has also been enhanced. So, high glucan yield (70.6%) was obtained at 80/20 ethylene glycol to water without serious cellulose degradation (84.7% cellulose retention).
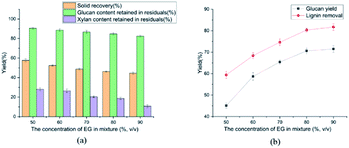 |
| | Fig. 4 Pretreatment condition: 4 g corn stover in 40 mL (80 vol% ethylene glycol) solution at 120 °C for 60 min. (a) Effect of the concentration of EG on solid recovery, glucan and xylan content retained in residual. (b) Effect of the concentration of EG on enzymatic hydrolysis of cellulose and the removal of lignin. | |
Effect of the solid to acid ratio on the pretreatment performance was shown in Fig. 5. The ratio of solid to acid was 1:1, 1:2 and 1:3 (w/v), corresponding solid to mixture solvent ratio of 1:5, 1:10 and 1:15 (w/v). As the solid to acid ratio decreased from 1:1 to 1:2, the lignin removal reached to 80.3% at the ratio of 1:2. The glucan yield of enzymatic hydrolysis was 70.6% at the solid to acid ratio of 1.2. It can be explained that the dilute sulfuric acid could destroy the lignin-carbohydrate complexes (LCCs) structure. Finally, a solid to acid ratio of 1:2 was selected as the minimum ratio to uniformly perform the reaction because low ratios decreased the uniformity of the reaction, and high ratios increased the pretreatment cost.
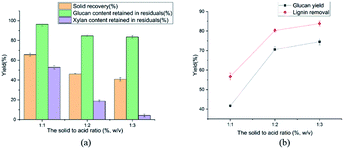 |
| | Fig. 5 Pretreatment condition: 4 g corn stover in 40 mL (80 vol% ethylene glycol) solution at 120 °C for 60 min. (a) Effect of the solid to acid ratio on solid recovery, glucan and xylan content retained in residual. (b) Effect of the solid to acid ratio on enzymatic hydrolysis of cellulose and the removal of lignin. | |
In this study, after ethylene glycol with H2SO4 pretreatment (0.6 wt% H2SO4 (w/w), 120 °C and 1 h) of corn stover, glucan yield (3 FPU g−1 dry substrate for 72 h) reached 70.6% at 5% solid concentrations. Pretreatment of corn stover using ethylene glycol based could achieve efficient enzymatic hydrolysis of cellulose under low cellulase loading, which might be due to higher delignification. The ethylene glycol with H2SO4 pretreatment was compared with other pretreatment as follows. Recent studies on acid catalyzed hydrothermal pretreatment aimed to improve the cellulose recovery and hemicellulose removal, but the effect on lignin removal was insignificant. Mouthier et al. pretreated corn stover with 2% H2SO4 (w/w) – water for enzymatic hydrolysis of cellulose at 160 °C for 1 h, resulting in only 37% delignification.44 Lee et al. investigated the corn stover was pretreated with 0.5% H2SO4 (w/w) – water at 160 °C for 10 min, but the removal of lignin was 20%. In this study, ethylene glycol with H2SO4 pretreatment showed efficient delignification of corn stover.37 Under the selected conditions of 0.6 wt% H2SO4 (w/w) and 120 °C for 1 h, the cellulose was highly recovered (84.7%) and the removal of lignin was 80.3%. Therefore, ethylene glycol with H2SO4 pretreatment could selectively remove lignin, hemicellulose and destroy the structure of lignocellulose for enzymatic hydrolysis.
3.3 Physical and chemical structure characterization
3.3.1 Surface morphology and structure. The surface morphology of treated corn stover was observed by SEM and compared with raw corn stover (Fig. 6). From the SEM image (Fig. 6(a)), we could see that the raw corn stover displayed compact and highly ordered morphology. This dense structure would hinder the accessibility of cellulase to carbohydrates, so its glucan yield was extremely low (24.1%). In Fig. 6(b), the surface of substrate was broken into fiber bundles and small particle sized cracks and the whole structure of sample remained intact and no obvious looseness. This phenomenon could be ascribed to selectively removal of lignin and hemicellulose. The integrality of the whole structure and the formation of small cracks and pores greatly improved the exposure of carbohydrate, so the enzymatic hydrolysis had been greatly enhanced. The differences in morphological were strongly supported by composition analysis.
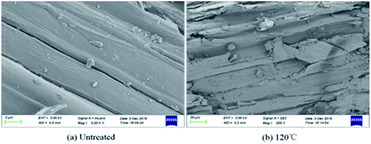 |
| | Fig. 6 The surface of corn stover (a) untreated, (b) 120 °C. Pretreatment conditions: 60 min; 0.6 wt% H2SO4 (w/w). | |
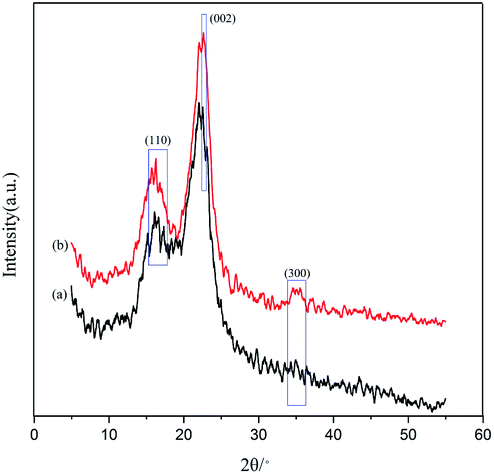
3.3.2 Crystal structure and crystallinity. Pretreatment could change the crystal structure and crystallinity of cellulose, which affected the enzymatic hydrolysis efficiency of cellulose. Therefore, the crystallinity and structure of corn stover before and after pretreatment were analyzed by XRD. As shown in Fig. 7, the corn stover exhibited a typical cellulose structure. The characteristic structure of cellulose I was at 2θ of 15.8°, 22.5° and 34.9° in XRD. Compared with raw corn stover, the peak of (002) crystal plane became more narrow and clear, and the intensity of (002) and (110) was significantly strengthen, suggesting the crystalline proportion of cellulose was increased. However, the located position of the two peaks did not change, and no additional peaks appeared, indicating that the treatment did not altered the original crystal structure of cellulose. The relative crystallinity indexes of different substrates were calculated based on the formula, CrI = (I002 − Iam)/I002. The raw corn stover CrI was 42.7%, which increased to 58.6% after pretreatment. It was attributed to the removal of lignin and hemicellulose. In short, it greatly increased the exposure of cellulose and the accessibility of enzymes, which was beneficial to the efficiency of enzymatic hydrolysis.
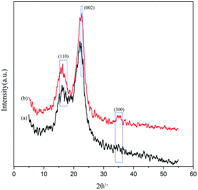 |
| | Fig. 7 XRD diagrams of (a) original corn stover; (b) treated; pretreatment conditions: 120 °C; 60 min; 0.6 wt% H2SO4 (w/w). | |
3.3.3 FT-IR analysis. The FTIR spectra (Fig. 8.) further confirmed the results of composition analysis, XRD and SEM results. The board absorption band at 3420 cm−1 was related to the hydroxyls stretching vibration. The appearance of peaks at 2897 and 2830 cm−1 was corresponded to the C–H stretching vibration of methoxy groups (OCH3) and the methylene groups (CH2) vibrations, respectively.45 The absorption bands at 1512 and 1243 cm−1 were attributed to the skeletal vibrations of the benzene ring and β-ether bond of the lignin. Compared with the raw corn stover, the bands of benzene ring and β-ether bond became weaken as the temperature ranging from 100 to 140 °C. The phenomena were ascribed to the removal of lignin, which was in accordance with composition analysis. The peak at 895 cm−1 was considered to the presence of β-glycosidic linkages between glucan units in cellulose, which indicated to the cellulose remained after pretreatment. In conclusion, FTIR spectroscopy analysis showed that the lignin was removed and the cellulose was retained after pretreatment.
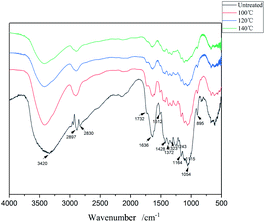 |
| | Fig. 8 The FTIR spectroscopy of original corn stover and ethylene glycol with H2SO4 pretreated solid residual at different temperatures. | |
3.3.4 NMR analysis. 2D HSQC NMR was performed on lignin to investigate the structural changes of Lignin_120 and milled wood lignin (MWL). The side-chain region of the 2D HSQC NMR spectra provided important information about the linkages between different units of the lignin in Fig. 9. The main linkages such as β-O-4 (substructure A), β–β (substructure B), and β-5 (substructure C) could be easily distinguished in Fig. 9,46–48 which were identified by the cross peaks at δC/δH 72.35/4.85 (Aα), 86.67/4.50 (Bα), and 88.03/5.46 (Cα), respectively. It was showed that the β-O-4 and other carbon–carbon linkages (such as β–β and β-5) had been cleaved. In addition, the breaking ratio of β-O-4 linkages was the highest among all lignin bonds (from 41.6 to 10%), which was consistent with the theoretically calculated bond energies of different lignin linkages.49 In the aromatic region, the G units show different correlations for C2–H2 (δC/δH 111.9/7.0), C5–H5 (δC/δH 116.4/6.8), and C6–H6 (δC/δH 120.7/6.8). As shown in Fig. 7, the chemical shift of the G unit changed slightly after pretreatment. This might be the increased electron cloud density of the G aromatic ring unit and the formation of new carbon–carbon bonds in the acid-catalyzed condensation reaction. To sum up, the removal of lignin could break down the tight structure of corn stover, promote the accessibility of enzyme to cellulose. Meanwhile, the regenerated lignin could be adapted to produce high-value-added product.
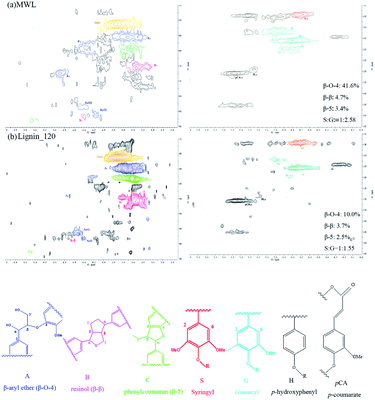 |
| | Fig. 9 The 2D HSQC NMR of (a) milled wood lignin (MWL) and (b) Lignin_120. | |
4 Conclusions
A pretreatment strategy using ethylene glycol based with dilute sulfuric acid was comprehensively investigated in this study. The pretreatment behaviors were related to the composition and structure of sample analyzed by SEM, XRD, FT-IR and 2D HSQC NMR. High lignin removal (80.3%) was obtained at 120 °C, 60 min, and 0.6 wt% H2SO4 (w/w) without severe cellulose degradation (84.7% cellulose retention). The glucan yield significantly increased to 70.6% (3FPU g−1) at the selected condition (120 °C, 60 min, and 0.6 wt% H2SO4 (w/w)), compared with untreated corn stover (24.1%).
Conflicts of interest
The authors declare that there are no conflicts interest.
Acknowledgements
This work was supported by the National Key Technology R&D Program of China (No. 2018YFB1501601), the National Natural Science Foundation of China (51976212) and Key Research and Development Projects in Anhui Province No. 202004a06020053.
References
- D. E. Leiva-Candia, S. Pinzi, M. D. Redel-Macías, A. Koutinas, C. Webb and M. P. Dorado, Fuel, 2014, 123, 33–42 CrossRef CAS.
- L. R. Lynd, J. H. Cushman, R. J. Nichols and C. E. Wyman, Science, 1991, 251, 1318–1323 CrossRef CAS PubMed.
- E. D. Dutra, F. A. Santos, B. R. A. Alencar, A. L. S. Reis, R. D. R. de Souza, K. A. D. Aquino, M. A. Morais and R. S. C. Menezes, Biomass Convers. Biorefin., 2018, 8, 225–234 CrossRef CAS.
- Y. Z. Dai, M. Y. Si, Y. H. Chen, N. L. Zhang, M. Zhou, Q. Liao, D. Q. Shi and Y. N. Liu, Bioresour. Technol., 2015, 198, 725–731 CrossRef CAS PubMed.
- P. Bansal, B. J. Vowell, M. Hall, M. J. Realff, J. H. Lee and A. S. Bommarius, Bioresour. Technol., 2012, 107, 243–250 CrossRef CAS PubMed.
- V. J. H. Sewalt, W. G. Glasser and K. A. Beauchemin, J. Agric. Food Chem., 1997, 45, 1823–1828 CrossRef CAS.
- R. Kumar and C. E. Wyman, Biotechnol. Bioeng., 2014, 111, 1341–1353 CrossRef CAS PubMed.
- Z. Ji, X. Zhang, Z. Ling, X. Zhou, S. Ramaswamy and F. Xu, Biotechnol. Biofuels, 2015, 8, 1–14 CrossRef CAS PubMed.
- T. Auxenfans, D. Cronier, B. Chabbert and G. Paes, Biotechnol. Biofuels, 2017, 10, 1–16 CrossRef PubMed.
- L. H. Chen, R. Chen and S. Y. Fu, ACS Sustainable Chem. Eng., 2015, 3, 1794–1800 CrossRef CAS.
- H. Y. Chen, J. B. Liu, X. Chang, D. M. Chen, Y. Xue, P. Liu, H. L. Lin and S. Han, Fuel Process. Technol., 2017, 160, 196–206 CrossRef CAS.
- Y. Zhang, Z. G. Yuan, B. Hu, J. Deng, Q. Yao, X. Zhang, X. H. Liu, Y. Fu and Q. Lu, Green Chem., 2019, 21, 812–820 RSC.
- H. Wang, C. Zhu, Q. Liu, J. Tan, C. Wang, Z. Liang and L. Ma, ChemSusChem, 2019, 12, 2154–2160 CrossRef CAS PubMed.
- S. N. Sun, S. L. Sun, X. F. Cao and R. C. Sun, Bioresour. Technol., 2016, 199, 49–58 CrossRef CAS PubMed.
- H. D. Zhang and S. B. Wu, J. Agric. Food Chem., 2014, 62, 11681–11687 CrossRef CAS PubMed.
- P. Alvira, E. Tomas-Pejo, M. Ballesteros and M. J. Negro, Bioresour. Technol., 2010, 101, 4851–4861 CrossRef CAS PubMed.
- S. X. An, W. Z. Li, Q. Y. Liu, M. H. Li, Q. Z. Ma, L. L. Ma and H. M. Chang, RSC Adv., 2017, 7, 32452–32460 RSC.
- C. Y. Dong, X. Z. Meng, C. S. Yeung, H. Y. Tse, A. J. Ragauskas and S. Y. Leu, Green Chem., 2019, 21, 2788–2800 RSC.
- W. Q. Lin, D. F. Chen, Q. Yong, C. X. Huang and S. L. Huang, Bioresour. Technol., 2019, 293, 1–8 CrossRef PubMed.
- S. B. Ge, Y. J. Wu, W. X. Peng, C. L. Xia, C. T. Mei, L. P. Cai, S. Q. Shi, C. Sonne, S. S. Lam and Y. F. Tsang, Chem. Eng. J., 2020, 385, 1–9 CrossRef.
- M. Wu, Z. Y. Yan, X. M. Zhang, F. Xu and R. C. Sun, Bioresour. Technol., 2016, 200, 23–28 CrossRef CAS PubMed.
- P. Phitsuwan, K. Sakka and K. Ratanakhanokchai, Bioresour. Technol., 2016, 218, 247–256 CrossRef CAS PubMed.
- T. T. You, L. M. Zhang and F. Xu, Bioresour. Technol., 2016, 199, 271–274 CrossRef CAS PubMed.
- M. Ratto, A. C. Ritschkoff and L. Viikari, Appl. Microbiol. Biotechnol., 1997, 48, 53–57 CrossRef CAS.
- S. X. An, W. Z. Li, Q. Y. Liu, Y. Xia, T. W. Zhang, F. Huang, Q. Z. Lin and L. Chen, Bioresour. Technol., 2019, 271, 283–288 CrossRef CAS PubMed.
- W. Li, Q. Liu, Q. Ma, T. Zhang, L. Ma, H. Jameel and H. M. Chang, Bioresour. Technol., 2016, 219, 753–756 CrossRef CAS PubMed.
- A. J. Ragauskas, G. T. Beckham, M. J. Biddy, R. Chandra, F. Chen, M. F. Davis, B. H. Davison, R. A. Dixon, P. Gilna, M. Keller, P. Langan, A. K. Naskar, J. N. Saddler, T. J. Tschaplinski, G. A. Tuskan and C. E. Wyman, Science, 2014, 344, 709–719 CrossRef CAS PubMed.
- J. C. Martinez-Patino, E. Ruiz, I. Romero, C. Cara, J. C. Lopez-Linares and E. Castro, Bioresour. Technol., 2017, 239, 326–335 CrossRef CAS PubMed.
- Q. Yu, X. Zhuang, Z. Yuan, Q. Wang, W. Qi, W. Wang, Y. Zhang, J. Xu and H. Xu, Bioresour. Technol., 2010, 101, 4895–4899 CrossRef CAS PubMed.
- M. A. Alio, O. C. Tugui, C. Vial and A. Pons, Bioresour. Technol., 2019, 276, 170–176 CrossRef PubMed.
- L. Jimenez, A. Perez, M. J. De la Torre, A. B. Rodriguez and V. Angulo, Bioresour. Technol., 2008, 99, 2170–2176 CrossRef CAS PubMed.
- D. H. Lee, E. Y. Cho, C. J. Kim and S. B. Kim, Biotechnol. Bioprocess Eng., 2010, 15, 1094–1101 CrossRef CAS.
- K. Zhang, Z. J. Pei and D. H. Wang, Bioresour. Technol., 2016, 199, 21–33 CrossRef CAS PubMed.
- T. K. Ghose, Pure Appl. Chem., 1987, 59, 257–268 CAS.
- A. Sluiter, B. Hames, D. Hyman, C. Payne, R. Ruiz, C. Scarlata, J. Sluiter, D. Templeton and J. Wolfe, NREL/TP-510-42621, National Renewable Energy Laboratory, 2008 Search PubMed.
- X. M. Dou, X. Jiang, W. Z. Li, C. F. Zhu, Q. C. Liu, Q. Lu, X. S. Zheng, H. M. Chang and H. Jameel, Appl. Catal., B, 2020, 268, 1–16 CrossRef.
- J. W. Lee, J. Y. Kim, H. M. Jang, M. W. Lee and J. M. Park, Bioresour. Technol., 2015, 182, 296–301 CrossRef CAS PubMed.
- Z. Y. Qiu, Q. Q. Gao and J. Bao, Bioresour. Technol., 2017, 245, 1369–1376 CrossRef CAS PubMed.
- B. Chabbert, A. Habrant, M. Herbaut, L. Foulon, V. Aguie-Beghin, S. Garajova, S. Grisel, C. Bennati-Granier, I. Gimbert-Herpoel, F. Jamme, M. Refregiers, C. Sandt, J. G. Berrin and G. Paes, Sci. Rep., 2017, 7, 1–9 CrossRef CAS PubMed.
- S. Park, J. O. Baker, M. E. Himmel, P. A. Parilla and D. K. Johnson, Biotechnol. Biofuels, 2010, 3, 1–10 CrossRef PubMed.
- X. Zhao, S. Li, R. Wu and D. Liu, Biofuels, Bioprod. Biorefin., 2017, 11, 567–590 CrossRef CAS.
- H. Q. Le, A. Zaitseva, J. P. Pokki, M. Stahl, V. Alopaeus and H. Sixta, ChemSusChem, 2016, 9, 2939–2947 CrossRef CAS PubMed.
- A. F. M. Barton, Chem. Rev., 1975, 75, 731–753 CrossRef CAS.
- T. Mouthier, M. M. Appeldoorn, H. Pel, H. A. Schols, H. Gruppen and M. A. Kabel, Ind. Crops Prod., 2018, 121, 160–168 CrossRef CAS.
- K. Pandiyan, R. Tiwari, S. Rana, A. Arora, S. Singh, A. K. Saxena and L. Nain, World J. Microbiol. Biotechnol., 2014, 30, 55–64 CrossRef CAS PubMed.
- H. Guo, D. M. Miles-Barrett, A. R. Neal, T. Zhang, C. Li and N. J. Westwood, Chem. Sci., 2018, 9, 702–711 RSC.
- L. D. Sousa, M. J. Jin, S. P. S. Chundawat, V. Bokade, X. Y. Tang, A. Azarpira, F. C. Lu, U. Avci, J. Humpula, N. Uppugundla, C. Gunawan, S. Pattathil, A. M. Cheh, N. Kothari, R. Kumar, J. Ralph, M. G. Hahn, C. E. Wyman, S. Singh, B. A. Simmons, B. E. Dale and V. Balan, Energy Environ. Sci., 2016, 9, 1215–1223 RSC.
- X. J. Shen, J. L. Wen, Q. Q. Mei, X. Chen, D. Sun, T. Q. Yuan and R. C. Sun, Green Chem., 2019, 21, 275–283 RSC.
- R. Parthasarathi, R. A. Romero, A. Redondo and S. Gnanakaran, J. Phys. Chem. Lett., 2011, 2, 2660–2666 CrossRef CAS.
|
| This journal is © The Royal Society of Chemistry 2021 |
Click here to see how this site uses Cookies. View our privacy policy here. 
 Open Access Article
 This Open Access Article is licensed under a Creative Commons Attribution-Non Commercial 3.0 Unported Licence
 *ab,
Shengxin Anc,
Cunshuo Lia,
Xu Lia,
Mingwei Wua and
Xiuzhi Weia
*ab,
Shengxin Anc,
Cunshuo Lia,
Xu Lia,
Mingwei Wua and
Xiuzhi Weia