DOI:
10.1039/D0RA10678J
(Paper)
RSC Adv., 2021,
11, 11318-11328
Investigation of corrosion characteristics of Cu-10Ni-1.2Fe-xMn (x = 0.53, 0.87, 1.19) alloy in 3.5% NaCl solution
Received
20th December 2020
, Accepted 8th March 2021
First published on 17th March 2021
Abstract
Cupronickel alloys have been broadly utilized in various fields due to their excellent properties. In this paper, electrochemical impedance spectroscopy (EIS) and potentiodynamic polarization (PDP) curves were used to study the impact of different Mn contents on the corrosion resistance of 90/10 cupronickel alloy. Surface morphology, electronic structure, and phase composition of the film formed on different Mn content 90/10 cupronickel alloy immersed in 3.5% NaCl solution for 30 days were investigated using SEM, EDS, Mott–Schottky, XRD, XPS, etc., revealing that adding an appropriate amount of Mn to the 90/10 cupronickel alloy can change the corrosion resistance of the alloy. The corrosion resistance first increases and then decreases with the addition of Mn content. Among them, the sample with 0.87% Mn addition has the best corrosion resistance, the corrosion product film is more complete, no cracks appear, and the corrosion product binding force is stronger. The addition of Mn promotes the filling of cation vacancies by Ni and generates more NiO, which enhances the stability of the corrosion product film.
1 Introduction
Cupronickel alloy, as a material with excellent seawater impact corrosion resistance and anti-fouling properties, has been widely used in marine engineering, especially in the shipbuilding industry and seawater pipelines.1,2 The main reason for the excellent resistance of this alloy is the formation of a passive film on the surface during the corrosion process.3 North and Pryor believe that the corrosion resistance of cupronickel alloys is better than pure copper because the Ni in the alloy dissolves into the cuprous oxide film in the form of doped ions, and combines with the cation vacancies formed after the cuprous ions are dissolved.4,5 The combination will diminish the concentration of cation vacancies within the film and the ion and electronic conductivity of the film, which can increment the resistance of the passive film, Therefore the alloy is more resistant to corrosion.6 Campbell reported that the corrosion rate of cupronickel alloys decreased with the increment of immersion time, and advance concluded that the diffusion of corrosion products in the corrosion layer contains a noteworthy effect on the corrosion rate.7 Zhang detailed that the peeling tendency of the passive film formed by exposed copper flakes and other three commercial alloys in chlorine-rich solutions is related to the alloying elements in the matrix.8 A.L. Ma pointed out that Ni is enriched in oxidation state and metallic state in the inner layer of the passivation film formed by the 90/10 Cu–Ni tube immersed in seawater. As the film depth increases, nickel oxide decreases, and metallic nickel increases.9
As one of the main elements added to the cupronickel alloy, Mn plays a critical part in the corrosion process. Adding a proper amount of Mn to the cupronickel alloy can significantly improve the alloy's strength and impact corrosion resistance. When Mn is enriched in the original film of the alloy, the passive film formed during the corrosion process will be enriched in Ni, and vice versa, which shows that the enrichment of Ni in the passive film is related to the Mn content in the original film.
Although cupronickel alloys have better corrosion resistance than other materials, corrosion and leakage accidents of cupronickel alloy pipes are still frequently reported, causing significant economic losses.10,11 The corrosion problem of cupronickel alloy seawater pipelines has been plagued by industries such as ships and coastal power plants and is an urgent problem to be solved.12 And the effect of changes in Mn content on the corrosion behavior of cupronickel alloys has not been fully studied.
In this paper, the electrochemical behavior of 90/10 cupronickel alloys with different Mn content immersed in 3.5% NaCl solution for different time was studied by using electrochemical means such as polarization curves and EIS, and the influence of Mn content changes on the electrochemical performance of 90/10 cupronickel alloys was analyzed. After the immersion test, a passive film was shaped on the surface of the sample. The morphology of corrosion products was observed by SEM, the chemical composition of corrosion products was determined by EDS, and the structure of corrosion products was characterized by XRD. To quantitatively analyze the chemical composition and element valence of corrosion product films of different depths, XPS was used to test the surface and interior of the corrosion product layers.
2 Experimental materials and methods
2.1 Materials
The investigated materials are 90/10 cupronickel alloys with different Mn content. The composition of the alloys is provided in Table 1. The alloys were produced in a vacuum arc melting furnace using pure Cu (99.9 wt%), pure Ni (99.9 wt%), pure Fe (99.9 wt%), and pure Mn (99.9 wt%). After milling, the ingots were homogenized at 950 °C for 3 h and then hot rolled into 3 mm thick plates. Finally annealed at 720 °C for 1 hour, followed by water quenching.
Table 1 Chemical compositions of 90/10 cupronickel alloys (wt%)
| Alloy |
Chemical composition/wt% |
| Ni |
Fe |
Mn |
| 0.53Mn |
10.61 |
1.29 |
0.53 |
| 0.87Mn |
10.56 |
1.26 |
0.87 |
| 1.19Mn |
10.64 |
1.32 |
1.19 |
| S < 0.0010, C < 0.005, P < 0.0010, Cu: balance |
2.2 Sample preparation and electrochemical test
A 10 mm × 10 mm square sample was cut from the annealed sheet for electrochemical measurement. The non-working wall of the sample is smoothed with sandpaper, and copper wire is soldered on the opposite side of the working wall with solder. Encapsulate the sample in a PVC pipe with epoxy resin, and only expose the 100 mm2 test surface. After the resin is completely cured, use sandpaper to mechanically grind the test surface of the sample to 3000#, and then polished and polished with 0.5 μm polishing paste. Finally, the sample was ultrasonically cleaned in absolute ethanol and dry in cold air for use. A classical three-electrode cell was used for electrochemical measurement in an electrochemical workstation (CHI660E, SHANGHAI). The samples, saturated calomel electrode (SCE), and platinum were used as the working electrode (WE), the reference electrode (RE), and the counter electrode (CE), respectively. The corrosion resistance and semiconductor properties of product film of the alloys were assessed using electrochemical measurements in Cl− containing solutions of 3.5% NaCl and alkaline 3.5% NaCl (0.1 M NaOH + 3.5% NaCl).13 Use a neutral 3.5% NaCl solution as an electrolyte to simulate the corrosion of natural seawater, which can well simulate the corrosion environment of seawater.14 The alkaline 3.5% NaCl solution was chosen because the alkaline solution has the effect of improving the passivation efficiency of the alloy. The alkaline solution has been widely used to study the semiconductor properties of cupronickel alloys.15 Electrolyte solutions used in electrochemical measurement are all prepared in proportion to analytical reagents and deionized water.
The electrochemical impedance spectroscopy test was carried out after immersion for 30 min, 3 d, 7 d, and 30 d, and the potential dynamic polarization curve test was carried out after immersion for 30 days. The frequency of EIS was ranged from 100 kHz to 10 mHz with an AC potential signal of 10 mV after open circuit potential (OCP) in a steady-state. EIS data is fitted with ZsimpWin. The PDP was measured at the extend of −500 mV to 100 mV with a scan rate of 1 mV s−1. Besides, anodic polarization at 0.2 V was performed for 3600 s to form a steady-state passivation film in an alkaline 3.5% NaCl solution. The imaginary part of the impedance of the passive film is obtained at a frequency of 1000 Hz in a negative direction from 0.5 Hz to −0.5 V and a frequency of 1000 Hz at a negative potential of 5 Hz.
2.3 Characterization and analysis of surface corrosion products
The field emission SEM (Carl Zeiss, SIGMA) was used to observe the corrosion products on the surface of the sample after immersion corrosion and the morphology of the matrix after the corrosion products were removed. And EDS (Oxford, X-MaxN 20 mm2) used for surface film composition analysis. The phase components of the passive film were analyzed by XRD (PANalytical Xpert Powder, Cu Kα radiation at 40 kV) with a 2.0 °min−1 scanning speed at 2θ range of 10–90°, use jade 6.0 to analyze the results.
To understand the influence of Mn on the properties of different depth components of the corrosion product film, XPS (EscaLab 250Xi) was used to conduct a surface analysis of the passive film. XPS spectra were recorded with Al Kα radiation (1486.6 eV) under vacuum (5 × 10⁻⁹ mbar). The C1s peak located at 284.8 eV was used as a reference peak. The signals of the surface corrosion product were collected after sputtering for 0, 50, 100, 150 and 200 nm, collect the signals of surface corrosion products, deeply analyze the longitudinal chemical composition of the film, and understand the valence and content of each element in the film, and the results were analyzed and fitted using advantage 5.52.
3 Results and discussion
3.1 Electrochemical measurement
3.1.1 Electrochemical impedance spectroscopy. Fig. 1 shows the Nyquist diagram and Bode diagram of the 90/10 cupronickel alloys with different Mn content under the same corrosion time. The Nyquist diagram shows that the curves of the samples in the early stage of corrosion are all composed of capacitive reactance arcs in the high-frequency region and Warburg impedance in the low-frequency region. Among them, the sample with 0.87Mn content has the largest capacitive reactance arc radius, and Warburg impedance is the longest. At this time, due to the presence of oxygen in the solution, the formation of corrosion products on the sample can be promoted, but the rate of oxide film formation is lower than the dissolution rate, and there is a concentration gradient of oxygen in the cathode reaction, indicating that the corrosion mechanism at the initial stage of immersion is the charge transfer process and dissolved oxygen joint control of the diffusion process. At the same time, the corresponding phase angle diagram shows that when the Mn content is 0.87%, the phase angle has moved a certain distance to the low-frequency direction. It can be found in all the Nyquist plots of different immersion times that the impedance arc of 0.87Mn content samples is significantly higher than other Mn content samples. As the immersion progresses, the radius of the impedance arc gradually increases, the Warburg impedance disappears, the formation of passive film blocks the erosion of Cl−, and the corrosion rate decreases. At this time, the surface reaction of the alloy is mainly controlled by charge transfer. After being immersed for 7 days, the impedance arc radius of the 0.87Mn content sample increased from the impedance arc radius of the other two samples. The impedance arc radius grew faster, and the advantage was extremely obvious. The impedance and Bode diagrams of samples immersed for three days and seven days with Mn content of 0.53% and 1.19% are not obvious. The corrosion product film gradually formed during this period, which played a certain protective effect on the substrate. After being immersed for 30 days, the impedance model of the 0.87Mn sample in the low-frequency region was significantly larger. This is because the corrosion product film of the 0.87Mn content sample is denser and complete. The corrosion product film of other Mn content samples may peel off and is not dense enough, and there are cracks.
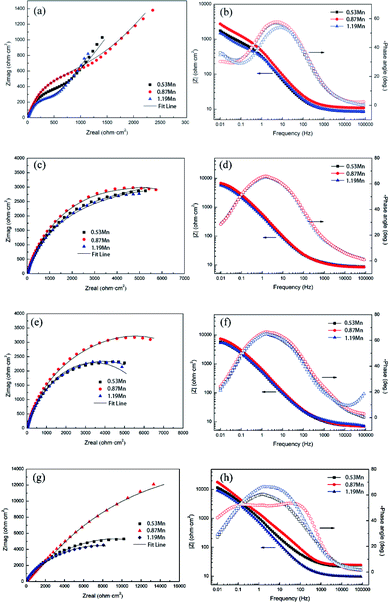 |
| | Fig. 1 Nyquist diagram and Bode diagram of Cu-10Ni-1.2Fe-xMn alloy in 3.5% NaCl solution for different corrosion cycles. (a) and (b) 30 min; (c) and (d) 3 d; (e) and (f) 7 d; (g) and (h) 30 d. | |
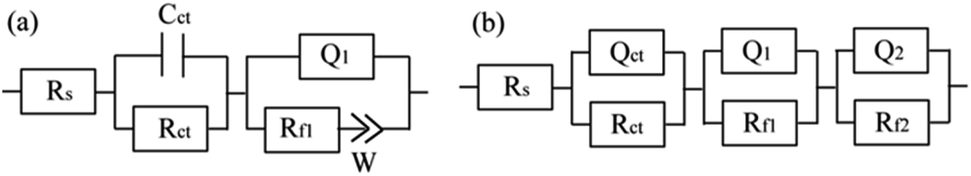
The equivalent circuit in Fig. 2(a) is used to fit the impedance spectra with Warburg impedance at the initial stage of corrosion.16 The resistance element Rs in the equivalent circuit represents the solution resistance between the reference electrode and the sample, the capacitive element Cct represents the electric double layer capacitance between the sample and the solution, and Rct represents the resistance when the charge is transferred between the sample and the solution. Since the 90/10 cupronickel is in contact with air or aerated solution, a thin oxide film (not corrosive product film) will be formed on the surface of the alloy, so the RC parallel element is used to represent the oxide film, Rf1 represents the film resistance, and Q1 represents the value corresponding to Rf1 constant phase element.17 It is worth noting here that considering the uniformity of the alloy surface (including roughness, grain boundaries, impurities, etc.),18,19 the use of Q instead of pure capacitive elements. Since the result includes the Warburg impedance, W is used to represent the Warburg impedance, which represents the diffusion process in the corrosion process.
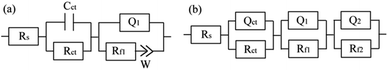 |
| | Fig. 2 Equivalent circuit diagram of 90/10 cupronickel alloys for fitting different periods of electrochemical impedance spectroscopy. (a) Early stage of corrosion; (b) middle and late stage of corrosion. | |
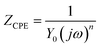
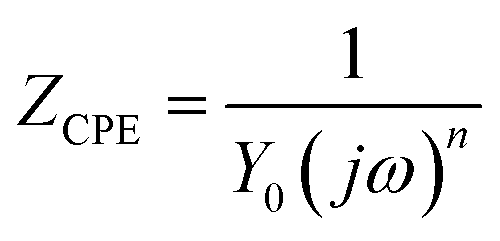
As the corrosion progresses, the passive film on the alloy is gradually complete and dense, and its applicable equivalent circuit diagram will also change accordingly.20 The equivalent circuit in Fig. 2(b) is used to fit the impedance spectrum after corrosion for 3 days. Rs and Rct in Fig. 2(b) have the same meaning as Rs and Rct in Fig. 2(a). Since the passive film gradually formed on the alloy is not completely flat, the electric double layer gradually deviates from the pure capacitance. Therefore, Qct is used instead of Cct in the middle and late stages of corrosion. The passive film of the cupronickel is a double-layer film structure, so Rf1 and Qf1 are used to characterize the outer film structure, and Rf2 and Qf2 are used to characterize the inner film structure. Due to the roughness of the film, CPE is used to replace the ideal capacitive element. The impedance of CPE is calculated by the following formula:21
| |
 | (1) |
where
Y0 is the size of the CPE,
j is the imaginary unit,
ω is the angular frequency, and
n is the index of the CPE. According to the electrochemical theory, the total film resistance
Rtotal is used to quantify the resistance of the passive film generated by the alloy in the solution. The calculation formula is shown in
eqn (2):
22| | |
Rtotal = Rct + Rf1 + Rf2
| (2) |
The data listed in Table 2 are EIS fitting data. The fitting accuracy of the fitted curve is evaluated using the χ2 value. The fitting accuracy of the two equivalent circuits is 10−4, indicating that the use of the two equivalent circuits is reasonable. It can be found from the table that the Rtotal value of the samples with different Mn content during corrosion for 7 d is smaller than the Rtotal value for corrosion for 3 d. This is because the ions in the passive film of the sample are dissolved to generate a large number of cation vacancies, which reduces the film resistance. With the extension of the corrosion time, the dissolved Ni in the matrix is filled into the cation vacancies, making the film denser, and the Rtotal value of the sample gradually increases. Corrosion under the same conditions for 30 days, the Rtotal value of the 0.87Mn content sample is the largest, and the 1.19Mn content sample has the smallest Rtotal value. The results of EIS show that the passive film formed on the 0.87Mn content sample has the best corrosion resistance, and the 1.19Mn content sample has the worst corrosion resistance.
Table 2 Fitting results of electrochemical impedance spectroscopy of Cu-10Ni-1.2Fe-xMn alloy corroded in 3.5% NaCl solution for different time
| Time |
Sample |
Rs/Ω cm2 |
Rct/Ω cm2 |
Q1 × 10−4/F cm−2 |
n1 |
Rf1/Ω cm2 |
Rtotal/Ω cm2 |
χ2 × 10⁻⁴ |
| 30 min |
0.53Mn |
10.78 |
4 |
7.31 |
0.8 |
931.6 |
937.6 |
5.46 |
| 0.87Mn |
6.16 |
5 |
4.92 |
0.8 |
1417 |
1422 |
6.91 |
| 1.19Mn |
8.841 |
3.21 |
5.58 |
0.8 |
500.8 |
504.01 |
6.12 |
| 3 d |
0.53Mn |
8.369 |
6.108 |
5.85 |
0.7645 |
4910 |
12![[thin space (1/6-em)]](https://www.rsc.org/images/entities/char_2009.gif) 356.108 356.108 |
2.97 |
| 0.87Mn |
8.394 |
4.068 |
4.54 |
0.7743 |
6842 |
15637.068 |
3.55 |
| 1.19Mn |
8.516 |
4.762 |
6.62 |
0.7568 |
4107 |
10347.762 |
2.66 |
| 7 d |
0.53Mn |
6.92 |
6.266 |
12.6 |
0.8382 |
1210 |
7710.266 |
2.78 |
| 0.87Mn |
6.828 |
6.836 |
5.74 |
0.7789 |
3139 |
10392.836 |
2.70 |
| 1.19Mn |
7.15 |
3.479 |
16.3 |
0.8682 |
638.1 |
7179.579 |
5.99 |
| 30 d |
0.53Mn |
20.28 |
19.85 |
3.87 |
0.7039 |
4461 |
16850.85 |
4.27 |
| 0.87Mn |
23.79 |
105.9 |
3.19 |
0.7997 |
882.5 |
44118.4 |
7.55 |
| 1.19Mn |
9.635 |
2.667 |
6.15 |
0.7864 |
2045 |
13987.667 |
2.57 |
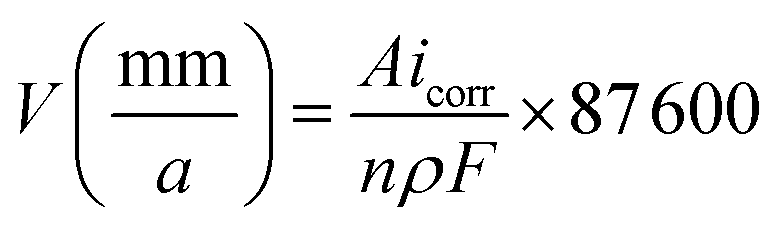
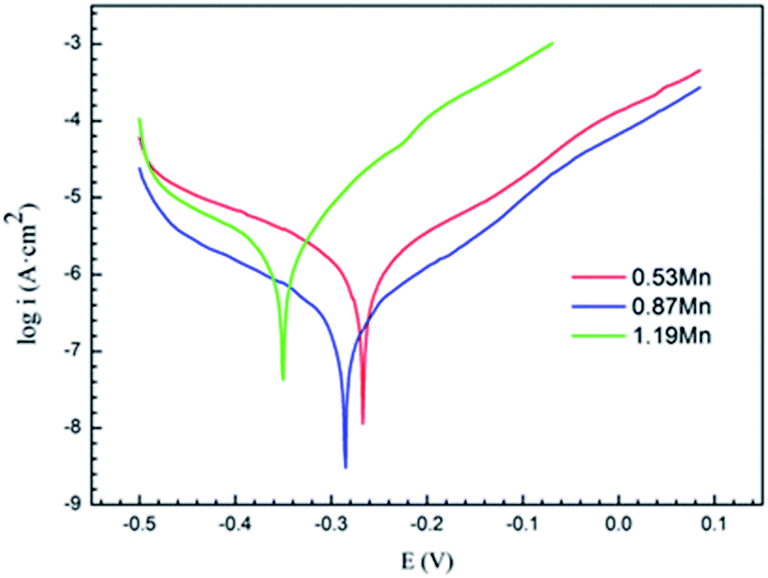
3.1.2 Potentiodynamic polarization curves. The PDP curves measured after samples with different Mn content immersed in 3.5% NaCl solution for 30 days are shown in Fig. 3. Table 3 lists the corrosion potential (Ecorr), current density (icorr), and corrosion rate. The corrosion rate is calculated by the following formula:| |
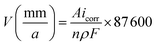 | (3) |
where A represents the molar mass, n represents the number of charge transfers of the reactants, ρ is the density of the alloy, and F is the Faraday constant (value 26.8 A h).23 Obviously, as the amount of Mn added increases, the self-corrosion potential moves in a more positive direction, which shows that as the amount of Mn increases, the corrosion tendency becomes worse. As show in Table 3, the Icorr of 0.87Mn alloy is lower than that of other samples, which mean that 0.87Mn alloy has better corrosion resistance.
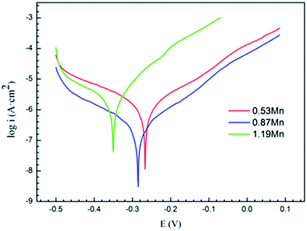 |
| | Fig. 3 Potential polarization curve of Cu-10Ni-1.2Fe-xMn alloy immersed in 3.5% NaCl solution for 30 days. | |
Table 3 Polarization parameters of Cu-10Ni-1.2Fe-xMn alloy in 3.5% NaCl solution
| Sample |
Ecorr/mV |
icorr/(μA cm−2) |
V/(mm/a) |
| 0.53Mn |
−266.4 |
0.055 |
0.0006 |
| 0.87Mn |
−285.9 |
0.011 |
0.0001 |
| 1.19Mn |
−350.3 |
0.224 |
0.0026 |
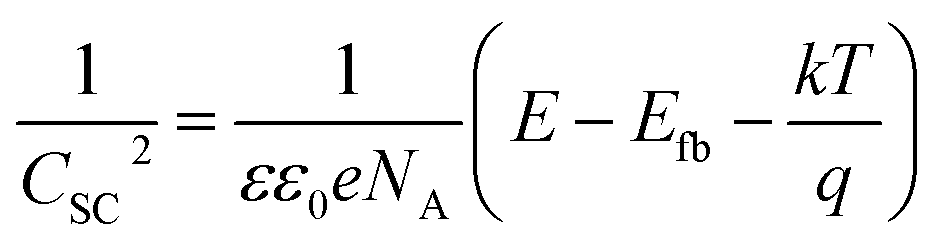
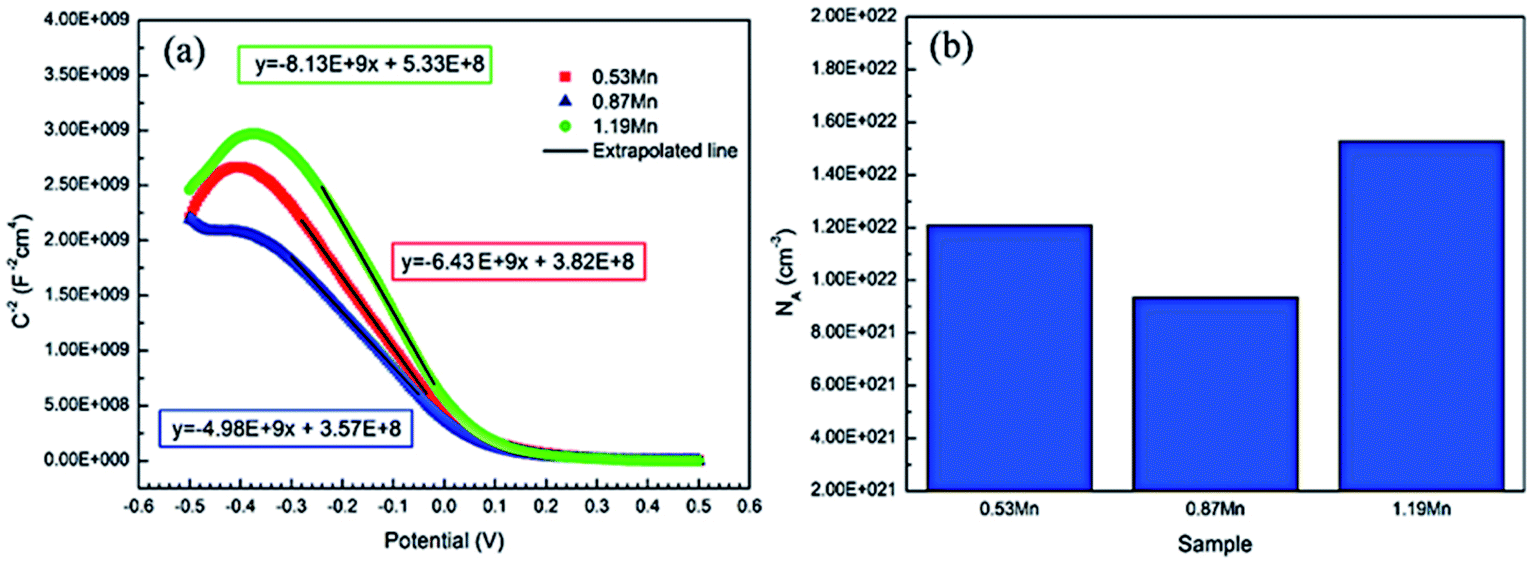
3.1.3 Mott–Schottky curve. To determine the role of Mn on the passive film during the immersion process, the Mott–Schottky curve was measured, Fig. 4 shows the measured results. It can be seen that the slope is negative in the linear region from −0.4 V to 0.1 V, and the slope of the linear region changes with the change of Mn content. This indicates that the semiconductor type of the alloy surface film is a p-type semiconductor. Mainly, the main acceptor defects are cation vacancies, and changes in the composition will not change the semiconductor properties of the film, only the point defect density. The defect concentration (NA) is determined by the following formula: | |
 | (4) |
 |
| | Fig. 4 Mott–Schottky curve (a) and defect concentration (b) of Cu-10Ni-1.2Fe-xMn alloy passivated in alkaline 3.5% NaCl solution for 1 h. | |
In the formula, CSC is equal to the measured capacitance (C),24 ε represents the dielectric constant of the semiconductor (Cu2O is 7.26 (ref. 25)), ε0 is the vacuum dielectric constant (8.854 × 10⁻¹² F m−1), e represents electronic charge (1.602 × 10⁻¹⁹ C), E, Efb, k, T are applied voltage, flat band potential, Boltzmann constant, and absolute temperature respectively. kT/q is about 25 mV at room temperature. The value can be ignored.26 The defect concentration is calculated from this, and its value changes with the composition trend as shown in Fig. 3(b). The relative amount of defect concentration in the corrosion products first decreases with the increase of Mn addition and then increases after decreasing to a certain value. The defect concentration of the sample with 0.87% Mn content is lower. At this time, the more compact surface film has the strongest protections for the alloy matrix, and the alloy exhibits the best corrosion resistance.
3.2 Characterization of microstructure
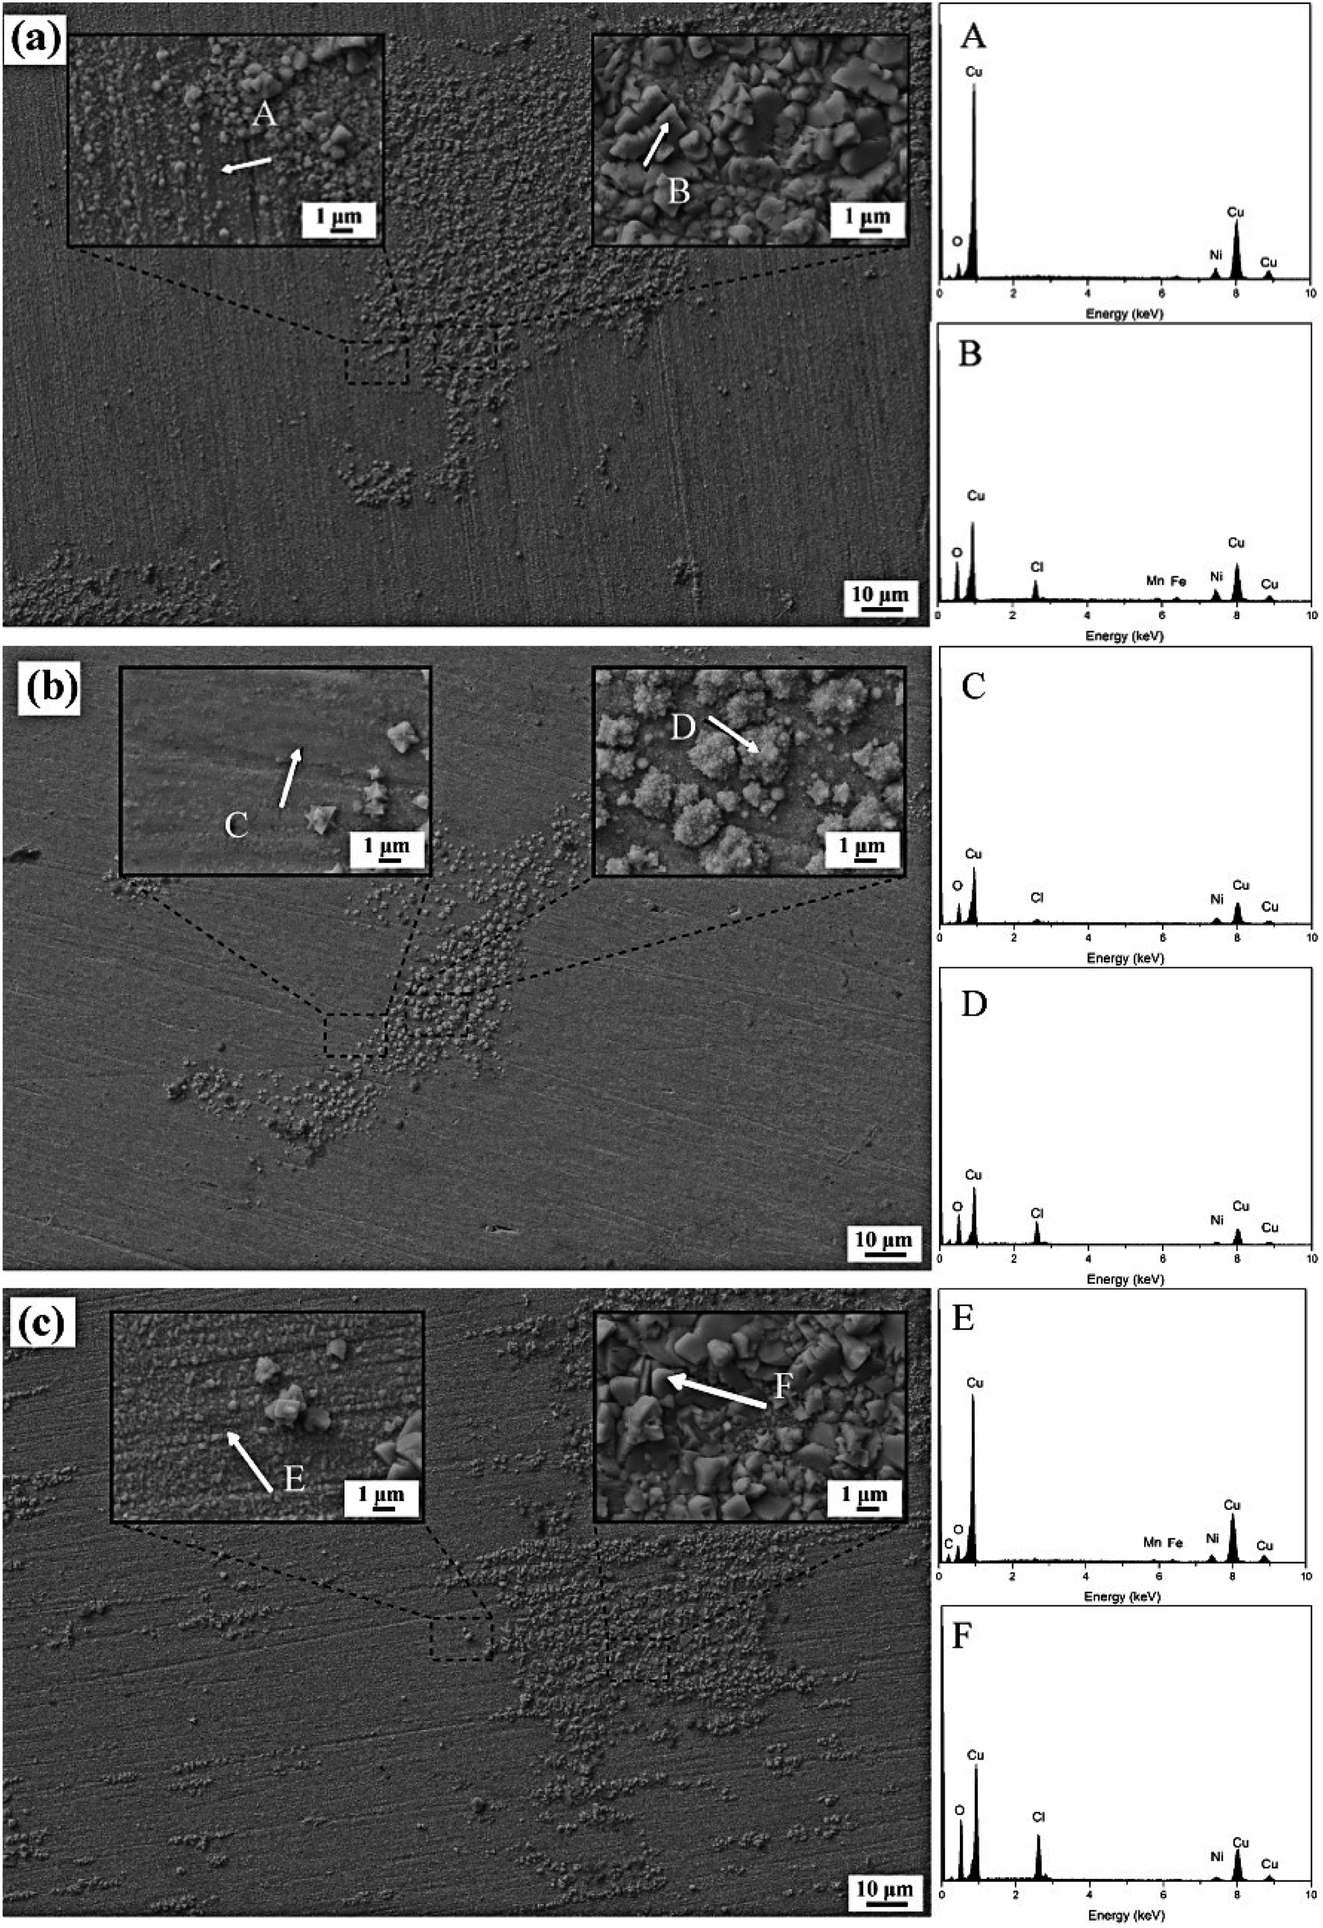
3.2.1 SEM. Fig. 5 is the SEM image of the corrosion product morphology of different samples after corrosion immersion in NaCl solution for 30 days. Table 4 lists the EDS analysis results of each point in Fig. 5. It can be found from Fig. 5 that all samples contain two layers of corrosion products. Among them, the surface of 0.53Mn and 1.19Mn samples is completely stacked by small particles, and the structure is loose, and large particles are attached to them in blocks, which have a large attachment area. The passive film completely covers the surface of the 0.87Mn sample, and the structure is dense and complete. The area of the large particle product attached to it is smaller than that of the other two samples. It can be found from Table 4 that alloys with high Ni content in small particles have good corrosion resistance, and alloys with low Ni content in small particles have poor corrosion resistance.
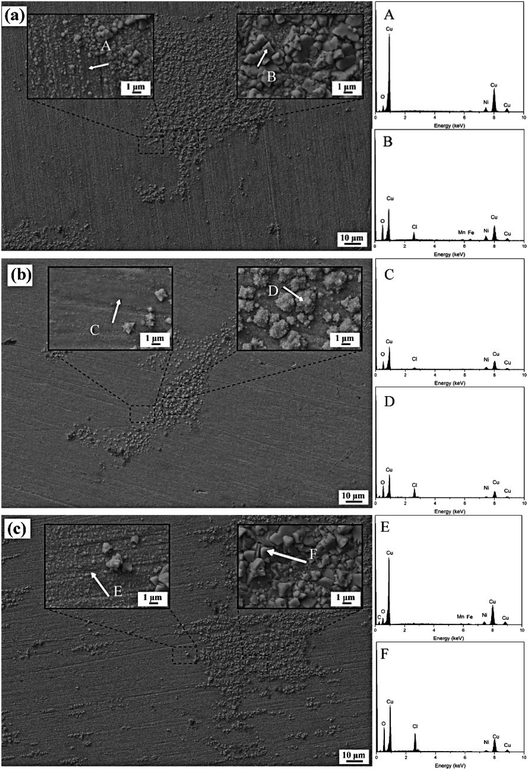 |
| | Fig. 5 The surface micromorphology and EDS spectrum of the passive film of Cu-10Ni-1.2Fe-xMn alloy immersed for 30 days. (a)0.53Mn; (b)0.87Mn; (c)1.19Mn. | |
Table 4 EDS analysis results corresponding to each point in Fig. 5
| |
Cu |
Ni |
Fe |
Mn |
O |
Cl |
| A |
80.87 |
12.06 |
1.35 |
0.00 |
5.72 |
0.00 |
| B |
57.32 |
6.77 |
0.93 |
0.00 |
24.76 |
10.22 |
| C |
66.43 |
15.22 |
0.00 |
0.00 |
16.77 |
1.58 |
| D |
52.44 |
6.69 |
0.00 |
0.00 |
29.19 |
11.67 |
| E |
80.21 |
9.98 |
1.51 |
0.00 |
7.59 |
0.70 |
| F |
51.69 |
4.25 |
0.00 |
0.96 |
30.43 |
12.66 |
The SEM image of the surface morphology of the sample after removing the passivation film is shown in Fig. 6. When the Mn content is as low as 0.53%, it can be found that there are many corrosion pits of different depths on the surface of the substrate after the passive film is removed, and the substrate around the corrosion pits presents a layered structure. When the Mn content is increased to 0.87%, the surface of the substrate is smooth and flat without obvious corrosion pits. When the Mn content is 1.19%, the surface morphology of the substrate after the passive film is removed is very different from the first two samples, and deep and large diameter corrosion pits are formed on the surface, indicating that the passive film has poor protection and cannot be effective Prevent the corrosion of the corrosive medium to the matrix. It can also be found from the figure that the bottom of the corrosion pit of the 1.19Mn sample, like the rest of the matrix, presents a loose layered structure.
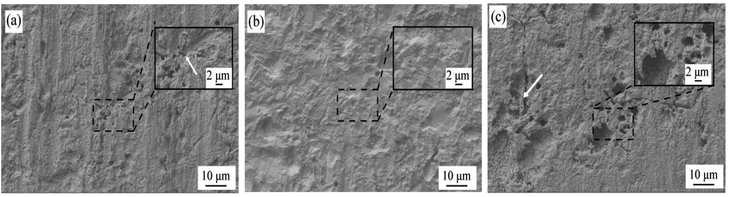 |
| | Fig. 6 Surface morphology of Cu-10Ni-1.2Fe-xMn alloy after immersion for 30 days (passive film removed) (a) 0.53Mn; (b) 0.87Mn; (c) 1.19Mn. | |
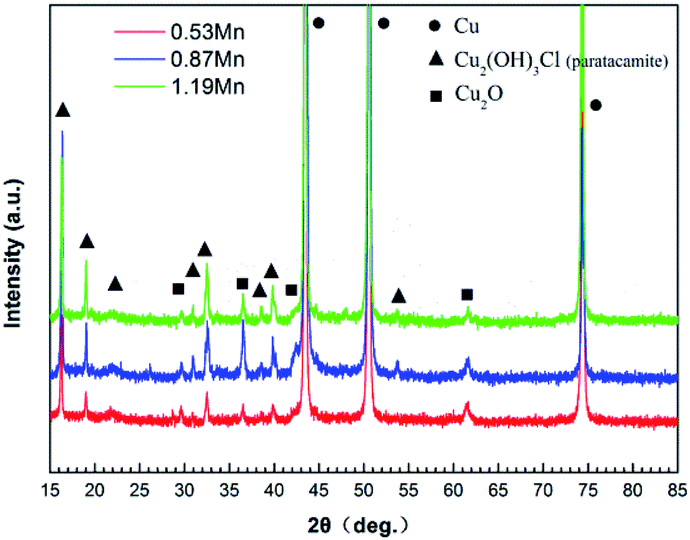
3.2.2 XRD. The XRD pattern is shown in Fig. 7. It can be found that the main film of Cu-10Ni-1.2Fe-xMn alloys is composed of Cu, Cu2(OH)3Cl (paratacamite), and Cu2O after immersed in 3.5% NaCl solution for one month. These results are common compounds of Cu-10Ni alloy corrosion products. The copper preferentially dissolves due to the presence of Cl− on the surface of the alloys and redeposits to form Cu2O, And then Cu2O reacting with Cl− to form Cu2(OH)3Cl.27 The small amount and amorphous phase can't be reliably identified via XRD.28 Therefore, XPS is performed to study the compositions of the product film.
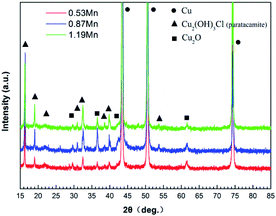 |
| | Fig. 7 The XRD pattern of the passive film of Cu-10Ni-1.2Fe-xMn alloy immersed in 3.5% NaCl solution for 30 days. | |
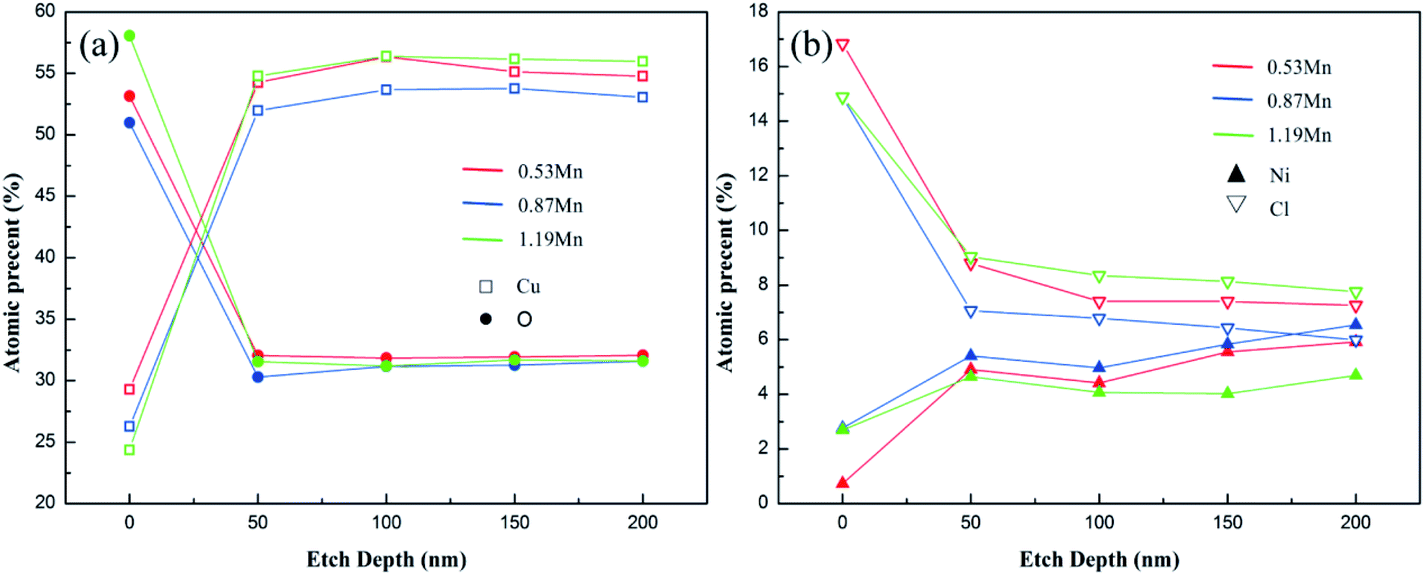
3.2.3 XPS. To gain a deeper understanding of the corrosion mechanism of Mn, XPS analysis was performed on the passive film.29 The distribution of Cu, Ni, O, and Cl elements in the passive film is shown in Fig. 8. It can be seen that the O atom percentage in the passive film of each sample is not much different, while other atoms have obvious differences. The 0.87Mn sample with the best corrosion resistance contains the highest content of Ni atoms and the lowest content of Cl and Cu atoms, while the 1.19Mn sample with poor corrosion resistance shows the opposite content changes. This shows that the corrosion resistance of the alloy has a great relationship with the composition of the surface corrosion product layer. After 100 nm of sputtering, at least 6% of Cl− can still be detected in the corrosion product film, indicating that Cl− has diffused into the inside of the film.30 After sputtering to a depth of 200 nm, the content of Ni in the passive film of all samples still increased, while the content of Cl element decreased to varying degrees. From the XPS element content along the depth distribution data, combined with the analysis of the corrosion data results in the previous section, it can be found that the passive film of the 0.87Mn sample with the best corrosion resistance contains the highest Ni content and the lowest Cl content. The Ni and Cl content of the 1.19Mn sample with the worst corrosion resistance is the opposite.
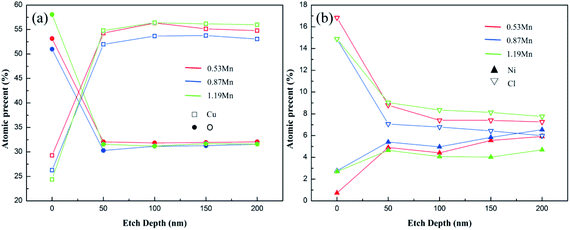 |
| | Fig. 8 The element content ((a) Cu, O, (b) Ni, Cl) in the passive film of Cu-10Ni-1.2Fe-xMn alloy distributed with the depth of sputtering after immersed in 3.5% NaCl solution for 30 days. | |
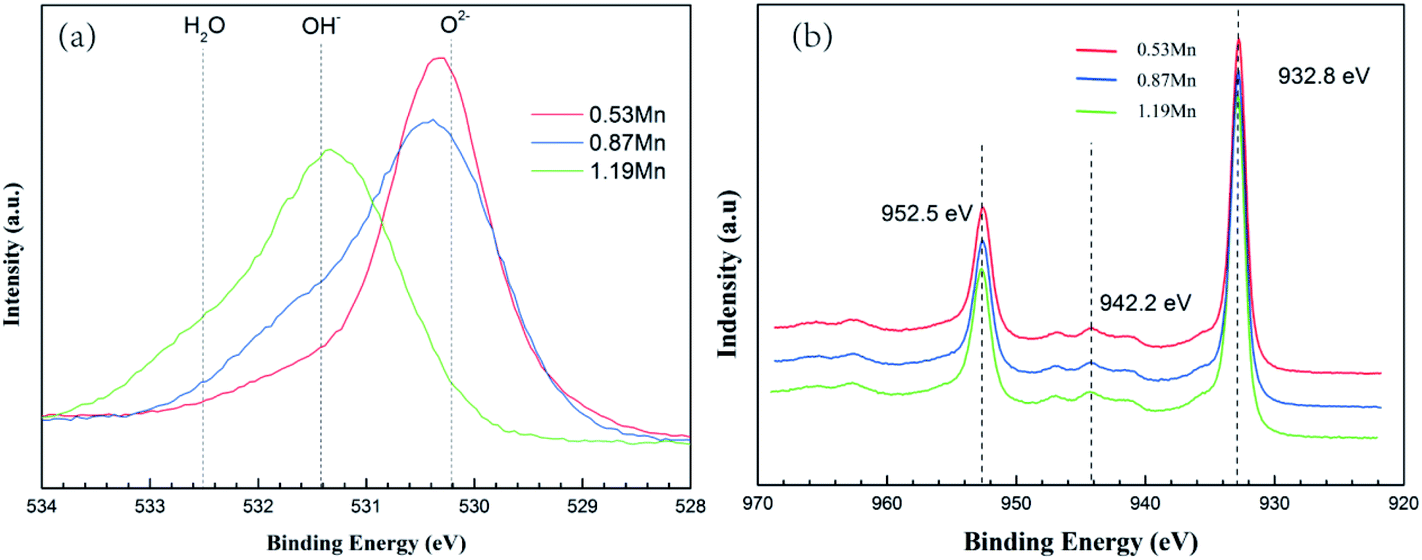
Fig. 9 shows the high-resolution XPS spectra of O1s and Cu2p, in the three main peaks of the high-resolution spectrum of O1s at 531.4, 530.2, and 532.5 eV correspond to OH−, O2− and H2O respectively. In the three different Mn content of 90/10 cupronickel alloys passive film, the existence of the O element is quite different. 0.53Mn sample is mainly O2−, H2O, and OH− is less, 0.87Mn sample is less O2− than 0.53Mn but contains more H2O and OH−, 1.19Mn sample is mainly OH−. It can be found from Fig. 8(b) that the spectra of Cu in the corrosion product films of all samples are similar, consisting of two main Cu/Cu2O peaks and a Cu2(OH)3Cl peak. No other Cu compounds were found.
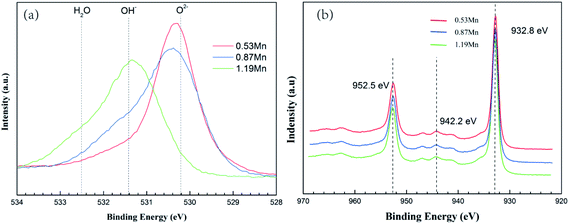 |
| | Fig. 9 Cu-10Ni-1.2Fe-xMn alloy is immersed in 3.5% NaCl solution for 30 days. The passive film O1s (a) and Cu2p (b) XPS spectra. | |
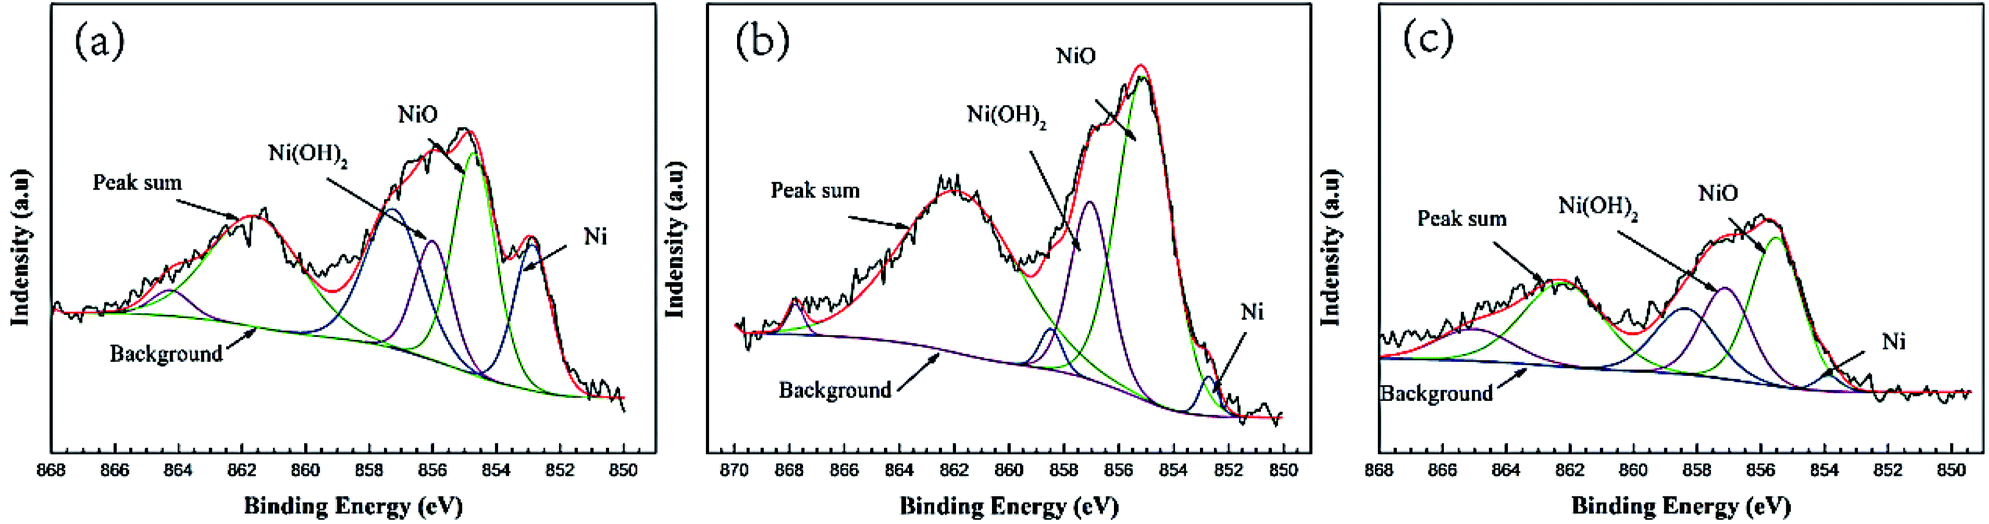
The Ni2p high-resolution spectra of alloy corrosion products with different Mn content are shown in Fig. 10. Considering the double nature of Ni2p lines at the peak fitting, the curves were fitted with similar binding energy separation (approximately 6 eV) of the double peak, FWHM, and intensity ratio. The Ni2p spectrum is deconvoluted into Ni, Ni(OH)2, and NiO. It can be discovered that the content of Ni compound in the corrosion product film of different samples immersed in 3.5% NaCl solution for 30 days. (a)0.53Mn; (b)0.87Mn; (c)1.19Mn is different. Obviously, the Ni compound of 0.87Mn is higher than the other two samples.
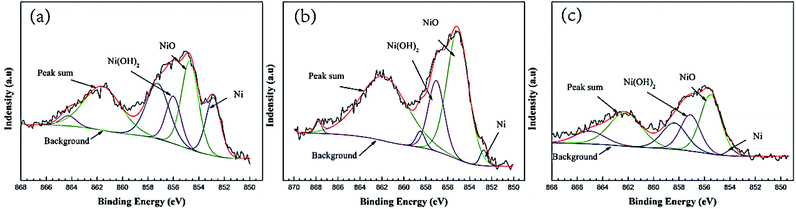 |
| | Fig. 10 XPS spectra of Ni2p for the surface of the passive film formed on Cu-10Ni-1.2Fe-xMn alloy. | |
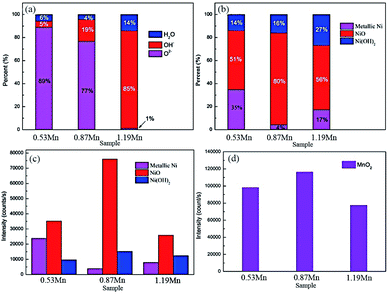
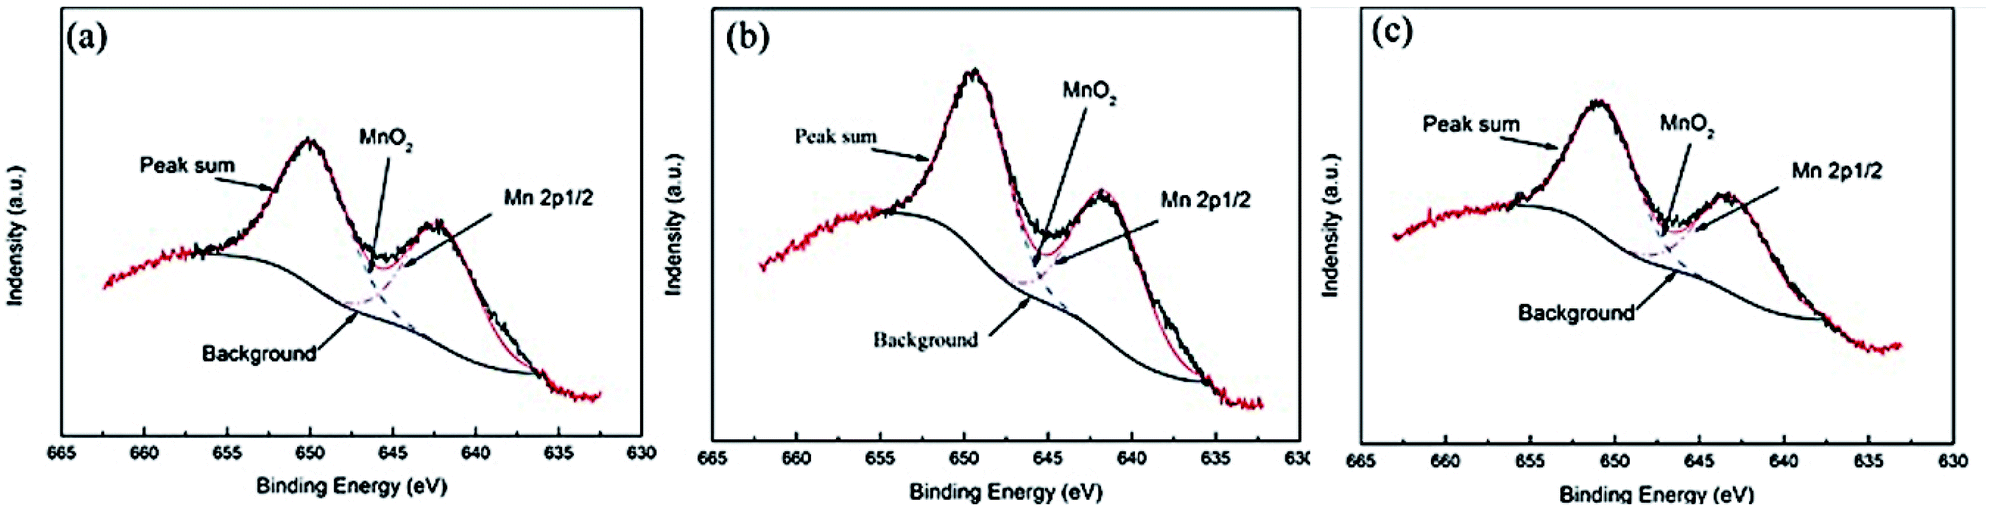
Fig. 11 is a high-resolution map of Mn2p in the passive film of 90/10 cupronickel alloys with different Mn content. Through deconvolution fitting of the spectrum, it is found that the Mn element peaks in the alloy passive film mainly appear in two peak positions, corresponding to MnO2 (641.9 eV) and Mn 2p1/2 (650.1 eV). To compare the differences of the compounds in the passive film in different samples more intuitively, the quantitative ratios and quantities of relative components in Fig. 9(a), 10, and 11 are shown in Fig. 12. The content of NiO and Ni(OH)2 in the corrosion product film first increases and then decreases with the content of Mn increases, the composition of elemental Ni is the opposite. The addition of Mn changed the enrichment of Ni element corrosion product film, which in turn affected the corrosion resistance of the alloy. With the increment of Mn content, the MnO2 content in the corrosion product film first increases and then decreases. The EIS results in Fig. 1 show that 0.87Mn exhibits the best corrosion performance. It can be seen that the relative content of NiO in the passive film plays a decisive role in the corrosion resistance of the 90/10 cupronickel alloys. The higher the NiO content, the greater the corrosion product film resistance and the better the corrosion resistance. At the same time, the MnO2 content in the passive film is more than that of the other two samples, indicating that the MnO2 content will affect the protection ability of the passive film.
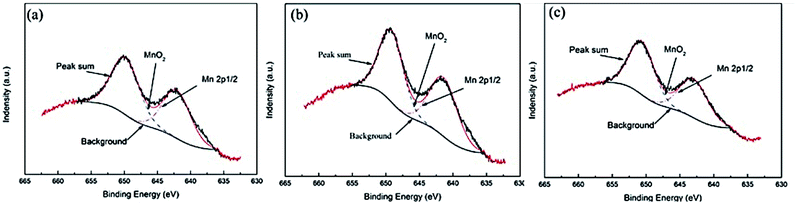 |
| | Fig. 11 XPS spectra of Mn2p for the surface of the passive film formed on Cu-10Ni-1.2Fe-xMn alloy immersed in 3.5% NaCl solution for 30 days. (a) 0.53Mn; (b) 0.87Mn; (c) 1.19Mn. | |
 |
| | Fig. 12 Percent of peak total strength of O 1s (a), Ni 2p (b), and relative content of Ni (c), Mn (d) compound of the passive film formed on Cu-10Ni-1.2Fe-xMn alloy in 3.5% NaCl solution for 30 days. | |
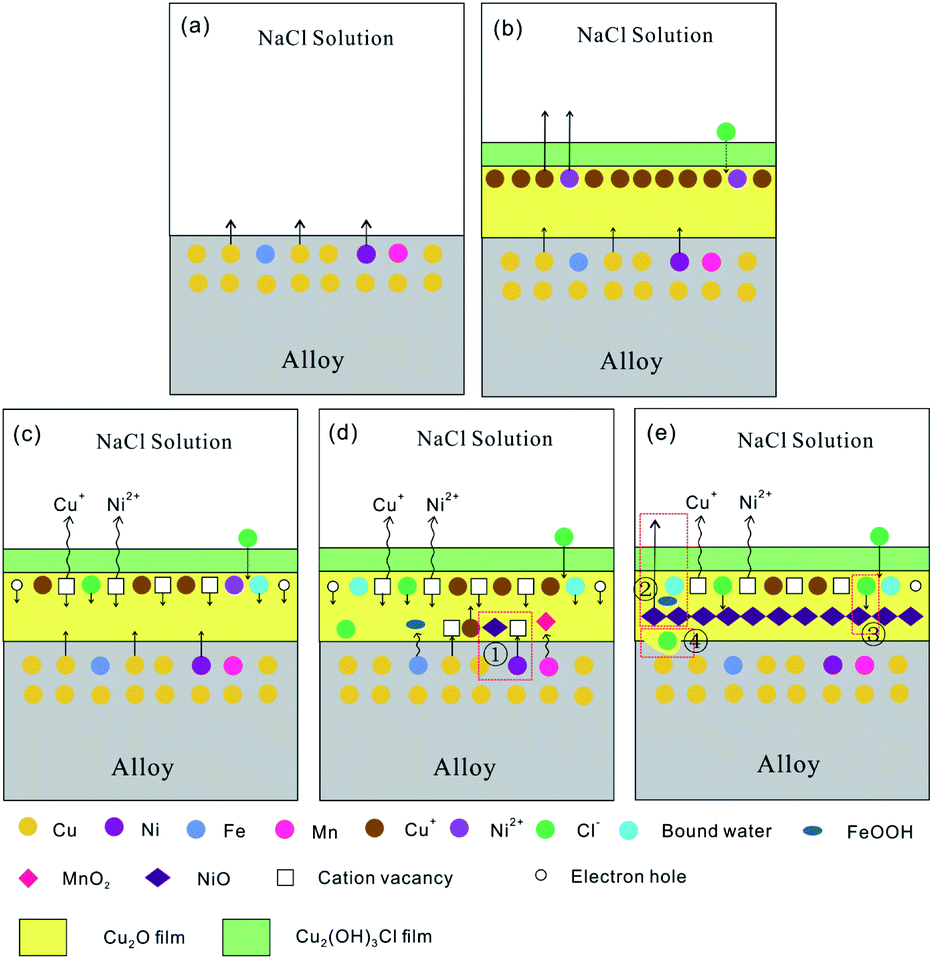
3.3 Corrosion mechanism
The protective effect of the passive film of 90/10 cupronickel alloys is mainly affected by the Cu2O in the film. From the formation of Cu2O in the product film as the research object, the influence mechanism of Mn on the passive film of 90/10 cupronickel alloys is discussed. At the initial stage of corrosion, Cu2O film is formed by the following reaction:31| | |
2Cu + H2O ↔ Cu2O + 2H+ + 2e−
| (5) |
| | |
Cu + 2Cl− ↔ CuCl2− + e−
| (6) |
| | |
2CuCl2− + H2O ↔ Cu2O + 2Cl− + 2H+
| (7) |
As shown in Fig. 13(a) and (b), as the immersion time increases, Cu2O is continuously generated, which increases the thickness of the Cu2O film, and the diffusion of the corrosive medium in the film is restricted, thereby playing a protective role. At the same time, part of Cu2O will react with Cl− adsorbed on the surface or diffused into the film to form Cu2(OH)3Cl. The reaction equation is as follows:
| | |
Cu2O + Cl− + H2O ↔ Cu2(OH)3Cl + H+ + 2e−
| (8) |
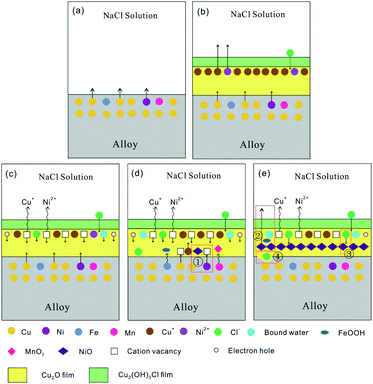 |
| | Fig. 13 Schematic diagram of corrosion mechanism: (a and b) Cu2O formation and reaction, (c and d) cation vacancy concentration increases and diffuses, (e) occluded corrosion cells formed in the pits accelerates the alloy corrosion process. | |
According to N. Sato's previous research and point defect model, Cu2O is a p-type semiconductor.32,33 This conclusion is also verified by analyzing the Mott–Schottky curve in Fig. 4. The Cu+ in Cu2O on the surface of the passive film easily dissolves into the corrosion medium, leaving cation vacancies  and a corresponding number of electron holes (h, produced to maintain the electrical neutrality of the film), which will reduce the Cu2O lattice constant. With the progress of the corrosion process, the concentration of cation vacancies on the passive film gradually increases, and the driving force for diffusion into the film is generated, so that the cation vacancies diffuse to the membrane/substrate interface. The process is shown in Fig. 13(c) and (d). When the cation vacancies diffuse to the film/substrate interface, the Cu and Ni atoms at the interface will be oxidized by the dissolved oxygen in the corrosion product film and lose electrons to form Cu+ and Ni2+. Cu+ and Ni2+ are then filled into the cation vacancies and annihilate part of the cation vacancies to form Cu2O and NiO. This process is shown in Fig. 13(d).
XPS results show that the main form of Mn in the passive film is MnO2. Among the 90/10 cupronickel alloys with different Mn content, the corrosion product film of samples with good corrosion resistance also contains more MnO2. Based on the comparison of the relative content of NiO in Fig. 8(b), as can be seen that the more MnO2 in the passive film, the relatively high content of NiO in the passive film, indicating that the addition of an appropriate amount of Mn in the copper-nickel alloy can promote Ni to cations filling of vacancies. The produced NiO is thermodynamically more stable than Cu2O, and Cu+ is easier to dissolve than Ni2+ to form cation vacancies, which increases the stability of the passive film. When the NiO content in the film increases, the cation vacancies in the passive film are reduced, and the ion conductivity and electronic conductivity of the film are reduced, thereby increasing the film resistance and reducing the corrosion rate of the alloy.
Fig. 8(b) and 12(d) show that the corrosion product film of the sample with an Mn content of 0.87% contains a lower content of Cl− and a higher content of MnO2. MnO2 film can effectively prevent Cl− from penetrating to the surface of the substrate.34 The contact between Cl− and the substrate will promote the dissolution of metal ions, and pitting pits will be formed at the high concentration of Cl− in the substrate. According to the pitting corrosion development model, occluded corrosion cells will be formed in the pitting pits, which will accelerate the development of pitting pits into the matrix and accelerate the corrosion process of the alloy, the process is shown in Fig. 13(e).
4 Conclusion
(1) Adding an appropriate amount of Mn to the 90/10 cupronickel alloys can change the corrosion performance of the alloy. With the increase of Mn content, the corrosion resistance of the alloy first increases to a certain value and then decreases.
(2) The Cu2O film formed on the surface of the sample with 0.87Mn content is completely free of gaps, while the surface of the sample with other components is stacked with granular Cu2O, with a loose structure. After removing the passive film, the surface of the sample with 0.87Mn content was flat and smooth, while the surface of other samples had more or less deep or shallow pitting pits.
(3) Mn in the passive film is mainly in the form of MnO2, and the content of MnO2 first increases and then decreases with the increase of Mn content in the 90/10 cupronickel alloys. When the Mn content in the alloy is 0.87%, the MnO2 content reaches the peak. On the contrary, the number of cation vacancies in the passive film will decrease first and then increase with the increase of Mn content. When MnO2 in the passive film is high, it can promote the filling of cation vacancies by Ni, thereby reducing the number of cation vacancies in the film, increasing the resistance to the diffusion of corrosive Cl− in the film, and enhancing the passive film Protection performance.
Author contributions
Zhiyun Zhu: investigation, writing – original draft, Shuhao Li: methodology, writing – review & editing, Rongwei Zhang: writing – review & editing.
Conflicts of interest
The authors declare no financial or commercial conflict of interest.
Acknowledgements
This research was funded by the National Key R&D Program of China (2016YFB0301400, 2016YFB0301401) and the National Natural Science Foundation of China (grant no. 51504104).
References
- A. Drach, et al., Field studies of corrosion behaviour of copper alloys in natural seawater, Corros. Sci., 2013, 76, 453–464 CrossRef CAS.
- K. M. Ismail, A. M. Fathi and W. A. Badawy, The Influence of Ni Content on the Stability of Copper—Nickel Alloys in Alkaline Sulphate Solutions, J. Appl. Electrochem., 2004, 34, 823–831 CrossRef CAS.
- M. S. Parvizi, A. Aladjem and J. E. Castle, Behaviour of 90–10 cupronickel in sea water, Int. Mater. Rev., 2013, 33, 169–200 CrossRef.
- R. F. North and M. J. Pryor, The influence of corrosion product structure on the corrosion rate of Cu-Ni alloys, Corros. Sci., 1970, 10, 297–311 CrossRef CAS.
- R. F. North and M. J. Pryor, The nature of protective films formed on a CuFe alloy, Corros. Sci., 1969, 9, 509–517 CrossRef CAS.
- A. M. Beccaria, et al., Study of passive film formation on Cu–Ni 70/30 alloy in seawater at high temperature, Surf. Interface Anal., 1994, 21, 442–446 CrossRef CAS.
- S. A. Campbell, G. J. W. Radford, C. D. S. Tuck and B. D. Barker, Corrosion and Galvanic Compatibility Studies of a High-Strength Copper-Nickel Alloy, Corrosion, 2002, 58, 57–71 CrossRef CAS.
- X. Zhang, I. O. Wallinder and C. Leygraf, Mechanistic studies of corrosion product flaking on copper and copper-based alloys in marine environments, Corros. Sci., 2014, 85, 15–25 CrossRef CAS.
- A. L. Ma, S. L. Jiang, Y. G. Zheng and W. Ke, Corrosion product film formed on the 90/10 copper-nickel tube in natural seawater: Composition/structure and formation mechanism, Corros. Sci., 2015, 91, 245–261 CrossRef CAS.
- T. Z. Jin, et al., Surface Characterization and Corrosion Behavior of 90/10 Copper-Nickel Alloy in Marine Environment, Materials, 2019, 12(11), 1869 CrossRef CAS PubMed.
- J. J. Cheng, et al., Corrosion and corrosive-wear behaviors of a high strength and toughness Cu-15Ni-8Sn alloy in seawater, Mater. Corros., 2020, 71, 593–607 CrossRef CAS.
- T. J. Glover, Copper–Nickel Alloy for the Construction of Ship and Boat Hulls, Br. Corros. J., 2013, 17, 155–158 CrossRef.
- Y. Shen, et al., Corrosion Resistance of Cu-Ni-Si Alloy Under High-Temperature, High-Pressure H2S and Cl− Environments, J. Mater. Eng. Perform., 2019, 28, 1040–1048 CrossRef CAS.
- M. Gobara, A. Baraka, R. Akid and M. Zorainy, Corrosion protection mechanism of Ce4+/organic inhibitor for AA2024 in 3.5% NaCl, RSC Adv., 2020, 10, 2227–2240 RSC.
- D. C. Kong, et al., Effect of chloride concentration on passive film properties on copper, Corros. Eng., Sci. Technol., 2018, 53, 122–130 CrossRef CAS.
- F. T. Cao, J. Wei, J. H. Dong and W. Ke, The corrosion inhibition effect of phytic acid on 20SiMn steel in simulated carbonated concrete pore solution, Corros. Sci., 2015, 100, 365–376 CrossRef CAS.
- Á. Bacelis, L. Veleva and M. A. Alpuche-Avilés, Copper Corrosion Behavior in Simulated Concrete-Pore Solutions, Metals, 2020, 10(4), 474 CrossRef.
- A. Fattah-alhosseini, M. Naseri, S. O. Gashti, S. Vafaeian and M. K. Keshavarz, Effect of anodic potential on the electrochemical response of passive layers formed on the surface of coarse- and fine-grained pure nickel in borate buffer solutions, Corros. Sci., 2018, 131, 81–93 CrossRef CAS.
- Q. Liu, et al., Enhanced corrosion resistance of AZ91 magnesium alloy through refinement and homogenization of surface microstructure by friction stir processing, Corros. Sci., 2018, 138, 284–296 CrossRef CAS.
- O. O. Ekerenam, A. L. Ma, Y. G. Zheng and W. Emori, Electrochemical Behavior of Three 90Cu-10Ni Tubes from Different Manufacturers After Immersion in 3.5% NaCl Solution, J. Mater. Eng. Perform., 2017, 26, 1701–1716 CrossRef CAS.
- X. Zhu and T. Lei, Characteristics and formation of corrosion product films of 70Cu–30Ni alloy in seawater, Corros. Sci., 2002, 44, 67–79 CrossRef CAS.
- B. G. Prakashaiah, D. V. Kumara, A. A. Pandith, A. N. Shetty and B. E. A. Rani, Corrosion inhibition of 2024-T3 aluminum alloy in 3.5% NaCl by thiosemicarbazone derivatives, Corros. Sci., 2018, 136, 326–338 CrossRef CAS.
- Y. Zheng, et al., Corrosion behaviour of the Al-2.1–Mg-1.8–Si alloy in chloride solution, Bull. Mater. Sci., 2019, 42(5), 228 CrossRef.
- L. Liu, Y. Li and F. H. Wang, Influence of grain size on the corrosion behavior of a Ni-based superalloy nanocrystalline coating in NaCl acidic solution, Electrochim. Acta, 2008, 53, 2453–2462 CrossRef CAS.
- L. Pan, et al., Cu2O Film via Hydrothermal Redox Approach: Morphology and Photocatalytic Performance, J. Phys. Chem. C, 2014, 118, 16335–16343 CrossRef CAS.
- Y. Shang, S. Xiao, X. Qiu and Y. Wei, Influence of Cr on the electronic properties of passive film on B30 alloy in NaOH solution, Chem. Res. Chin. Univ., 2015, 31, 603–610 CrossRef CAS.
- S. N. Saud, et al., Effects of Mn Additions on the Structure, Mechanical Properties, and Corrosion Behavior of Cu-Al-Ni Shape Memory Alloys, J. Mater. Eng. Perform., 2014, 23, 3620–3629 CrossRef CAS.
- W. Wu, X. Q. Cheng, H. X. Hou, B. Liu and X. G. Li, Insight into the product film formed on Ni-advanced weathering steel in a tropical marine atmosphere, Appl. Surf. Sci., 2018, 436, 80–89 CrossRef CAS.
- C. Lu, et al., Investigation on the composition and corrosion resistance of cerium-based conversion treatment by alkaline methods on aluminum alloy 6063, RSC Adv., 2020, 10, 36654–36666 RSC.
- R. Zhang, Corrosion characteristic of Cu-10Ni-Fex in 3.5% NaCl, Int. J. Electrochem. Sci., 2018, 11526–11538 CrossRef CAS.
- H. Nady, N. H. Helal, M. M. El-Rabiee and W. A. Badawy, The role of Ni content on the stability of Cu-Al-Ni ternary alloy in neutral chloride solutions, Mater. Chem. Phys., 2012, 134, 945–950 CrossRef CAS.
- D. D. Macdonald, The history of the Point Defect Model for the passive state: A brief review of film growth aspects, Electrochim. Acta, 2011, 56, 1761–1772 CrossRef CAS.
- N. Sato, 1989 Whitney Award Lecture: Toward a More Fundamental Understanding of Corrosion Processes. Corrosion-Us, ( 1989) Search PubMed.
- D. H. Cho, B. W. Lee, J. Y. Park, K. M. Cho and I. M. Park, Effect of Mn addition on corrosion properties of biodegradable Mg-4Zn-0.5Ca-xMn alloys, J. Alloys Compd., 2017, 695, 1166–1174 CrossRef CAS.
|
| This journal is © The Royal Society of Chemistry 2021 |
Click here to see how this site uses Cookies. View our privacy policy here. 
 Open Access Article
 This Open Access Article is licensed under a Creative Commons Attribution-Non Commercial 3.0 Unported Licence
 and
Rongwei Zhang
and
Rongwei Zhang


 and a corresponding number of electron holes (h, produced to maintain the electrical neutrality of the film), which will reduce the Cu2O lattice constant. With the progress of the corrosion process, the concentration of cation vacancies on the passive film gradually increases, and the driving force for diffusion into the film is generated, so that the cation vacancies diffuse to the membrane/substrate interface. The process is shown in Fig. 13(c) and (d). When the cation vacancies diffuse to the film/substrate interface, the Cu and Ni atoms at the interface will be oxidized by the dissolved oxygen in the corrosion product film and lose electrons to form Cu+ and Ni2+. Cu+ and Ni2+ are then filled into the cation vacancies and annihilate part of the cation vacancies to form Cu2O and NiO. This process is shown in Fig. 13(d).