
 Open Access Article
 This Open Access Article is licensed under a Creative Commons Attribution-Non Commercial 3.0 Unported Licence
Silver nanoparticle on zinc oxide array for label-free detection of opioids through surface-enhanced raman spectroscopy
Michael Zhang†
a,
Congran Jin† a,
Yuan Niea,
Yundong Rena,
Nanjing Haoa,
Zhe Xua,
Lin Dongb and
John X. J. Zhang*a
a,
Yuan Niea,
Yundong Rena,
Nanjing Haoa,
Zhe Xua,
Lin Dongb and
John X. J. Zhang*a
aThayer School of Engineering at Dartmouth College, Hanover, NH, USA. E-mail: john.zhang@dartmouth.edu
bMechanical and Industrial Engineering, New Jersey Institute of Technology, Newark, NJ, USA
First published on 17th March 2021
Abstract
Opioid abuse is a significant public health problem. Over two million Americans have some form of addiction to opioids; however, despite governmental programs established to treat overdoses and restrict opioid distribution, there are still few screening tools that are quantitative, portable and easy to use for high-throughput mapping and monitoring this ongoing crisis. In this paper, we demonstrated a plasmonic zinc oxide (ZnO) arrays-on-silicon sensor for the label-free detection of opioids through surface-enhanced Raman spectroscopy (SERS), and evaluated the chips' opioid sensing performance. Specifically, we tested our device with oxycodone, a potent and commonly abused opioid, dissolved in methanol and blood serum as a proof-of-concept study. Ag particles were in situ patterned onto the ZnO array to form the completed sensing platform. The resulting Ag@ZnO arrays were characterized using Scanning Electron Microscopy (SEM), Energy Dispersive X-ray Analysis (EDS), and element mapping. In addition, the enhanced electric field induced by the localized surface plasmonic resonance at the Ag particle decorated ZnO is simulated using COMSOL. Opioid-containing samples at varying concentrations, from 900 μg mL−1 to 90 ng mL−1 were tested using SERS to characterize the chip's accuracy and sensitivity. We demonstrated that the sensor can reliably detect opioid concentrations as low as 90 ng mL−1 with great accuracy and sensitivity even spiked into blood serum. The chips could provide a cost-effective, high-throughput method for detecting opiate oxycodone, thereby providing a powerful tool to monitor and control the emerging public health threats.
1 Introduction
The opioid crisis has posed major challenges for communities across America and the world for decades. For example, oxycodone, one of the most abused opioids, caused an average of 5526 deaths every year from year 2011 to 2016.1 Despite current attempts to cure the adverse impacts of opioid abuse and overdoses as they appear, there are still few tools available to map and understand this ongoing epidemic. For opioid substance detection, there are two existing commercially available techniques, namely the immunoassays and gas chromatography-mass spectrometry (GC-MS).2,3 The working mechanism of the immunoassay method is to utilize the change in enzyme activity when a specific antibody binds the drug, and the enzyme activity is measured using spectrophotometry. However, most immunoassays have a poor reaction to opiate substances like oxycodone and oxymorphone and may lead to false-negative results.4,5 The GC-MS method works by first separating the sample mixture through heating and flow of gas, then the MS identifies the individual substance by measuring and comparing the mass of the molecule. This method provides more accurate results, but the technique is costly, requiring a time-consuming and laborious sample preparation procedure which can take up to 24 hours.4 In recent years, Surface-Enhanced Raman Spectroscopy (SERS) has become a popular method of detecting trace amounts of chemical compounds, especially drugs,6–15 due to its ability to enhance the Raman scattering signals of detection targets with high sensitivity, rapid detection time, and non-destructive analysis method.16,17 For example, Masterson et al.9 developed a flexible SERS patch with chemically functionalized Au triangular prisms for detecting highly potent drugs. However, a limitation of many current SERS based opioid detecting devices is that they have not been tested using real blood samples, which is an important step for verifying the device's performance in practical settings for detecting the drug use in people.6–8,10–12,14,15,18 In addition, these current SERS based sensor of opioid can only detect opioid with a concentration as low as several hundred nanograms per milliliter or even higher. For example, while Shende et al.13 have tested the drugs in blood, their experimental detection limit is 500 ng mL−1 which is too large for detecting trace amount. Another challenge in many SERS applications is the selection of a highly efficient plasmonic enhancement substance and the optimization of the detection substrate design. In particular, noble metals are usually the material of choice for SERS platforms due to their desirable plasmonic properties, which allows for enhancing Raman signals when stimulated electromagnetically via localized surface plasmon resonance (LSPR).19 Specifically, interactions between the electron clouds of nanoscale conductive particles and relatively larger electromagnetic waves result in regular oscillations of the particle's electrons, creating an evanescent conduction band in which the electromagnetic wave is trapped. This conduction band creates an amplification effect for many spectroscopic methods that measure a substrate's scattering properties, making it particularly useful in SERS applications.20Many of research of suitable LSPR materials for SERS has been centered around gold due to its relative biocompatibility.21–25 However, these advantages of gold come at the immensely higher production costs. Furthermore, Ag has higher electrical and thermal conductivity, making it a more efficient and cost-effective plasmonic material for use in spectroscopic enhancement, and as a result it has been widely used for SERS based measurement.19,26–39 Therefore, Ag is a superior surface-coated noble metal for SERS sensor platforms. Popular SERS sensor platform designs include the use of colloids nanospheres, nanorods and, or more complex 3D structures such as arrays, nanotrees, nanoflowers, or even butterfly-inspired structures.32,40–42 In particular, the category of novel 3D designs has become a topic of interest due to their ability to increase the platform surface area significantly, therefore allowing for a higher density of coated plasmonic materials. This allows for “hotspots” of plasmonic enhancement, enabling highly reproducible, sensitive, and specific molecular sensing. Zinc oxide (ZnO) has emerged as a popular platform synthesis material due to its biosafety, versatility and low-cost manufacturing. In addition, its excellent optoelectronic and electrochemical properties have enabled various sensing and biomedical engineering applications.43,44 ZnO array has been widely used to provide the platform for SERS-based sensing of various substances as it offers a higher reproducibility and stability,35 larger surface-to-volume ratio27 and a 3D platform.30
In this study, we utilized a custom two-step hydrothermal growth and ultraviolet (UV) irradiation protocol to synthesize Ag particles decorated ZnO arrays on a silicon chip. These particles contribute to the local surface plasmonic effect and an increase in Ag SERS enhancement “hotspots”. This chip has superior testing capability which can measure a low oxycodone concentration of 90 ng mL−1. The system of the Ag nanoparticles decorated ZnO array on a chip is the first of its kind that serve as a portable, cost-effective, timely, sensitive and highly specific SERS sensor for the detection of dissolved opioid substances at a low concentration which has the potential to be used in many healthcare applications in the drug abuse crisis.
2 Experimental
2.1 Materials and reagents
Zinc acetate ((CH3CO2)2Zn, 99.99%), zinc nitrate hexahydrate (Zn (NO3)2·6H2O, 98.0%), hexamethylenetetramine (C6H12N4, HMTA, ≥99.0%), silver nitrate powder (AgNO3, ≥99.0%) and 1 mg mL−1 oxycodone solution (item id O-002-1ML) are purchased from Sigma Aldrich. Deionized (DI) water is from a Milli-Q water ultrapure water purification system. The silicon wafer (〈1 0 0〉, single-side-polished) is purchased from Wafer University.2.2 Chip fabrication
The fabrication process of the Ag particle decorated ZnO array chip is summarized as the following. First, a piece of Si wafer is cut into an approximately 2 cm by 2 cm square and is washed by deionized (DI) water and treated by oxygen plasma. Next, thermal treatment decomposes zinc acetate into ZnO nanocrystals as seeds on the Si substrate for the following synthesis of vertically aligned ZnO array. The vertically aligned ZnO array growth method is adapted from previously reported experiments.45,46 Specifically, the substrate is covered by a layer of 5 mM zinc acetate solution (in DI water) and then transferred into an oven at 180 °C for 40 min for thermal decomposition of the zinc acetate to create ZnO seeds on the substrate. Then, zinc nitrate hexahydrate (75 mM) and HMTA (50 mM) are added to 45 mL of DI water followed by sonication for 5 min to provide the hydrothermal growth solution. Then, the seeded substrate is then placed in the growth solution with the seeded side facing downward in a beaker which is covered by aluminum foil and placed in an oven for 3 hours at a temperature of 88 °C. This growth cycle with newly made growth solution is repeated 6 times to grow vertical ZnO wire of ∼12 μm in height. Next, the chip is rinsed with DI water to remove ZnO residuals and dried in an oven at 50 °C. Lastly, UV irradiation method is employed to generate the Ag particles on top of the ZnO array. The as fabricated chip is immersed in a 5 mM AgNO3 solution (in DI water) and irradiated under a UV lamp (∼30 W m−2 intensity) for one hour. The finished chip was then washed with DI water to remove excess product and dried at room temperature. All reagents in the synthesis were purchased from Sigma Aldrich.2.3 SEM and EDS characterization
The scanning electron microscopy (SEM) was performed on a FEI Helios 5CX dual beam scanning electron microscope operating at 5 kV. The energy-dispersive X-ray spectroscopic (EDS) measurements and the chemical mapping were performed with the SDD X-ray detector (Ametek®) attached to the TESCAN Vega3 scanning electron microscope operating at 30 kV.2.4 Oxycodone detection using SERS measurement
The 1 mg mL−1 oxycodone solution was diluted into 500 μg mL−1, 10 μg mL−1, 1 μg mL−1, and 100 ng mL−1 solutions. Each concentration had three replicates. Then ∼5 μL of each sample was pipetted onto the prepared silver particles decorated ZnO (Ag@ZnO) array substrates. A He-Ne laser beam (power = 10 mW, wavelength = 532 nm) was focused onto the substrate through a Raman spectrometer (Horiba labRAM Raman/AIST-NT AFM). The Raman signals of oxycodone were collected by an air-cooled open electrode 1024 × 256 pixel CCD detector. A standard silicon substrate was applied for calibration before all the measurements and its spectra was used for background correction. For the blood sample oxycodone detection test, de-identified patient serum samples were used, and they were obtained from Dartmouth-Hitchcock Medical Center (Lebanon, NH, USA). All samples were handled according to Dartmouth's Environmental Health and Safety and BSL-2 protocols. Blood serum sample were kept in a freezer before the test. The oxycodone solution was added to the raw blood serum that was diluted 100 times with phosphate buffered saline (PBS, Sigma Aldrich) in the serum samples to obtain 900 μg mL−1, 90 μg mL−1, 9 μg mL−1, 900 ng mL−1 and 90 ng mL−1. For each concentration, measurements at 5 different locations selected randomly on the chip were carried out with point scan of the Raman spectroscopy. The Raman measurement and parameters are identical to the previous test.3 Results and discussion
In this project, we designed and fabricated zinc oxide (ZnO) arrays on silicon (Si) wafers for the label-free and sensitive detection of opioids. ZnO has become popular in biosensor applications due to its excellent electrochemical and optoelectronic properties, low-cost manufacturing, versatility, and relative eco-friendliness. In this study, we fabricated silver (Ag) particles decorated ZnO arrays on silicon (Si) wafers and utilized them as portable, label-free, and efficient surface-enhanced Raman spectroscopy (SERS)-based sensors. These chips were fabricated via a three-step fabrication process containing a ZnO seeding, hydrothermal growth of the vertically aligned ZnO array and a UV irradiation of the Ag particles. The summarized fabrication process and the schematic of the silver particles decorated ZnO array (Ag@ZnO) chip are depicted in Fig. 1. The ZnO array provides a 3 dimensional (3D) substrate for the Ag particles and the effectiveness of such 3D structure for SERS based sensing has been proven by previous works.47–49 The high electromagnetic enhancement factor induced by the 3D ZnO array structure mainly stems from the high surface area to volume ratio that allows for a much higher load of metal particles. Other advantages of ZnO arrays include their inability to absorb visible light, high controllability over size and dimensions, stability in regular environment, and suitability for mass production.48 In addition, the enhancement effect may also be contributed by plasmonic resonance due to the coupling of the incident light to the surface plasmons enabled by the pathways formed in the small gaps between the ZnO rods.50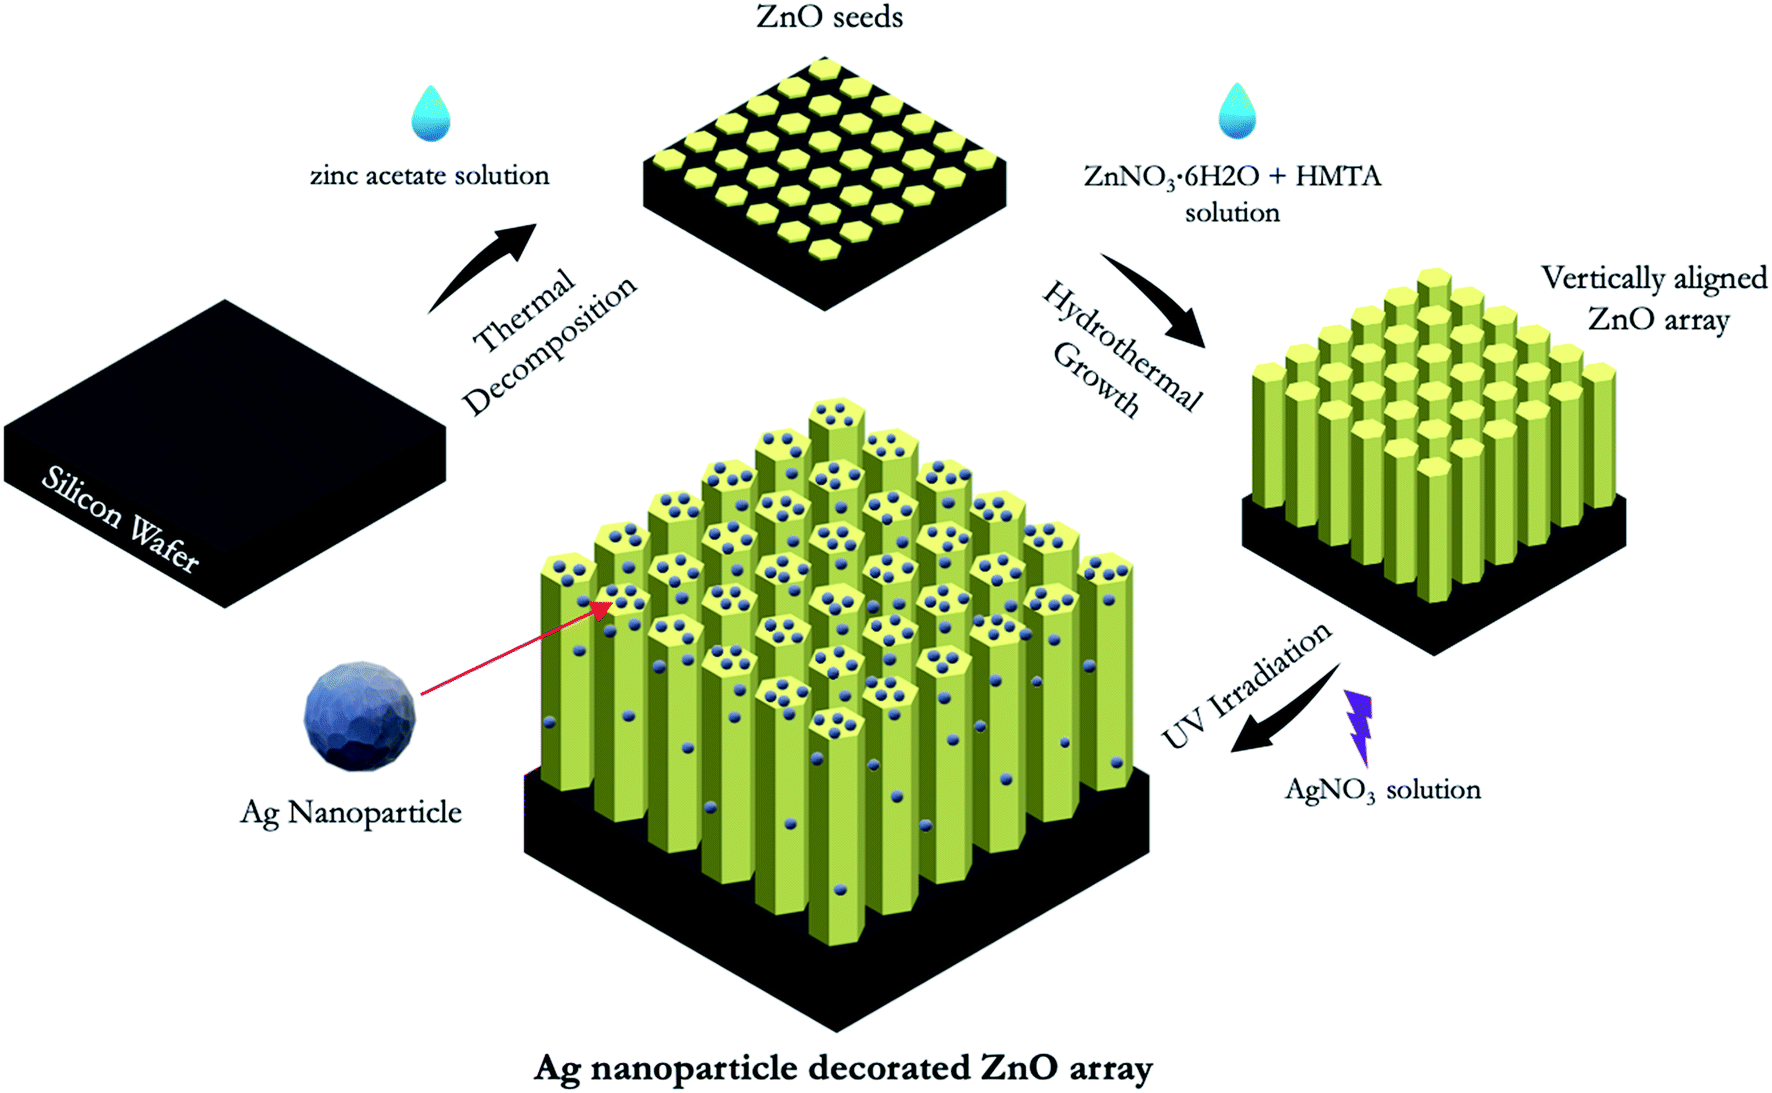 | ||
| Fig. 1 Schematic of the Ag@ZnO chip and its fabrication process. | ||
The as-fabricated chip was then characterized by EDS (Fig. 2). Fig. 2A shows the top view of the chip where Ag particles are distributed on the top surface of the ZnO rods. Fig. 2B is a zoom-in image that shows the hexagonal cross section of a ZnO rod with Ag particles on the top surface. The Ag particles can also be seen on the side wall of ZnO rods as shown in Fig. 2C. From the SEM images, it is confirmed that Ag particles are placed on both the top surface and the side wall of the ZnO array. The average width of the cross section of the ZnO rod is approximately 2 ± 0.3 μm, and the size range of the Ag particles is approximately 50–200 nm in diameter. Fig. 2D shows the cross-section view of the chip, and the height is approximately 14 μm. The EDS spectrum confirming the existence of the element Ag, Zn, O and Si at their corresponding characteristic energy is shown in Fig. 2E. The Ag element has its characteristic energies at 2.98 and 3.15 keV; Zn element has the characteristic energy at 1.01 and 8.64 keV; O has its characteristic energy at 0.52 keV; Si's characteristic energy is at 1.74 keV. Fig. 2F and G are the chemical mapping of the element Ag and Zn, respectively. It is confirmed that the vertical ZnO rod and the Ag particles are uniformly distributed on the chip. In addition, Fig. 2H is the combined chemical mapping of both element Ag and Zn, indicating that the Ag particles are uniformly distributed on the ZnO array. The Ag particle content in terms of atomic ratio and weight ratio are 3.12% and 6.96%, respectively.
 | ||
| Fig. 2 Material characterization of the Ag@ZnO chip. (A) The SEM image of the top view of the chip. (B) A zoom-in image showing Ag particles on the top of a ZnO rod. (C) A zoom-in image showing Ag particles on the side wall of a ZnO rod. (D) The cross-section view showing the vertically aligned ZnO microarray. (E) The X-ray energy spectrum of the chip showing elements Zn, O, Ag and Si. (F) The EDS chemical mapping of the element Ag and (G) element Zn. (H) The combined EDS mapping of elements Ag and Zn confirming a relatively uniform dispersion of Ag particles on the ZnO microarray. | ||
Prior to the experimental Raman tests, we simulated the localized surface plasmonic resonance effect using a simplified model using finite element method (FEM) in COMSOL. Fig. 3A shows the schematic of the simulation model. There are two scenarios of the particle placement. The first is a single Ag particle with 100 nm dimeter that was positioned at the center of a ZnO plate. The second is a pair of Ag particles of the different sizes, i.e., 50, 100 and 100 nm diameter, with an inter-particle distance of 50, 100 and 150 nm. We expected that a “hot spot” where a strong localized enhancement occur exists between two particles that are in a close proximity according to literature.34,35 The input excitation light was polarized along the long axis of the silver particle as shown in the figure and the electrical field was aligned with the two particles in the second scenario. Fig. 3B shows the plot of the extinction cross-sections area, i.e., the sum of scattering and absorption cross-section area, of the silver particle at different wavelengths from 450 nm to 700 nm. The value of the extinction cross-section area reflects the local plasmonic enhancement effect of the particles. In the simulation, there are three pairs of Ag particles that are 100 nm in diameter and with an inter-particle distance of 50, 100 and 150 nm. As shown in the plot, the peaks of the extinction cross-section area for all particle arrangements fall in the range of 500–550 nm (highlight be the grey area in Fig. 3B), which correspond to the localized plasmon resonance wavelength of these particle arrangements. It is shown that Ag particle pairs induce a greater extinction cross-section area across the entire wavelength range than a single Ag particle. This can be explained by the “hot spot” effect that is created between two Ag particles that are adjacent to each other with a short inter-particle distance. Fig. 3C shows the 2D and 3D simulation models of the localized surface plasmon enabled electrical field enhancement (indicated by the color contour) of the Ag particles decorated on a ZnO platform excited by a light of wavelength 540 nm. In this set of simulations, Ag particle pairs with 50, 100 and 150 nm particle diameter and 50, 100 and 150 nm inter-particle distance as well as a single particle of 100 nm diameter are tested. In Fig. 3C, when two Ag particles are closer to each other (e.g., 50 nm separation), a “hot spot” will form in the gap between them, as indicated by the enhanced electrical field represented by the green, yellow and red color that bridging the two particles. On the other hand, as the particles moves farther apart from each other, as in the 100 and 150 nm separation case, the “hot spot” effect between them diminishes and vanishes eventually. Yet, the electromagnetic enhancement effect can also occur at a single Ag particle, as seen from all particle arrangements in the simulation, especially the single Ag particle one and the ones with the Ag particle pairs farther apart (e.g., 150 nm inter-particle distance). Therefore, even individual Ag particles or ones that are very far apart from each other can have an increased local plasmonic effect as a result of coupling of electromagnetic of the Ag particle and the ZnO substrate. The plot in Fig. 3D quantitatively summarizes the simulation result. It is shown that the 100 nm diameter particles have the greatest normalized extinction cross-section area or greatest enhancement effect than the 50 and 150 nm diameter ones. Here, the normalized value is defined by the extinction cross-section area divided by the total surface area of the particles. In addition, for the 100 nm diameter cases, the particle pairs have a stronger enhancement effect than the single particle scenario. It is shown that at the resonance wavelength of 550 nm, the light excited local electric field has the greatest intensity compared to those of 470 and 650 nm wavelength. Further, we observed that the highest intensity occurs at the Ag–ZnO interface for all cases and at the side of the particles that is facing each other in two-particle cases from which a “hot spot” is created. Overall, the simulation results demonstrated that a “hot spot” can occur when two Ag particles are close to each other and that local enhancement also occur between the Ag particle and the ZnO substrate. In either case, the Ag particle shows the greatest intensity of the light–matter interaction at its vicinity that can significantly enhance the Raman signal.
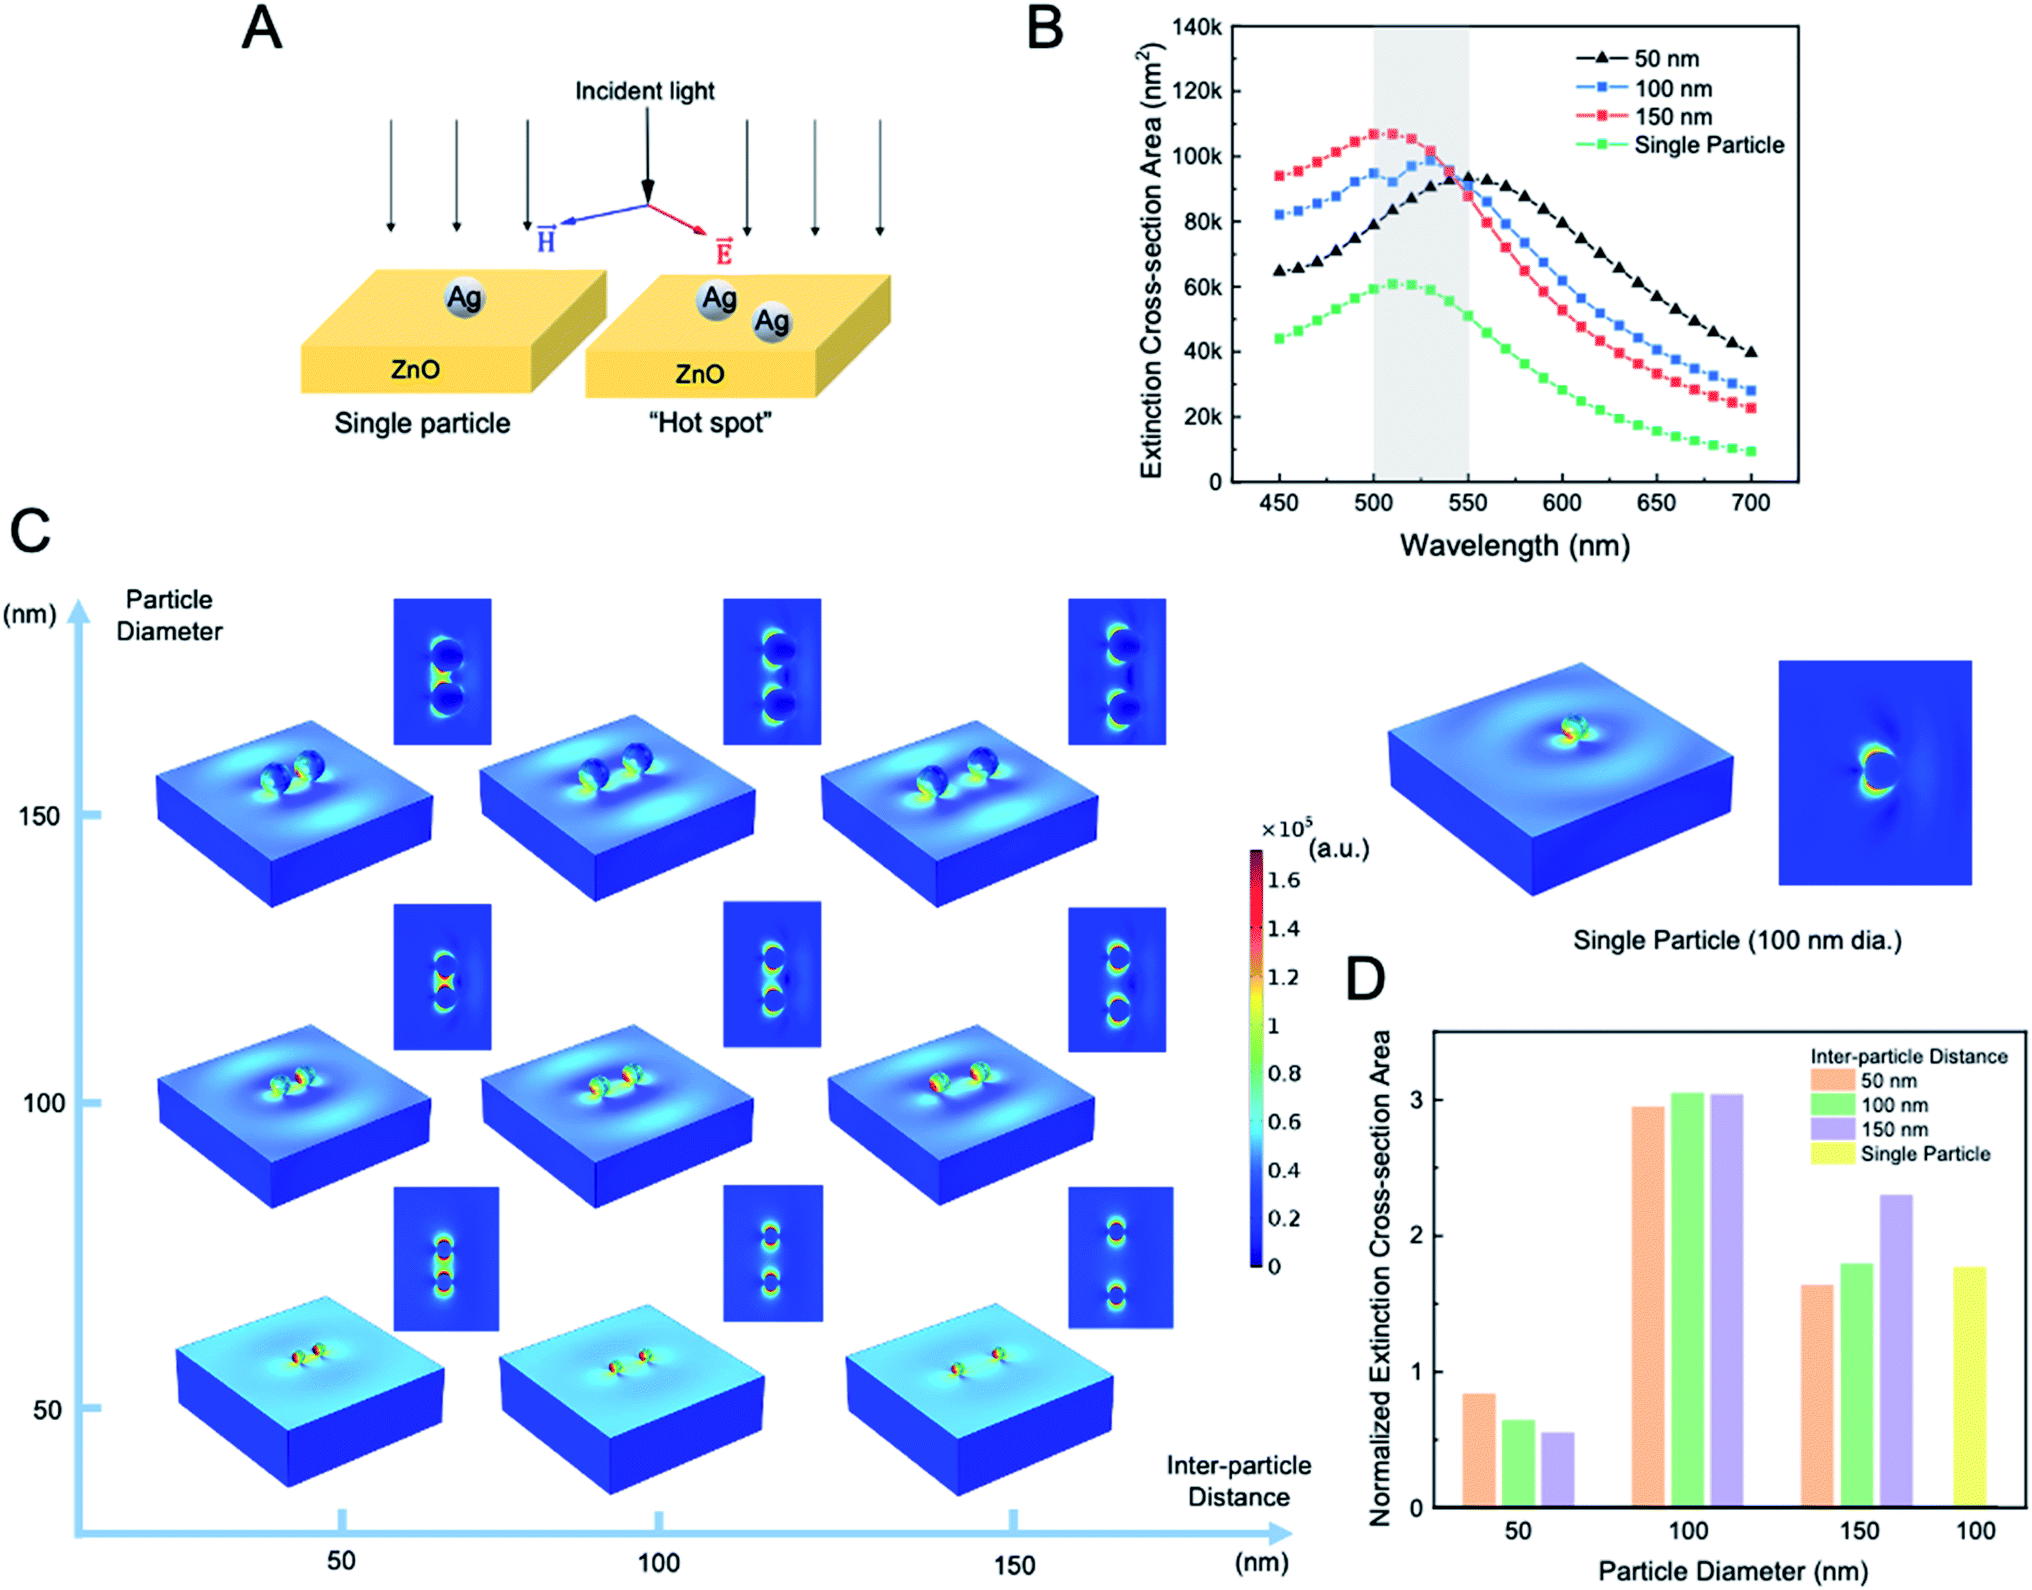 | ||
| Fig. 3 Simulation of the localized surface plasmon enabled electrical field enhancement of the Ag particle decorated ZnO. (A) The schematic of the model including two scenarios: a single particle and a pair of particles close to each other. (B) The extinction cross-section area of the Ag particle(s) of 100 nm in diameter in a wavelength range from 450 nm to 700 nm. The grey area highlights the range of peaks of all particle arrangements. (C) The simulated 3D model and the cross-sectional mapping showing the electric intensity of the Ag particle(s) excited by a light of 540 nm wavelength. The color bar represents electric field intensity. (D) The normalized extinction cross-section area of the Ag particle pairs with 50, 100 and 150 nm diameters and with 50, 100 and 150 nm inter-particle distances and of a single Ag particle. | ||
Next, in order to verify the viability of the chips' opioid sensing function, a quick test was performed on commercially available opioid-containing solutions before a more practical and systematic clinical study using human blood. Specifically, we tested our device using a solution containing oxycodone, a potent and commonly abused opioid, dissolved in methanol as a quick feasibility study. Opioid-containing solutions at varying concentrations were tested using the as-fabricated chip as a platform for label-free SERS-based detection of oxycodone whose chemical structure is shown in Fig. 4A. 5 μL solutions containing oxycodone dissolved in methanol were dropped onto the chip placed under the objective lens of a Raman spectrometer, the substrate was exposed to a focused laser with a wavelength of 532 nm which is determined from the simulation that shows a resonance at 550–560 nm where the simulated signal is at its highest level (Fig. 3B). Oxycodone concentrations of 500 μg mL−1, 10 μg mL−1, 1 μg mL−1 and 100 ng mL−1 showed the highest characteristic peaks in the Raman spectroscopy with a common baseline at around 1360 cm−1 and 1590 cm−1 (Fig. 4B) which agree with the recently reported values.51,52 The ∼1360 cm−1 band is attributed to the stretching CC bond in ring C, the bending CH bond, and the wagging CH2 bond in ring B, while the ∼1590 cm−1 band is attributed to the stretching CC bond in ring C, the wagging CH2 bond in ring B.53 In addition, pure methanol was measured under the same test condition as a control group and showed no peaks at around 1360 cm−1 and 1590 cm−1 compared to the 100 ng mL−1 concentration of oxycodone as shown in Fig. 4C. Note that, for the 100 ng mL−1 oxycodone solution, although signal noise is present due to a low intensity of signal, the 1360 cm−1 and 1590 cm−1 peaks are still distinguishable. Furthermore, the signal intensity of the Raman spectroscopy for both peaks are plotted at each of the oxycodone concentration (Fig. 4D). It is shown that the Raman signal intensity increases as oxycodone concentration increases, and it is a near-linear relationship in the logarithmic scale plot as indicated by the linear fit curve with an R2 value being 0.957 and 0.938 for the 1360 cm−1 and 1590 cm−1 characteristic peaks, respectively. All these Raman curves for different concentrations share the same Raman shift locations for each of the corresponding peaks, proving the excellent repeatability of the test on the Ag@ZnO chip. From this test, it is demonstrated that the Ag@ZnO chips could provide a high-throughput method for mapping detailed patterns of oxycodone to a large range of concentration from 500 μg mL−1 to 100 ng mL−1, thereby leading to the next more practical, clinical trial using human blood serum.
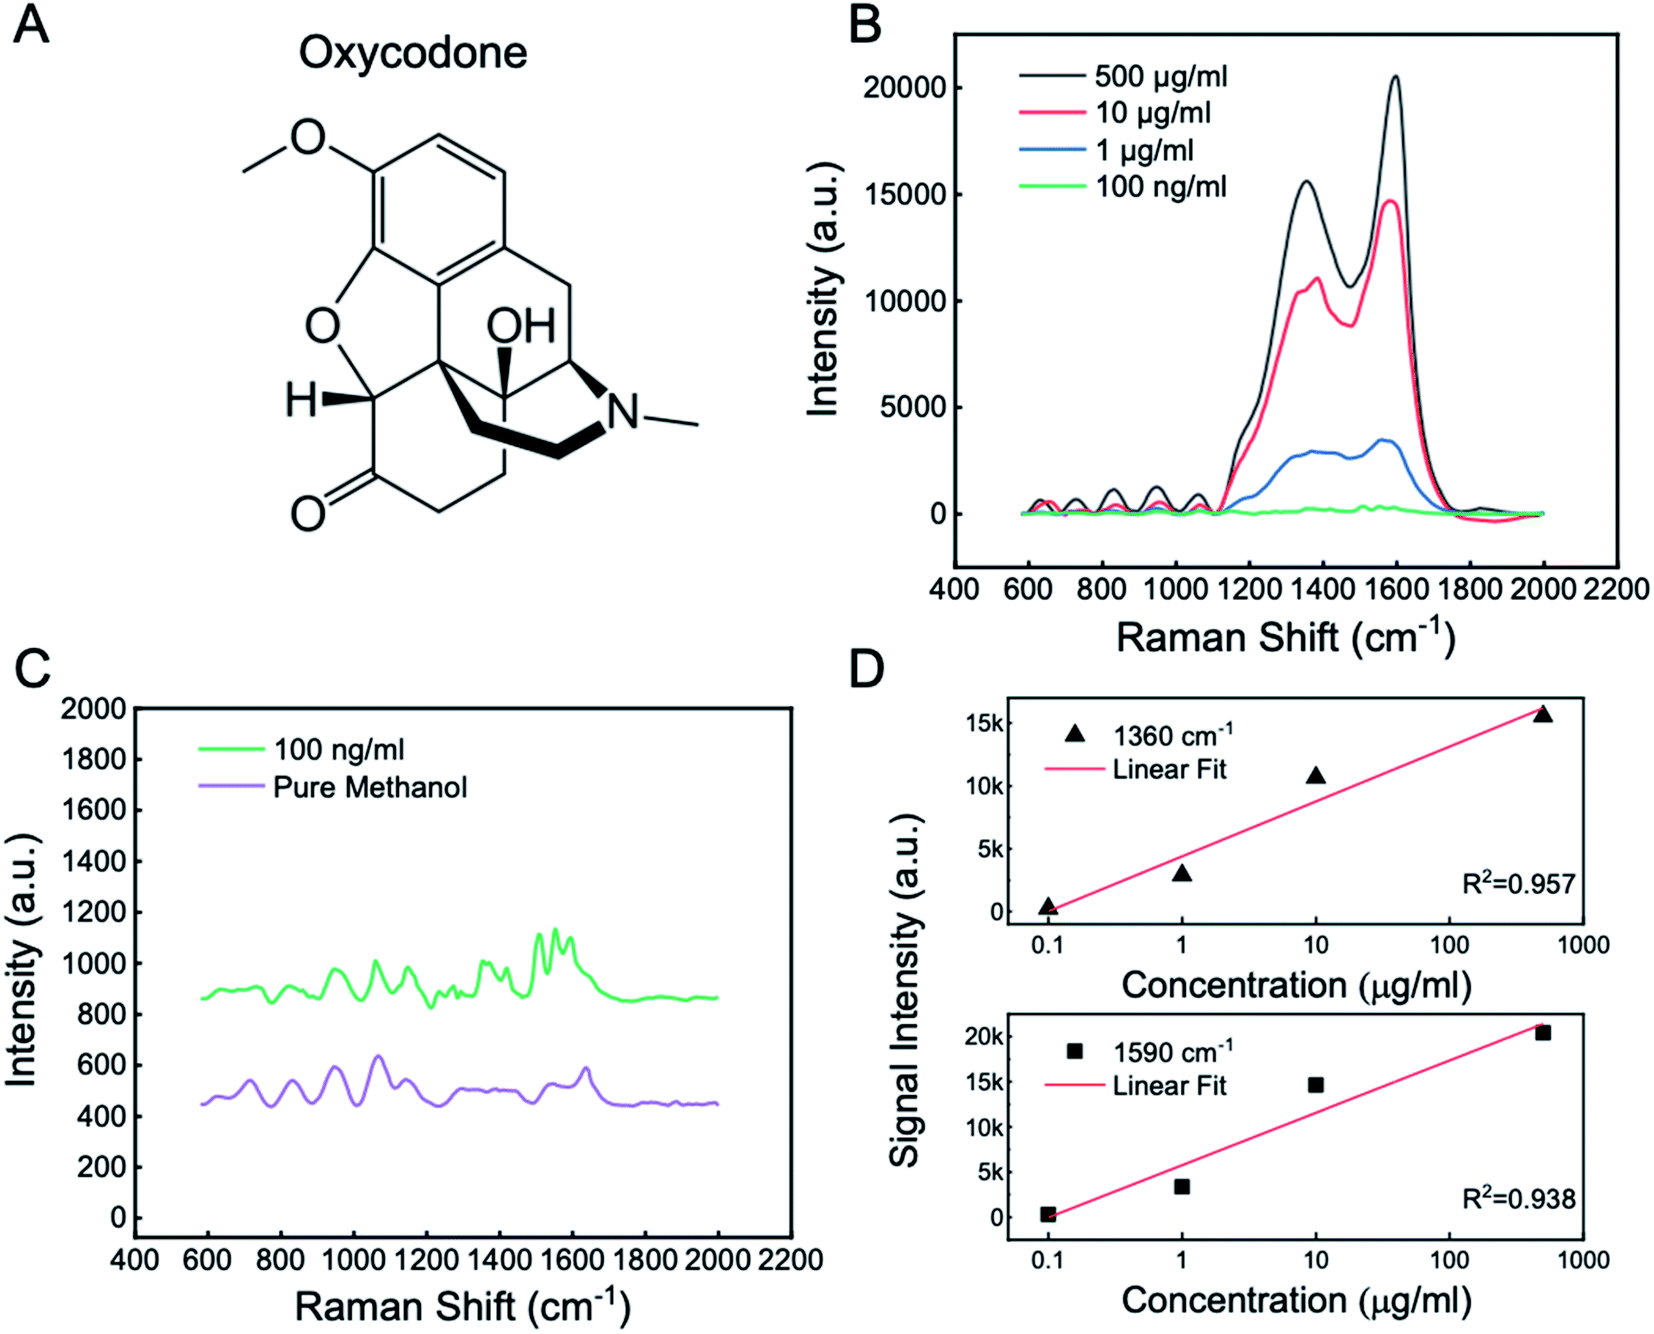 | ||
| Fig. 4 Measured SERS signal for varying oxycodone concentrations. (A) The chemical structure of oxycodone. (B) The SERS signal from tested oxycodone solutions with oxycodone concentrations of 500 μg mL−1,10 μg mL−1, 1 μg mL−1, and 100 ng mL−1, and pure methanol with a common baseline. (C) Comparison of the SERS peaks of the 100 ng mL−1 oxycodone solution and the pure methanol. (D) The signal intensity of the Raman spectroscopy of the 1360 nm peak and the 1590 nm peak showing a near-linear relationship with the oxycodone concentration in the logarithmic scale plot. | ||
Lastly, after the viability of the chips' opioid sensing function was verified through a quick proof-of-concept test using commercially available opioid-containing solution, we performed a more practical clinical study using human blood serum samples. Specifically, we tested the Ag@ZnO array chip with serum samples containing oxycodone with five different concentrations, that is, 900 μg mL−1, 90 μg mL−1, 9 μg mL−1 900 ng mL−1 and 90 ng mL−1. The preparation of the serum sample and the experimental method are detailed in the Experimental section. Like the previous test, these samples were tested using the as-fabricated chip as a platform for label-free SERS-based technique, and the same Raman settings and parameters were used for this test. Fig. 5A–E show the Raman signal spectrum for each oxycodone concentration of 900 μg mL−1, 90 μg mL−1, 9 μg mL−1, 900 ng mL−1 and 90 ng mL−1, respectively. All spectrums show the highest characteristic peaks at around 1360 cm−1 and 1590 cm−1 which agree with the previous test (Fig. 4B) and recently reported values.51,52 Again, the ∼1360 cm−1 band is attributed to the stretching C–C bond in ring C, the bending C–H bond, and the wagging –CH2 bond in ring B, while the ∼1590 cm−1 band is attributed to the stretching C–C bond in ring C, the wagging –CH2 bond in ring B of the oxycodone molecule.53 It is worth noting that even the lowest oxycodone concentration, 90 ng mL−1, clearly shows the distinctive characteristic peaks, demonstrating a superb detection ability at his low concentration which is on the same level of the lowest concentration reported by literature using immunoassay and GC-MS method (i.e., 10 ng mL−1).4,54 Yet, compared with these two testing strategies, the testing method presented in this work using SERS technique with the Ag@ZnO nanochip is less laborious, time-consuming, and expensive. From applying the serum sample to the chip to reading a reliable, meaningful result, it only takes less than 10 minutes. Further, the Raman signal from each oxycodone concentration is summarized in Fig. 5F with a common baseline for comparison purpose. All Raman spectrums share the same 1360 cm−1 and 1590 cm−1 characteristic peaks of oxycodone and their signal intensity decreases as the oxycodone concentration decreases. To show the relationship between the signal strength and the concentration, the intensity of the Raman spectroscopy of at 1360 cm−1 and 1590 cm−1 characteristic peaks are plotted at each of the oxycodone concentration (Fig. 5G and H). For both peaks, the Raman signal intensity increases as oxycodone concentration increases. The linear regression model shows a positive linear relationship between the oxycodone concentration and the signal intensity (in the logarithmic scale plot) with an R2 being 0.959 and 0.968 for the 1360 cm−1 and 1590 cm−1 characteristic peaks, respectively, exhibiting a good sensitivity of this detection technique. From this test with blood serum samples, it is demonstrated that the Ag@ZnO chips and the SERS technique provide a high-throughput method for detecting the opiate substance oxycodone by identifying its characteristic peaks for a large range of concentrations (from 900 μg mL−1 to 90 ng mL−1) and with excellent accuracy and sensitivity.
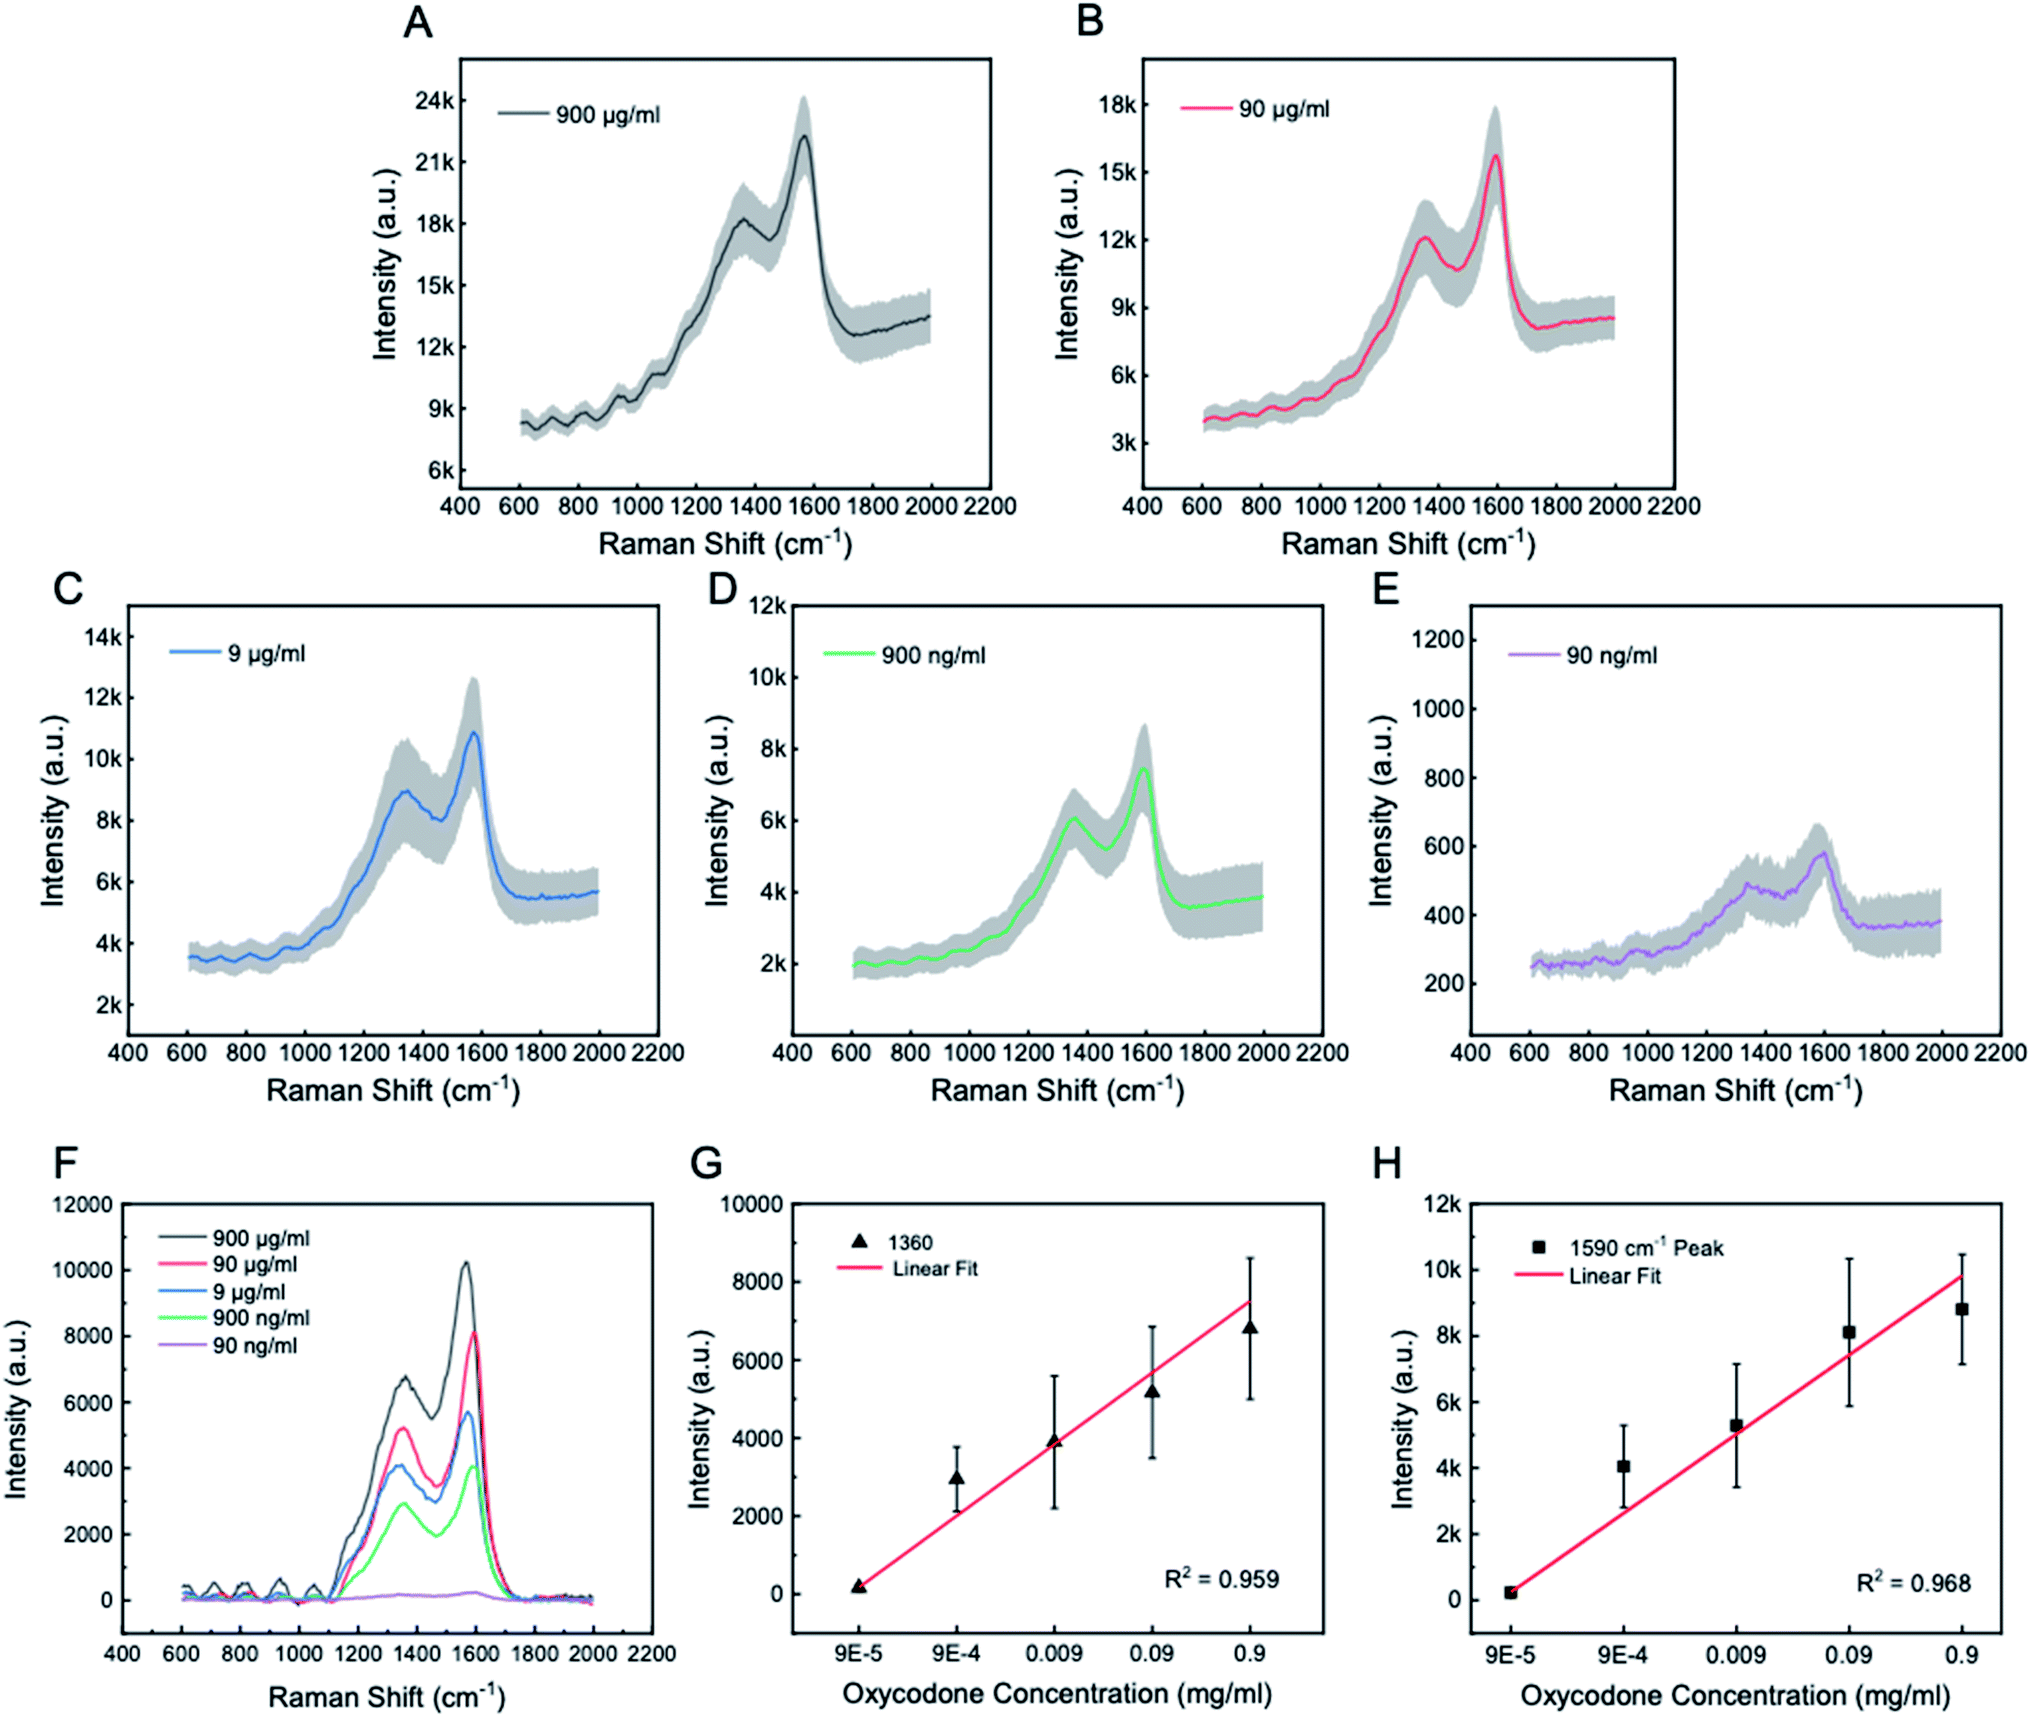 | ||
| Fig. 5 SERS signals from five blood serum samples with different oxycodone concentrations. The individual SERS signal with oxycodone concentrations of (A) 900 μg mL−1, (B) 90 μg mL−1, (C) 9 μg mL−1, (D) 900 ng mL−1 and (E) 90 ng mL−1 with error bars (the shaded area). (F) Comparison of the SERS signals of all oxycodone concentrations with a common baseline. (G) The signal intensity versus oxycodone concentrations at the characteristic peaks at 1360 cm−1 and (H) 1590 cm−1 (error bars represent standard deviation of data points). | ||
The SERS based enhancement is attributed primarily to two underlying mechanisms, namely, the electromagnetic mechanism and the chemical mechanism. The former is associated with the localized surface plasmonic resonance and the resulted enhanced electric field and light–matter interaction. The latter is based on the resonance of the incident photon energy and charge transfers. The electromagnetic mechanism is the dominating mechanism as its enhancement is several orders of magnitude larger than that of the chemical mechanism.33 Furthermore, in this work, there are a number of factors that determines the magnitude of the SERS enhancement including the intrinsic properties of the decorated Ag particles and ZnO, the size of the particles and the interparticle distance. The gap between two close Ag particles will create a “hot spots” which contribute to a significant SERS enhancement and it is believed that the shorter the interparticle distance, the larger the enhancement.35 In addition, although the Ag particles are randomly distributed, their fabrication and deposition parameters (e.g., silver nitrate concentration, UV intensity, exposure time) can be precisely controlled so that the density and size of the particles can be finely designed. As a result, the variance between each as-fabricated substrate can be minimized to ensure reproducibility. Also, by using a filter of the Raman spectroscopy in the future that allows for higher power from the laser, we can expect enhanced signals and can find the detection limit of the concentration of oxycodone that is below 90 ng mL−1.
4 Conclusion
We demonstrated a Ag decorated ZnO arrays chip, using a facile two-step fabrication strategy, for the SERS detection of opioids. Our results show that this design allows for a large SERS detection range for opioids concentrations, from 900 μg mL−1 to 90 ng mL−1, with remarkable accuracy and sensibility. This is due to the plasmonic signal enhancement caused by the Ag particles scattered across a ZnO array scaffolding. We verified such amplification observed in experiments using the FEM simulation. Our detection method is label-free and portable, which holds great promise to be an effective point-of-care and solution for sensitive, high-throughput and low-cost drug abuse detection especially for opiate substances.Author contributions
M. Z., C. J., and J. X. J. Z conceived the idea of detecting opioid substance using silver particle decorated ZnO array. M. Z. and C. J. contributed equally to this manuscript. M. Z. and C. J. designed and conducted the experiment and wrote the manuscript. Y. N. conducted the Raman spectroscopy measurement. Y. R. performed the simulations. N. H. provided insightful ideas, important discussions and edited the manuscript. Z. X. and L. D. provided important discussions and edited the manuscript. J. X. J. Z. provided guidance, supervised the work and edited the manuscript.Conflicts of interest
A United States patent application has been filed for the technology described in this work.Acknowledgements
The authors acknowledge financial support from the National Institute of Health (NIH) Director's Transformative Research Award (R01HL137157, PI: X. J. Z.), the National Science Foundation award (ECCS1509369, PI: X. J. Z.), and the startup fund from the Thayer School of Engineering at Dartmouth. C. J. is thankful for the discussion and help of characterization from Dr Maxime Guinel in the EM facility at Dartmouth College.References
- H. Hedegaard, B. A. Bastian, J. P. Trinidad, M. Spencer and M. Warner, Natl Vital Stat. Rep., 2018, 67, 1–14 Search PubMed.
- B. Goldberger, C. Chronister and M. Merves, in Clinical Applications of Mass Spectrometry, ed. U. H.-S. Garg, Springer US, 2019, pp. 38–43 Search PubMed.
- J. L. Knittel, D. J. Clay, K. M. Bailey, M. A. Gebhardt and J. C. Kraner, J. Anal. Toxicol., 2009, 33, 433–438 CrossRef CAS PubMed.
- M. Gingras, M. H. Laberge and M. Lefebvre, J. Anal. Toxicol., 2010, 34, 78–83 CrossRef CAS PubMed.
- C. A. Haller, J. Stone, V. Burke, J. Branch, K. Chen and S. Gross, J. Anal. Toxicol., 2006, 30, 106–111 CrossRef CAS PubMed.
- A. Haddad, M. A. Comanescu, O. Green, T. A. Kubic and J. R. Lombardi, Anal. Chem., 2018, 90, 12678–12685 CrossRef CAS PubMed.
- M. M. Kimani, A. Lanzarotta and J. S. Batson, J. Forensic Sci., 2020, 1–14 Search PubMed.
- A. Lanzarotta, M. Witkowski and J. C. Batson, J. Forensic Sci., 2020, 65, 421–427 CrossRef CAS PubMed.
- A. N. Masterson, S. Hati, G. Ren, T. Liyanage, N. E. Manicke, J. V Goodpaster and R. Sardar, Anal. Chem., 2021, 93, 2578–2588 CrossRef CAS PubMed.
- R. Mirsafavi, M. Moskovits and C. Meinhart, Analyst, 2020, 145, 3440–3446 RSC.
- R. Salemmilani, M. Moskovits and C. D. Meinhart, Analyst, 2019, 144, 3080–3087 RSC.
- C. Shende, A. Farquharson, C. Brouillette, W. Smith and S. Farquharson, Molecules, 2019, 24, 2578 CrossRef CAS PubMed.
- C. Shende, C. Brouillette and S. Farquharson, Analyst, 2019, 144, 5449–5454 RSC.
- N. G. Wilson, J. Raveendran and A. Docoslis, Sens. Actuators, B, 2021, 330, 129303 CrossRef CAS.
- V. Turzhitsky, L. Zhang, G. L. Horowitz, E. Vitkin, U. Khan, Y. Zakharov, L. Qiu, I. Itzkan and L. T. Perelman, Small, 2018, 14, 1802392 CrossRef PubMed.
- S. Pang, T. Yang and L. He, TrAC, Trends Anal. Chem., 2016, 85, 73–82 CrossRef CAS.
- R. Pilot, R. Signorini, C. Durante, L. Orian, M. Bhamidipati and L. Fabris, Biosensors, 2019, 9, 57 CrossRef CAS PubMed.
- L. Bao, S. Han, X. Sha, H. Zhao, Y. Liu, D. Lin and W. Hasi, J. Spectrosc., 2019, 2019, 1–5 CrossRef.
- Y. Shan, Y. Yang, Y. Cao, C. Fu and Z. Huang, Nanotechnology, 2016, 27, 145502 CrossRef PubMed.
- K. A. Willets and R. P. Van Duyne, Annu. Rev. Phys. Chem., 2007, 58, 267–297 CrossRef CAS PubMed.
- G. Barbillon, V. E. Sandana, C. Humbert, B. Bélier, D. J. Rogers, F. H. Teherani, P. Bove, R. McClintock and M. Razeghi, J. Mater. Chem. C, 2017, 5, 3528–3535 RSC.
- Y. F. Chan, H. J. Xu, L. Cao, Y. Tang, D. Y. Li and X. M. Sun, J. Appl. Phys., 2012, 111, 033104 CrossRef.
- L. Chen, L. Luo, Z. Chen, M. Zhang, J. A. Zapien, C. S. Lee and S. T. Lee, J. Phys. Chem. C, 2010, 114, 93–100 CrossRef CAS.
- H. Yadav, N. Sinha, S. Goel and B. Kumar, J. Alloys Compd., 2016, 689, 333–341 CrossRef CAS.
- G. Sinha, L. E. Depero and I. Alessandri, ACS Appl. Mater. Interfaces, 2011, 3, 2557–2563 CrossRef CAS PubMed.
- L. M. Chen and Y. N. Liu, ACS Appl. Mater. Interfaces, 2011, 3, 3091–3096 CrossRef CAS PubMed.
- G. Shan, S. Zheng, S. Chen, Y. Chen and Y. Liu, Colloids Surf., B, 2012, 94, 157–162 CrossRef CAS PubMed.
- K. Sivashanmugan, J. Der Liao, B. H. Liu, C. K. Yao and S. C. Luo, Sens. Actuators, B, 2015, 207, 430–436 CrossRef CAS.
- W. Song, X. Han, L. Chen, Y. Yang, B. Tang, W. Ji, W. Ruan, W. Xu, B. Zhao and Y. Ozaki, J. Raman Spectrosc., 2010, 41, 907–913 CrossRef CAS.
- Y. Xie, S. Yang, Z. Mao, P. Li, C. Zhao, Z. Cohick, P. H. Huang and T. J. Huang, ACS Nano, 2014, 8, 12175–12184 CrossRef CAS PubMed.
- Y. Zang, J. Yin, X. He, C. Yue, Z. Wu, J. Li and J. Kang, J. Mater. Chem. A, 2014, 2, 7747–7753 RSC.
- C. Cheng, B. Yan, S. M. Wong, X. Li, W. Zhou, T. Yu, Z. Shen, H. Yu and H. J. Fan, ACS Appl. Mater. Interfaces, 2010, 2, 1824–1828 CrossRef CAS PubMed.
- H. Hu, Z. Wang, S. Wang, F. Zhang, S. Zhao and S. Zhu, J. Alloys Compd., 2011, 509, 2016–2020 CrossRef CAS.
- J. Huang, F. Chen, Q. Zhang, Y. Zhan, D. Ma, K. Xu and Y. Zhao, ACS Appl. Mater. Interfaces, 2015, 7, 5725–5735 CrossRef CAS PubMed.
- A. E. Kandjani, M. Mohammadtaheri, A. Thakkar, S. K. Bhargava and V. Bansal, J. Colloid Interface Sci., 2014, 436, 251–257 CrossRef CAS PubMed.
- A. E. Kandjani, Y. M. Sabri, M. Mohammad-Taheri, V. Bansal and S. K. Bhargava, Environ. Sci. Technol., 2015, 49, 1578–1584 CrossRef PubMed.
- S. Lei, C. Tao, J. Li, X. Zhao and W. Wang, Appl. Surf. Sci., 2018, 452, 148–154 CrossRef CAS.
- F. Li, S. Wu, L. Zhang and Z. Li, J. Mater. Sci.: Mater. Electron., 2017, 28, 16233–16238 CrossRef CAS.
- H. H. Park, X. Zhang, K. W. Lee, A. Sohn, D. W. Kim, J. Kim, J. W. Song, Y. S. Choi, H. K. Lee, S. H. Jung, I. G. Lee, Y. D. Cho, H. B. Shin, H. K. Sung, K. H. Park, H. K. Kang, W. K. Park and H. H. Park, Nanoscale, 2015, 7, 20717–20724 RSC.
- Y. Tan, J. Gu, W. Xu, Z. Chen, D. Liu, Q. Liu and D. Zhang, ACS Appl. Mater. Interfaces, 2013, 5, 9878–9882 CrossRef CAS PubMed.
- Q. Li, Y. Jiang, R. Han, X. Zhong, S. Liu, Z. Y. Li, Y. Sha and D. Xu, Small, 2013, 9, 927–932 CrossRef CAS PubMed.
- T. T. Nhung, Y. Bu and S. W. Lee, J. Cryst. Growth, 2013, 373, 132–137 CrossRef CAS.
- N. Hao, Z. Xu, Y. Nie, C. Jin, A. B. Closson, M. Zhang and J. X. J. Zhang, Chem. Eng. J., 2019, 378, 122222 CrossRef CAS.
- C. Jin, N. Hao, Z. Xu, I. Trase, Y. Nie, L. Dong, A. Closson, Z. Chen and J. X. J. Zhang, Sens. Actuators, A, 2020, 305, 111912 CrossRef CAS PubMed.
- C. Xu, P. Shin, L. Cao and D. Gao, J. Phys. Chem. C, 2009, 114, 125–129 CrossRef.
- L. Wang, D. Tsan, B. Stoeber and K. Walus, Adv. Mater., 2012, 24, 3999–4004 CrossRef CAS PubMed.
- S. Li, N. Zhang, N. Zhang, D. Lin, X. Hu and X. Yang, Sens. Actuators, B, 2020, 321, 128519 CrossRef CAS.
- S. Picciolini, N. Castagnetti, R. Vanna, D. Mehn, M. Bedoni, F. Gramatica, M. Villani, D. Calestani, M. Pavesi, L. Lazzarini, A. Zappettini and C. Morasso, RSC Adv., 2015, 5, 93644–93651 RSC.
- C. Huang, C. Xu, J. Lu, Z. Li and Z. Tian, Appl. Surf. Sci., 2016, 365, 291–295 CrossRef CAS.
- M.-K. Nguyen, W.-N. Su and B.-J. Hwang, Adv. Healthcare Mater., 2017, 6, 1601290 CrossRef PubMed.
- S. Farquharson, C. Brouillette, W. Smith and C. Shende, Front. Chem., 2019, 7, 1–16 CrossRef PubMed.
- S. Farquharson, C. Shende, A. Sengupta, H. Huang and F. Inscore, Pharmaceutics, 2011, 3, 425–439 CrossRef CAS PubMed.
- V. Rana, M. V. Cañamares, T. Kubic, M. Leona and J. R. Lombardi, J. Forensic Sci., 2011, 56, 200–207 CrossRef CAS PubMed.
- R. Meatherall, J. Anal. Toxicol., 2005, 29, 301–308 CrossRef CAS PubMed.
Footnote |
| † Equal contribution. |
| This journal is © The Royal Society of Chemistry 2021 |