
 Open Access Article
 This Open Access Article is licensed under a Creative Commons Attribution-Non Commercial 3.0 Unported Licence
A simple way to fabricate pure anatase 2D TiO2 IO monolayer: structure, color control and its application in electrochromism†
Hua Li,
Jacques Robichaud and
Yahia Djaoued *
*
Laboratoire de Recherche en Matériaux et Micro-spectroscopies Raman et FTIR, Université de Moncton, Campus de Shippagan, Shippagan, NB E8S1P6, Canada. E-mail: yahia.djaoued@umoncton.ca
First published on 18th February 2021
Abstract
Pure anatase two dimensional (2D) TiO2 inverse opal (IO) films, consisting of a highly ordered hexagonal-patterned structure, are synthesized from various sized polystyrene spheres (PS) as colloidal template simply coupled with TiOSO4 aqueous solution as TiO2 precursor using a “dynamic-hard-template infiltration” strategy. Herein, the TiOSO4 solution is directly infiltrated into the interstices of the 2D self-assembled PS opal template at an air/water interface resulting in a TiOSO4/PS opal composite film floating on the surface of water which was further deposited onto ITO or silicon substrates. Calcination of the obtained opal composite films at temperatures ranging from 300 to 550 °C resulted in 2D TiO2 IO films with various pore sizes having an inverse moth's eye structure. Based on EDS measurements, sulfur ions S6+ were detected in the IO films calcined up to 550 °C. In order to eliminate these S6+ ions and obtain pure anatase 2D TiO2 IO, aqueous immersion was performed after calcination without disturbance of the IO ordered structure. Surface morphology, crystal phase and optical transmittance of the TiO2 IO films, were concurrently investigated by SEM, Raman and UV-vis-NIR. Owing to their precisely adjustable structure, the obtained TiO2 2D IO films exhibited structural colors varying from pale purple, to blue, to polychrome as the array period increases. The films obtained on ITO substrates were successfully used as active electrodes in the fabrication of electrochromic (EC) devices.
Introduction
As one of the most promising semiconductors, titanium dioxide (TiO2) has been studied for a long time, due to its extensive applications in photocatalysis,1–3 energy conversion and storage,4 sensors,5,6 and so on. Nanostructured TiO2 films consisting of nanorods,7 nanotubes,8 hollow spheres9 and inverse opal (IO)10 have been particularly focused on due to their convenience for the fabrication of various devices. Among them, inverse opal or ordered macroporous structures have been widely popular candidates in optoelectronic applications because of their enhanced molecular diffusion kinetics due to increased surface area as well as their outstanding light capture ability and higher solar energy conversion from the increased path length of light (slow photons).11–14To obtain TiO2 inverse opal, various methods have been attempted, such as atomic layer deposition (ALD) or chemical vapour deposition (CVD),15,16 doctor blade,17 electrodeposition18 and so on. The general fabrication scheme of IOs starts from primary formation of an opal template, afterwards, infiltration of guest material, followed by its conversion and inversion into the aimed material.19,20 Usually, for the synthesis of TiO2 IO films, guest materials such as titanium alkoxides (reactive infiltration) or titania nanoparticles (non-reactive infiltration) were infiltrated into the interstices of the opal template by capillary action, in the form of fluid (liquid or vapour). When titania nanoparticles were directly introduced into the opal template, the stabilization of the TiO2 colloidal sol was important, but also difficult to attain due to the low intrinsic surface charge of titania.21 Although it was solved under the assistance of certain surfactant,10,22 such as tetramethylammonium hydroxide (TMAH), the use of surfactant destroys the array of the opal template to some extent since it accordingly changes the surface tension of the opal films. In that case, a careful control of the infiltration is always needed, which process is difficult to replicate in the perspective of practical application. Therefore, most researchers chose reactive infiltration route by using precursors instead of titania nanoparticles followed by chemical conversion. Typical titania precursors are titanium alkoxides (for example, tetra-n-butyltitanate (TBT)9,23,24) and titanium halide salt.25,26 The former TBT was often infiltrated by immersion or dip-coating, frequently resulting in low filling fraction and poor ordering, partly due to the high shrinkage during conversion and low interaction between opal template and substrate during dipping.9,24 As for titanium halide salt, it is often applied in various vapour phase deposition routes, especially atomic layer deposition (ALD).25 The later makes it possible to deposit precursor onto complex-shaped substrates with a controllable layer thickness27,28 while relatively expensive equipment hinders its practical use.
Many authors have used TiOSO4 to obtain TiO2 nanoparticles (in powder form), mainly for photocatalytic applications. Moreover, the synthesis methods used are more or less complex, using additives, depending on the goal of the research.29–34 However, papers on fabrication of TiO2 thin films using TiOSO4 as precursor are scarce. For instance Ge et al. synthesized anatase TiO2 sols by peptization of the hydrolysed titanyl sulfate in hydrogen peroxide solution with subsequent reflux. TiO2 thin film were deposited on glass slides at room temperature from the as prepared TiO2 sol by dip-coating without further thermal treatment to eliminate organics or to induce crystallization.35 Bavykin et al. produced TiO2 thin films on different substrates placed in a solution containing TiOSO4 and H2SO4 at various concentrations and heated at 80 °C to study the kinetics of film growth.36 Yamabi et al. obtained films with mixed rutile and anatase phases by heterogeneous nucleation in aqueous solutions with titanyl sulfate at near room temperature. The phase of the TiO2 films was essentially determined by the initial pH value and the Ti concentration of the precursor solutions.37 In these three cited works, no mention is made of the possible presence of sulfur ions in the obtained films.
Here, we propose TiOSO4 as an alternative to fabricate 2D TiO2 IO films under our newly developed route, the “dynamic hard template infiltration” strategy.38 Unlike titanium alkoxides, which usually requires organic solvent, TiOSO4 is an inorganic salt which easily dissolves in water. Moreover, TiO2 in the anatase phase can be obtained solely from hydrolysis of an aqueous solution of TiOSO4 followed by calcination, without using any other additive or method to enhance crystalisation. Apart from the usage of TiOSO4, the “dynamic hard template infiltration” strategy assures the maximum filling fraction since the polystyrene spheres, floating on the surface of water in the form of opal film, are loosely connected with each other, having more freedom to move in comparison to a hard PS opal template already deposited on a substrate in the conventional “hard template” method. The high filling fraction obtained in “dynamic hard template infiltration” strategy also avoids a repeated infiltration which happens in most situations of immersion route. To attain pure anatase 2D TiO2 IO films, the SO42− ions were eliminated by aqueous immersion after calcination of the films.
Experimental
Materials
The non-cross-linked monodispersed carboxyl polystyrene (PS) sphere aqueous suspensions (PS particles, 5.0% w/v) were purchased from Spherotech Inc. Before using, they were diluted into 0.5% w/v (for 200 nm PS sphere, 0.25 %w/v is used) with equal volumes of ethanol and water. Prior to use, the ITO coated glass substrates or silicon chips were ultrasonically treated for 15 min successively in water, acetone, ethanol and deionized water. TiOSO4, sodium dodecylsulfate (SDS) and ethanol of reagent grade were purchased from Sigma-Aldrich. All the aqueous solutions were prepared with Millipore water (resistance = 18.2 MΩ cm−1). The glass substrates were cleaned in a piranha solution (30% H2O2: concentrated H2SO4 = 3![[thin space (1/6-em)]](https://www.rsc.org/images/entities/char_2009.gif) :7 v/v) at 100 °C for 15 min, and then washed with Millipore water.
:7 v/v) at 100 °C for 15 min, and then washed with Millipore water.
Fabrication of TiO2 IO films
The 2D TiOSO4/PS opal composite monolayer building blocks were synthesized by “dynamic hard template infiltration” strategy as developed in our previous work.10,20,38 Initially, a PS opal floating on surface of water was synthesized by gas–liquid–solid interface self-assembly method, as follows: a clean functionalized glass slide was placed on the bottom of a Petri dish. Then, Millipore water was added until it nearly submerged the slide. Afterwards, diluted PS suspension was added drop-by drop onto the glass slide, to get a self-assembled monolayer of PS spheres on the water surface. Then a few drops of 2 wt%, SDS solution were added into the water to closely pack the PS monolayer, resulting in a 2D PS opal template floating over water.After the formation of the PS opal monolayer, 12 ml TiOSO4 aqueous solution (0.43 mol L−1) was injected into the water underneath the PS spheres opal template. After around 20 minutes, a 2D TiOSO4/PS opal composite monolayer was self-assembled on the water surface. Next, the water was slowly sucked out to sink the opal composite monolayer film onto ITO or silicon substrate.
To obtain the 2D TiO2 IO films, the PS spheres template was removed from the opal composite by calcination for 1.5 h at various temperatures ranging from 300 to 550 °C.
After calcination, some chosen samples were further immersed into water for 3 days.
The samples were named using letters and three digits in the following way: PS, TP and T, refers to PS spheres opal template, titania precursor/PS spheres opal composite, and TiO2 inverse opal, respectively, while the three succeeding digits used refer to the PS spheres diameter in nm. The calcination temperatures were indicated by adding a dash symbol (“—”) followed by the calcination temperature in °C. Finally, when immersion took place “im” was added at the end of the sample name. For instance, sample T530-550im is a 2D TiO2 IO templated from 530 nm PS spheres, calcined at 550 °C, followed by immersion in water for 3 days.
Synthesis of the ion conducting solution
For the synthesis of the ion conducting (IC) solution, hybrid ORMOSIL was first prepared by an acylation reaction between poly(propylene glycol)bis(2-aminopropyl ether) (2-APPG) and isocyanatopropyltriethoxysilane (ICS) in tetrahydrofuran (THF) in a volume ratio of 1:0.1:1, refluxed for 6 hours at 65 °C. Then, THF was evaporated resulting in a transparent, thick solution. An alcoholic solution of LiI (Aldrich powder, 99.9%) + I2 (BDH, 99.8%, AR) was added into this hybrid ORMOSIL, to obtain the IC solution. Final solution was viscous with a yellow/brown color.38
Fabrication of an EC device
An EC device was fabricated using sample T530-550im. First, an ion conducting layer (ICL) was coated by doctor blade technique on top of the 2D TiO2 IO film deposited on an ITO substrate. Then, another ITO substrate was gently pressed against the ICL coating to ensure a uniform distribution of the ICL. This assembly resulted in an asymmetric EC device with the following configuration: ITO/TiO2 IO/ICL/ITO. The area of the EC device was ∼2.5 × 4 cm2.Characterization
SEM studies were performed using a S4800 FESEM system from Hitachi at a working distance of 3.2 mm. Energy Dispersive Spectroscopy (EDS) analysis were performed using Oxford Instruments X-Max and an INCA software. Micro-Raman spectra were recorded at room temperature with a Jobin-Yvon Labram HR micro analytical spectrometer. The spectra were generated with 17 mW, 632.8 nm, He–Ne laser excitation. A Biochrom Ultrospec 2000 UV-vis-NIR spectrophotometer was used to record the optical transmittance spectra of the films and of the EC devices in their colored and bleached states.Results and discussion
Formation process of 2D TiO2 IOs
TiOSO4 is usually used to prepare TiO2 particles in pigment industry. It has obvious advantages over most of other Ti4+ containing precursors (such as titanium alkoxides) like low cost, aqueous solubility, and relative stability in aqueous solution. When dissolved in water, TiOSO4 is partly hydrolyzed into H2TiO3 or TiO2·H2O (eqn (1) & (2)) and further converts into TiO2 particles depending on the reaction conditions.39| TiOSO4 + 2H2O → H2TiO3 + H2SO4 | (1) |
| TiOSO4 + 2H2O → TiO2·H2O + H2SO4 | (2) |
Such formed H2TiO3 (TiO2·H2O) exist in the form of stable aqueous colloid when its concentration is lower than a certain value, rendering it practical for the preparation of 2D TiO2 IO films under “dynamic hard template infiltration” strategy. Here the maximum concentration was 0.43 mol L−1.
After the formation of PS spheres opal templates obtained from 220 to 920 nm diameter PS spheres floating on the surface of water, H2TiO3 (TiO2·H2O) precursor sol was injected underneath the PS opal crystal. Under the influence of capillary forces, the H2TiO3 precursor sol infiltrated the interstitial spaces between the PS spheres of the opal film. During this process, the PS spheres interstitial spaces enlarge to some extent, but the relative position of the spheres is kept unchanged due to the dominant capillary action, i.e., the opal structure is retained. Apart from this, since the PS spheres are floating onto the liquid–air interface, they have freedom to accommodate guest materials in their interstitial spaces and therefore higher filling fraction is achieved in contrast to infiltration conducted under a “static hard template” with the opal template stuck onto the substrate.10,38 After a homogenizing period of around 20 minutes, an ITO or silicon substrate was inserted into the solution, underneath the floating 2D TiOSO4/PS opal composite film. The final TiO2 IO film was obtained by sucking out the solution to deposit the opal composite film onto the substrate, followed by drying at 50 °C and calcination at temperatures ranging from 300 to 550 °C.
After hydrolyzation, TiOSO4 became amorphous with sulfate ions complexed with Ti4+ forming some ligand:
| [Ti(H2O)mAn]4−kn, |
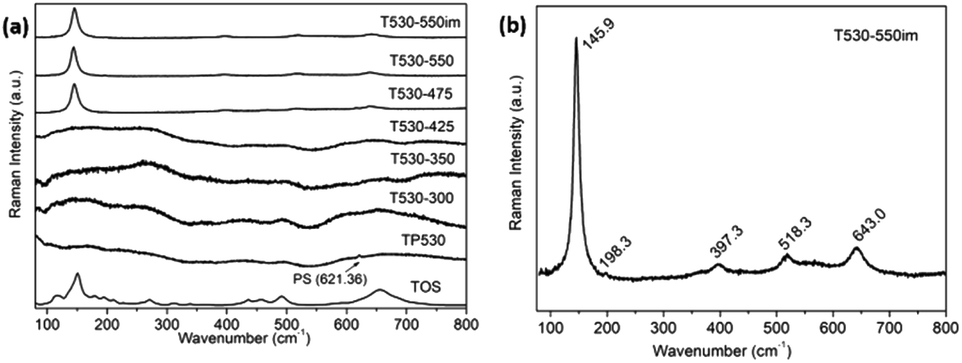 | ||
| Fig. 1 Raman spectra of: (a) TiOSO4 (TOS) and of TiO2 IOs templated from 530 nm diameter PS spheres and calcined at different temperatures, including sample T530-550 after immersion; (b) Raman spectrum of sample T530-550im alone, exhibiting the peaks of anatase TiO2. | ||
Generally, the reaction could be presented as follows:
| Ti(OH)3HSO4 → Ti(OH)3+ → TiO2H2O |
The Raman results from Fig. 1 were combined to the corresponding EDS test results to produce Table 1. It is observed for sample T530-300, T530-350 and T530-425, whose phases are amorphous, that the ratios of S6+ to Ti4+ are all above 1.5, indicating that sulfate was still complexed firmly with Ti4+, without full decomposition. When calcination temperature is higher than 425 °C, the ratio of S6+ to Ti4+ is quickly lowered below 1.0 (sample T530-475 & T530-550). Unfortunately, it is hard to get rid of S6+ thoroughly simply through calcination. In order to obtain pure anatase TiO2 from calcination and considering that the remaining sulfate in our samples exists in the form of soluble ions (SO42−), further washing was attempted by immersing the films into distilled water for 3 days (T530-475im & T530-550im). After this immersion, the S6+ to Ti4+ ratios for both samples were greatly reduced, especially for sample T530-550im whose ratio became 0, indicating that the S6+ has been removed thoroughly. Further SEM observation demonstrates that the sample calcined at 550 °C kept the same good ordered structure before and after aqueous immersion (Fig. 2).
| Sample name | Calcination temperature (°C) | Raman result | S6+/Ti4+ |
|---|---|---|---|
| T530-300 | 300 | Amorphous | 1.65 |
| T530-350 | 350 | Amorphous | 3.1 |
| T530-425 | 425 | Amorphous | 3.52 |
| T530-475 | 475 | Crystalized | 0.28 |
| T530-550 | 550 | Crystalized | 0.75 |
| T530-475im | 475 | Crystalized | 0–0.03 |
| T530-550im | 550 | Crystalized | 0 |
 | ||
| Fig. 2 SEM images for sample T530-550 before (a) and after (b) aqueous immersion. | ||
As seen in Fig. 1(b), the Raman spectrum of TiO2 IO sample T530-550im exhibits the typical modes of anatase TiO2.40,41 These are three Eg modes at 145.9, 198.3 and 643.0 cm−1, two B1g modes at 397.3 and 518.3 cm−1. This last mode overlaps with an additional A1g mode at 518.9 cm−1. The Eg mode is caused by symmetric stretching vibration and the B1g by symmetric bending while the A1g mode is caused by antisymmetric bending of O–Ti–O in TiO2.40,41 Both Eg (1) and Eg (2) modes at 145.9 and 198.3 cm−1 are blue-shifted in the TiO2 IO in contrast to commercial anatase TiO2 powder (142.5 cm−1) while other Raman modes remain unchanged. The broadened (12.9 cm−1) and high-frequency shifts (145.9 cm−1) indicate that sample T530-550im is constituted of fully crystallized TiO2 nanoparticles. Furthermore, it was verified that PS and its calcination products were completely removed from the 2D TiO2 IO samples after calcination at 550 °C (see Fig. S1†). A phonon confinement model, which establishes a relationship between the crystallite sizes and the FWHM of the main Raman peak of TiO2 (here 12.1 cm−1), was used and the corresponding crystallite size was found to be ∼11.5 nm.42,43
Recently Pillai et al. studied sulfur doped TiO2 (S–TiO2) nanoparticles for their enhanced photochemical activity.34 In the Raman characterization of those nanoparticles they observed that S–TiO2 presents Raman scattering similar to that of TiO2. However, by close examination of the main peak, they also noticed that the presence of sulfur shifted the main Raman peak towards lower frequencies. They attributed the shift to the Ti–S bond formation, possibly altering the force constant of the Eg vibration mode in contrast to the Ti–O bonds. In our work, similar shift of the main TiO2 Raman peak was observed. As mentioned above, EDS was used to assess the ratio of ions S6+ to TiO4+. No sulfur was seen in the EDS results for sample T530-550im whereas sample T530-550 had a S6+ to TiO4+ atomic ratio of 0.75. In agreement with Vishnu's observations, the main Raman peak of sample T530-550 was shifted to 144.2 cm−1 as compared to that of sample T530-550im (145.9 cm−1) as seen in Fig. 3.
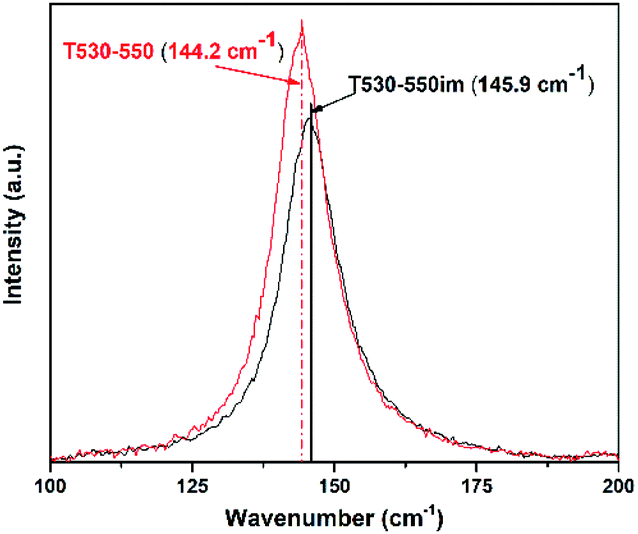 | ||
| Fig. 3 Raman spectra of samples T530-550 and T530-550im illustrating the shift of the main Eg peak from the presence of sulphur ions. | ||
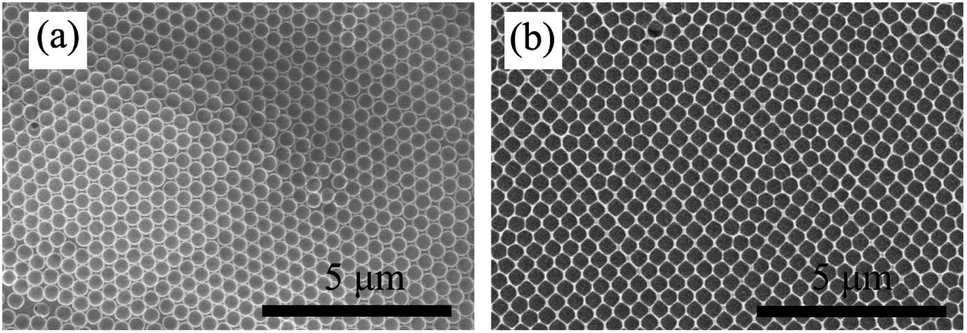
Fig. 4(a) to (c) show the SEM images of the large-area highly ordered and uniform opal structures obtained from 530 nm PS spheres at each fabrication step, from PS opal (Fig. 4(a)), to TiO2 precursor/PS opal composite (Fig. 4(b)), to TiO2 IO (Fig. 4(c)). Infiltration of TiO2 precursor enlarged the interstitial spaces in the PS opal film from close contacted to around 27 nm. After removal of the PS spheres by calcination, one can recognize their traces left in the form of spherical air cavities. The opal periods of the samples were estimated from the SEM images using the ImageJ software. The results were 471, 498 and 469 nm for samples PS530, TP530 and T530-500im, respectively. These values are smaller than the 530 nm nominal value of the PS spheres diameter by 11%. The difference between nominal and actual (or measured) value of the PS spheres diameter had been noted in one of our earlier work.20 From the cross-sectional SEM image Fig. 4(d) and using ImageJ software, the film sample T530-500im, was estimated to be 250 nm thick. The resultant TiO2 IO shows some shrinkage in contrast to the 2D TiOSO4/PS opal composite whose structural period is around 498 nm (Fig. 4(a)). Thus, the lateral shrinkage, calculated from the opal periods before and after calcination is estimated to be 5.8%.44 This is attributed to mass loss and density increase during the transformation of the sample from 2D TiOSO4/PS opal composite to anatase TiO2 IO.
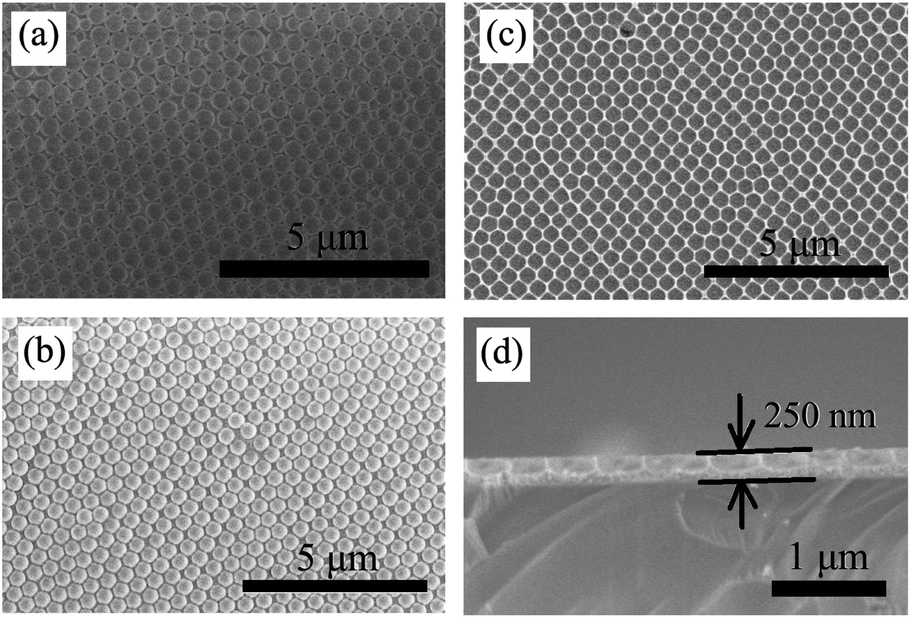 | ||
| Fig. 4 SEM images of (a) PS530; (b) TP530; (c) T530-550im and its cross-sectional SEM image (d). | ||
Fig. 5(a) shows the UV-vis-NIR transmittance spectra of PS opal (PS530), 2D TiOSO4/PS opal composite (TP530) and TiO2 IO (T530-550im) films templated from 530 nm PS spheres. All three samples show peaks in the range of 500 to 600 nm attributed to the blue-green range. The PS opal has a main peak situated at around 570 nm while the 2D TiOSO4/PS opal composite film (TP530) has its main peak at 540 nm. The main peak for the TiO2 IO film (T530-550im) is situated at 580 nm. Similar to most of other photonic crystals (PCs),20 both 2D TiOSO4/PS opal composite film (TP530) and TiO2 IO film (T530-550im) show characteristic shining structural blue-green color (Fig. 5(b) to (e)), which is consistent with the results from UV-vis-NIR transmittance spectra, proof of a well-ordered array of pores. Also, different substrates render different glare effect due to their different refractive indices: films on ITO substrates (Fig. 5(b) and (c)) have lower glaring effect than those on silicon substrates (Fig. 5(d) and (e)) since ITO has a much lower refractive index (around 1.9) than silicon (3.42).
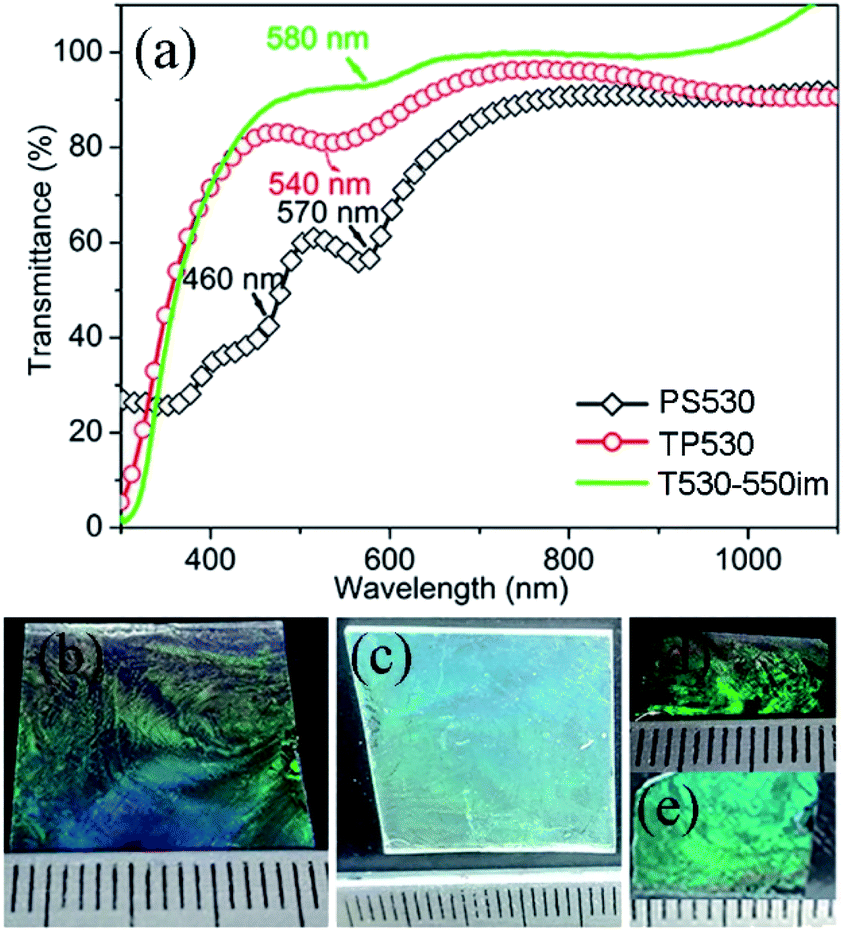 | ||
| Fig. 5 UV-vis-NIR transmittance spectra of PS530 (black diamonds) (a), TP530 (red circles), T530-550im (green trace), and optical photos for samples TP530 supported on ITO (b) and silicon chips (d); T530-550im supported on ITO (c) and silicon chips (e). | ||
Microstructural and color control of TiO2 2D IOs
Further exploration of color control by structure adjustment was conducted by using various sizes of PS sphere templates, from 200 to 920 nm, using the same process as for sample T530-550im. In order to simplify the sample name, we used T220, T480, T880 and T920, ‘T’ referring to template and the digits to the nominal diameter of the PS spheres in nm: T220 refers a TiO2 IO film templated from 220 nm sized PS spheres. Those TiO2 IO films were also referred to as T series. As it is shown in Fig. 6, all these films show circular upper-end openings with honeycomb structures, indicating their hexagonal symmetry. Similar to crystal defects, some minor disorder could be attributed to sporadic presence of PS spheres of different diameters. The pore diameter at the film surface is smaller than that of the PS spheres due to the framework shrinkage as well as the filling height of the guest materials. From measurements on the SEM images of Fig. 6 using the imageJ software, the array periods of the T series IO samples were estimated to be 237, 435, 809 and 919 nm for samples T220, T480, T880 and T920, respectively. Fig. 7(a) shows the UV-vis-NIR transmittance spectra as well as corresponding optical reflection images (insets in Fig. 7(a)) for samples T220, T480, T880 and T920. One can see an obvious color change which depends on the wavelength absorbed by the photonic band gap as the sizes of PS templates change. A single color is distinct for T220 (dark purple) and T480 (blue), while T880 and T920 appeared as rainbow-like. The wavelength of the absorption maximum shows red shift as the array period increases from 435 nm (T480) to 809 nm (T880) to 919 nm (T920), while there is no absorption maximum observed in T220 partly due to its relatively low structural order. The absorbed wavelength of 498 nm for T480 is within the blue-green band which is well consistent with the optical observation. Also, more than one absorbed wavelength is seen for both T880 and T920: 380 nm, 588 nm and 760 nm for T880, attributed to purple, green-yellow and red; 518 nm and 820 nm for T920, attributed to blue-green and dark red. Therefore, through adjusting the structure, it is feasible to modify the IO films, which could lead to application in structural color bionics. The corresponding Raman spectra of the T series 2D TiO2 IO films (Fig. 7(b)) show characteristic anatase Raman modes around 147 cm−1 (Eg), 400 cm−1 (B1g), 520 cm−1 (B1g) and 640 cm−1 (Eg). | ||
| Fig. 6 SEM images of (a) T220; (b) T480; (c) T880 and (d) T920 templated from 220, 480, 880 and 920 nm PS spheres, respectively. | ||
 | ||
| Fig. 7 (a) UV-vis-NIR transmittance spectra for samples T220 (black squares), T480 (red circles), T880 (green up-triangles) and T920 (blue left-triangles); (b) Raman spectra of the corresponding 2D TiO2 IO films. Inset in (a) show the film's optical reflection images. | ||
Electrochromic application for TiO2 2D IOs
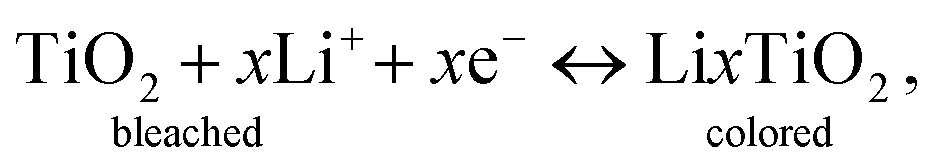
As demonstration of applicability of the prepared TiO2 IO film on ITO substrates, an EC device was fabricated using a TiO2 IO film synthesized from 530 nm PS spheres (sample T530-550im), having a thickness of 250 nm (Fig. 4(d)). When a low potential (+3.5 V) is applied across the EC device, Li + ions and electrons move across the device in opposite directions. Lithium ions and electrons are injected into the TiO2 IO film. This double injection phenomenon can be represented by the following equation:
 | (3) |
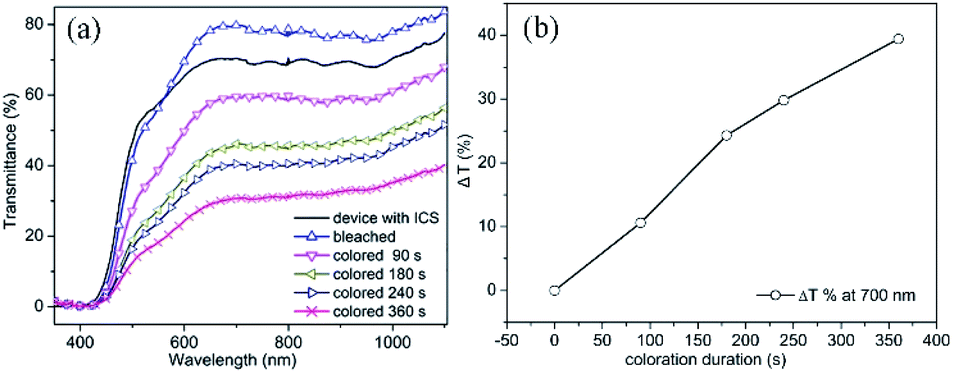 | ||
| Fig. 8 (a) Transmittance spectra of the EC device in the as prepared state (solid black line); colored at 3.5 V for 90 s (pink downward triangle), 180 s (green left triangle), 240 s (dark blue, right triangle) and 360 s (red cross); and bleached at −3.5 V for 360 s (blue triangle); (b) changes of optical contrast at visible range (700 nm) with coloration duration. | ||
As observed from the slope of the graph from Fig. 8(b), the coloration speed is lowered after 180 s. It can also be observed from the slope of Fig. 8(b) and the non-overlapping curves of Fig. 8(a), that even after a coloration time of 360 s the maximum coloration has not been reached.
In contrast to our earlier results on TiO2 IO which were obtained by infiltrating directly TiO2 nano particles rather than a Ti precursor,10 in the present experiment, it takes a longer time to get similar optical contrast. With the device constructed from TiO2 nano particles it took only 3 min to reach 44.7% optical contrast at 700 nm wavelength. Such observation could be attributed to the difference in crystallite size and surface area of the devices: crystallite size around 11.5 nm with pore sizes of ∼426 nm for the present device, while the device from the earlier research had a crystallite size of only ∼5.5 nm with pore size ∼410 nm.
Conclusions
In summary, pure anatase 2D TiO2 IO films with various porous structures were synthesized by “dynamic hard template infiltration” strategy by using a TiOSO4 aqueous solution as precursor. Partially hydrolyzed TiOSO4, driven by capillary forces, self-diffuses into the interstitial space of the self-assembled opal PS spheres. The removal of PS templates and the crystallization of the films were realized by calcination, leading to the formation of single layer anatase TiO2 IOs with various pore sizes due to the sizes of PS spheres used as opal templates and presenting a structure like an inverse moth's eye. In order to get rid of the remaining sulfate ions, to assure pure anatase 2D TiO2 IO, aqueous immersion is required after calcination. The sample kept the same well-ordered structure after aqueous immersion. Owing to their precisely adjustable structure, the obtained TiO2 2D IO films exhibit featured structural color from pale purple, blue and polychrome, as the array period increases which are well consistent with corresponding UV-vis-NIR results: the wavelength absorbed is accordingly red-shifted as the period of the array increases. The films obtained on ITO substrates were successfully used as an active electrode in the fabrication of electrochromic (EC) device.Conflicts of interest
There are no conflicts to declare.Acknowledgements
The financial support from the National Science and Engineering Research Council (NSERC) of Canada (grant #2017-05094), the John R. Evans Leaders Fund (Canada Foundation for Innovation) (grant #27741), and the Research Assistantships Initiative of New Brunswick Innovation Fund (NBIF) is gratefully acknowledged.Reference
- J. Schneider, M. Matsuoka, M. Takeuchi, J. Zhang, Y. Horiuchi, M. Anpo and D. W. Bahnemann, Understanding TiO2 Photocatalysis: Mechanisms and Materials, Chem. Rev., 2014, 114, 9919–9986 CrossRef CAS.
- J. Zhang, Y. Wu, M. Xing, S. A. K. Leghari and S. Sajjad, Development of modified N doped TiO2 photocatalyst with metals, nonmetals and metal oxides, Energy Environ. Sci., 2010, 3, 715–726 RSC.
- Y. Li, B. P. Bastakoti, M. Imura, S. M. Hwang, Z. Sun, J. H. Kim, S. X. Dou and Y. Yamauchi, Synthesis of Mesoporous TiO2/SiO2 Hybrid Films as an Efficient Photocatalyst by Polymeric Micelle Assembly, Chem.–Eur. J., 2014, 20, 6027–6032 CrossRef CAS.
- R. Yew, S. K. Karuturi, J. Liu, H. H. Tan, Y. Wu and C. Jagadish, Exploiting defects in TiO2 inverse opal for enhanced photoelectrochemical water splitting, Opt. Express, 2019, 27(2), 761–773 CrossRef CAS.
- I.-D. Kim, A. Rothschild, B. H. Lee, D. Y. Kim, S. M. Jo and H. L. Tuller, Ultrasensitive Chemiresistors Based on Electrospun TiO2 Nanofibers, Nano Lett., 2006, 6, 2009–2013 CrossRef CAS.
- O. K. Varghese, D. Gong, M. Paulose, K. G. Ong and C. A. Grimes, Hydrogen sensing using titania nanotubes, Sens. Actuators, B, 2003, 93, 338–344 CrossRef CAS.
- B. Liu and E. S. Aydil, Growth of Oriented Single-Crystalline Rutile TiO2 Nanorods on Transparent Conducting Substrates for Dye-Sensitized Solar Cells, J. Am. Chem. Soc., 2009, 131(11), 3985–3990 CrossRef CAS.
- G. K. Mor, S. Kim, M. Paulose, O. K. Varghese, K. Shankar, J. Basham and C. A. Grimes, Visible to Near-Infrared Light Harvesting in TiO2 Nanotube Array-P3HT Based Heterojunction Solar Cells, Nano Lett., 2009, 9(12), 4250–4257 CrossRef CAS.
- J. Li, Y. Qin, C. Jin, Y. Li, D. Shi, L. Schmidt-Mende, L. Gan and J. Yang, Highly ordered monolayer/bilayer TiO2 hollow sphere films with widely tunable visible-light reflection and absorption bands, Nanoscale, 2013, 5, 5009–5016 RSC.
- H. Li, G. Vienneau, M. Jones, B. Subramanian, J. Robichaud and Y. Djaoued, Crack-free 2D-inverse opal anatase TiO2 films on rigid and flexible transparent conducting substrates: low temperature large area fabrication and electrochromic properties, J. Mater. Chem. C, 2014, 2, 7804–7810 RSC.
- H. M. Chen, C. K. Chen, R.-S. Liu, L. Zhang, Ji. Zhang and D. P. Wilkinson, Nano-architecture and material designs for water splitting photoelectrodes, Chem. Soc. Rev., 2012, 41, 5654–5671 RSC.
- S. K. Karuturi, J. Luo, C. Cheng, L. Liu, L. T. Su, A. I. Y. Tok and H. J. Fan, A novel photoanode with three-dimensionally, hierarchically ordered nanobushes for highly efficient photoelectrochemical cells, Adv. Mater., 2012, 24(30), 4157–4162 CrossRef CAS.
- S. K. Karuturi, R. Yew, P. R. Narangari, J. Wong-Leung, L. Li, K. Vora, H. H. Tan and C. Jagadish, CdS/TiO2 photoanodes via solution ion transfer method for highly efficient solar hydrogen generation, Nano Futures, 2018, 2(1), 015004 CrossRef.
- J. I. L. Chen, G. von Freymann, S. Y. Choi, V. Kitaev and G. A. Ozin, Slow photons in the fast lane in chemistry, J. Mater. Chem., 2008, 18(4), 369–373 RSC.
- J. S. King, E. Graugnard and C. J. Summers, TiO2 inverse opals fabricated using low-temperature atomic layer deposition, Adv. Mater., 2005, 17(8), 1010–1013 CrossRef CAS.
- S. G. Romanov, N. P. Johnson, A. V. Fokin, V. Y. Butko, H. M. Yates, M. E. Pemble and C. M. S. Torres, Enhancement of the photonic gap of opal-based three-dimensional gratings, Appl. Phys. Lett., 1997, 70, 2091 CrossRef CAS.
- W. J. Hyun, H. K. Lee, S. S. Oh, O. Hess, C.-G. Choi, S. H. Im and O. O. Park, Two-Dimensional TiO2 Inverse Opal with a Closed Top Surface Structure for Enhanced Light Extraction from Polymer Light-Emitting Diodes, Adv. Mater., 2011, 23, 1846–1850 CrossRef CAS.
- Y. Xu, X. Zhu, Y. Dan, J. H. Moon, V. W. Chen, A. T. Johnson, J. W. Perry and S. Yang, Electrodeposition of Three-Dimensional Titania Photonic Crystals from Holographically Patterned Microporous Polymer Templates, Chem. Mater., 2008, 20(5), 1816–1823 CrossRef CAS.
- G. von Freymann, V. Kitaev, B. V. Lotsch and G. A. Ozin, Bottom-up assembly of photonic crystals, Chem. Soc. Rev., 2013, 42, 2528–2554 RSC.
- H. Li, J. Wang, J. Robichaud, D. Wang, Z. Wu and Y. Djaoued, Silica single-layer inverse opals: large-area crack-free fabrication and the regulation of transmittance in the visible region, J. Mater. Chem. C, 2019, 7, 2978–2986 RSC.
- H. Yan, C. F. Blanford, B. T. Holland, W. H. Smyrl and A. Stein, General Synthesis of Periodic Macroporous Solids by Templated Salt Precipitation and Chemical Conversion, Chem. Mater., 2000, 12, 1134–1141 CrossRef CAS.
- Y. G. Seo, K. Woo, J. Kim, H. Lee and W. Lee, Rapid fabrication of an inverse opal TiO2 photoelectrode for DSSC using a binary mixture of TiO2 nanoparticles and polymer microspheres, Adv. Funct. Mater., 2011, 21, 3094–3103 CrossRef CAS.
- Y. Dong, J. Chao, Z. Xie, X. Xu, Z. Wang and Di Chen, Highly Ordered TiO2 Macropore Arrays as Transparent Photocatalysts, J. Nanomater., 2012, 762510–762515 Search PubMed.
- F. Marlow, M. Muldarisnur, P. Sharifi, R. Brinkmann and C. Mendive, Opals: Status and Prospects, Angew. Chem., Int. Ed., 2009, 48, 6212–6233 CrossRef CAS.
- X. D. Wang, E. Graugnard, J. S. King, Z. L. Wang and C. J. Summers, Large-scale fabrication of ordered nanobowl arrays, Nano Lett., 2004, 4(11), 2223–2226 CrossRef CAS.
- J. C. Lytle, H. Yan, R. T. Turgeon and A. Stein, Multistep, Low-Temperature Pseudomorphic Transformations of Nanostructured Silica to Titania via a Titanium Oxyfluoride Intermediate, Chem. Mater., 2004, 16, 3829–3837 CrossRef CAS.
- E. Graugnard, J. S. King, D. P. Gaillot and G. J. Summers, Sacrificial-Layer Atomic Layer Deposition for Fabrication of Non-Close-Packed Inverse-Opal Photonic Crystals, Adv. Funct. Mater., 2006, 16, 1187–1196 CrossRef CAS.
- J. S. King, E. Graugnard and C. J. Summers, TiO2 inverse opals fabricated using low-temperature atomic layer deposition, Adv. Mater., 2005, 17(8), 1010–1013 CrossRef CAS.
- W. Wang, Y. Liu, T. Xue, J. Li, D. Chen and T. Qi, Mechanism and kinetics of titanium hydrolysis in concentrated titanyl sulfate solution based on infrared and Raman spectra, Chem. Eng. Sci., 2015, 134, 196–204 CrossRef CAS.
- Z. Xing, Z. Li, X. Wu, G. Wang and W. Zhou, In situ S-doped porous anatase TiO2 nanopillars for high-efficient visible-light photocatalytic hydrogen evolution, Int. J. Hydrogen Energy, 2016, 41, 1535–1541 CrossRef CAS.
- H. Khan, Sol–gel synthesis of TiO2 from TiOSO4: characterization and UV photocatalytic activity for the degradation of 4-chlorophenol, Reac. Kinet. Mech. Cat., 2017, 121, 811–832 CrossRef CAS.
- J. Mosquera-Pretelt, M. I. Mejía and J. M. Marín, Synthesis and Characterization of Photoactive S–TiO2 from TiOSO4 Precursor Using an Integrated Sol–Gel and Solvothermal Method at Low Temperatures, J. Adv. Oxid. Technol., 2018, 21(1), 20170008 Search PubMed.
- D. Sofronov, M. Rucki, O. Demidov, A. Doroshenko, E. Sofronova, A. Shaposhnyk, O. Kapustnik, P. Mateychenko and W. Kucharczyk, Formation of TiO2 particles during thermal decomposition of Ti(NO3)4, TiOF2 and TiOSO4, J. Mater. Res. Technol., 2020, 9(6), 12201–12212 CrossRef CAS.
- V. V. Pillai, S. P. Lonkar and S. M. Alhassan, Template-Free, Solid-State Synthesis of Hierarchically Macroporous S-Doped TiO2 Nano-Photocatalysts for Efficient Water Remediation, ACS Omega, 2020, 5, 7969–7978 CrossRef CAS.
- L. Ge, M. Xu, M. Sun and H. Fang, Low-temperature synthesis of photocatalytic TiO2 thin film from aqueous anatase precursor sols, J. Sol-Gel Sci. Technol., 2006, 38, 47–53 CrossRef CAS.
- D. V. Bavykin, E. N. Savinov and P. G. Smirniotis, Kinetics of the TiO2 films growth at the hydrothermal hydrolysis of TiOSO4, React. Kinet. Catal. Lett., 2003, 79(1), 77–84 CrossRef CAS.
- S. Yamabi and H. Imai, Crystal Phase Control for Titanium Dioxide Films by Direct Deposition in Aqueous Solutions, Chem. Mater., 2002, 14, 609–614 CrossRef CAS.
- H. Li, J. Theriault, B. Rousselle, B. Subramanian, J. Robichaud and Y. Djaoued, Facile fabrication of crack-free large area 2D WO3 inverse opal films by a ‘dynamic hard-template’ strategy on ITO substrates, Chem. Commun., 2014, 50, 2184–2186 RSC.
- B. Xiang, Hydrolysis kinetics of TiOSO4, Master degree thesis (in Chinese), Chongqing University, 2001.
- T. Ohsaka, F. Izumi and Y. Fujiki, Ramna spectrum of anatase, TiO2, J. Raman Spectrosc., 1978, 7(6), 321–324 CrossRef.
- F. Tian, Y. Zhang, J. Zhang and C. Pan, Raman Spectroscopy: A New Approach to Measure the Percentage of Anatase TiO2 Exposed (001) Facets, J. Phys. Chem. C, 2012, 116(13), 7515–7519 CrossRef CAS.
- D. Bersani, P. P. Lottici and X.-Z. Ding, Phonon confinement effects in the Raman scattering by TiO2 nanocrystals, Appl. Phys. Lett., 1998, 73, 72–75 Search PubMed.
- S. Balaji, Y. Djaoued and J. Robichaud, Phonon confinement studies in nanocrystalline anatase-TiO2 thin films by micro Raman spectroscopy, J. Raman Spectrosc., 2006, 37, 1416–1422 CrossRef CAS.
- H. Li, J. Wang, S. Li, J. Robichaud, D. Wang, Z. Wu and D. Yahia, Silica single-layer inverse opal films: large-area crack-free fabrication and the regulation of transmittance in the visible region, J. Mater. Chem. C, 2019, 7, 2978–2986 RSC.
Footnote |
| † Electronic supplementary information (ESI) available: Raman spectrum of a 2D TiO2 IO film in the range 100–2000 cm−1, after calcination at 550 °C. See DOI: 10.1039/d0ra10648h |
| This journal is © The Royal Society of Chemistry 2021 |