DOI:
10.1039/D0RA10587B
(Paper)
RSC Adv., 2021,
11, 10512-10523
C![[double bond, length as m-dash]](https://www.rsc.org/images/entities/h2_char_e001.gif) N linked covalent organic framework for the efficient adsorption of iodine in vapor and solution†
N linked covalent organic framework for the efficient adsorption of iodine in vapor and solution†
Received
17th December 2020
, Accepted 7th February 2021
First published on 11th March 2021
Abstract
Volatile nuclear wastes, such as iodine, have received worldwide attention because it poses risks to public safety and pollutes the environment. The efficient capture of radioactive iodine is of vital importance for the safe utilization of nuclear power. Herein, we report a series of stable covalent organic framework (COF) materials with high efficiency to capture radioactive iodine species. Results indicated that all COFs showed high iodine adsorption, which reached up to 5.82 g g−1 in vapor and 99.9 mg g−1 in solution, suggesting that all COFs can be an effective potential adsorbent for the removal of iodine. Furthermore, all COFs are renewable due to the excellent recycling performance. Moreover, all COFs are suitable for large-scale synthesis at room temperature, which have potential for practical applications. Theoretical calculations were also performed to analyze the relationship between iodine molecules and COFs, offering mechanisms underlying the potent adsorption abilities of COFs.
1 Introduction
The demand of nuclear energy in the world continues to grow due to its ultrahigh energy density and low carbon emissions. However, there is an increasing concern on nuclear hazardous wastes caused by nuclear accidents. The nuclear disaster caused by Chernobyl in 1986 and later by Fukushima in 2011 have attracted serious attention on the efficient removal and reliable storage of radioactive nuclear wastes. These disasters also have aroused health concern on local residents regarding a possibility of low birthweight or preterm births,1,2 malformed fetuses,3,4 thyroid cancer5,6 and others, which may be caused by the radioactive nuclear waste leakage. Radiological iodine (129I and 131I) is one of these main waste streams with half-lives of 8 days and 15.7 million years, respectively. Radiological iodine could also contaminate solid waste-processing systems, and then release it to the public environment. Besides, radioactive iodine disperses rapidly into air and dissolves in water in different forms, which further complicate the removal requirements. The efficient capture and storage of radioactive nuclear wastes are vital for the safe utilization of nuclear energy.
Currently, many adsorbents, including inorganic porous materials,7–11 organic porous materials, and inorganic–organic hybrid porous materials, have been developed for radiological iodine capture and storage. Among them, inorganic adsorbents,7,8 such as ion-exchange zeolites9,12,13 and silver-functionalized silica aerogels,10,11 usually exhibit high cost, low uptake capacities and instability toward water and moisture. In recent years, metal–organic frameworks (MOFs)14–20 and porous organic polymers (POPs),21–25 which include conjugated microporous polymers (CMPs),25,26 covalent triazine frameworks (CTFs),27 charged porous aromatic frameworks (PAFs)21,28,29 and covalent organic frameworks (COFs),24,30–41 have attracted a lot of attention for worthwhile iodine capture. POPs have been found to exhibit high potential for iodine capture and storage due to their high surface area, and the high interaction between adsorbents and iodine. COFs not only have the most advantages of POPs, but also have highly ordered internal structures, controllable pore shapes and sizes. The crystalline porous structure of COF has provided an excellent skeleton for hosting the iodine species. For example, some COFs32,38 (TPB-DMTP COF, 6.2 g g−1; QTD-COF-V, 6.29 g g−1) have achieved more than 6 g g−1 iodine uptake. A fast and effective design or screen method of high iodine capture COFs is meaningful for radiological nuclear waste capture and storage. Many previous studies have been conducted to reveal the iodine adsorption mechanisms between guest molecules and POPs. Charge transfer (CT) is one of the most common methods used to explain the iodine adsorption phenomenon. Based on the CT theory, the adsorbent-containing oxidizing component would partially or completely transform the adsorbed iodine molecules into polyiodide anions. The strong interaction between the adsorbent and polyiodide would bind to the iodine molecules and the adsorbent tightly to achieve high iodine capture capability. Another theory suitable for 2D COFs was proposed by Jiang and his co-workers in 2018, in which the iodine uptake only depended on the COF's 1D channels. Both CT and Jiang's theory had been successfully employed to interpret many 2D COF iodine adsorption phenomena.
The carbon–nitrogen linked COFs41–43 are a large series of COFs, which are known for their high thermal stability and good chemical resistance. The C![[double bond, length as m-dash]](https://www.rsc.org/images/entities/char_e001.gif) N bond of this type of COFs are normally polar, which could be considered as a Lewis structure that would bind with the iodine molecules and the COFs tightly, according to the CT theory. Besides, many of the CN linked COFs exhibit excellent controllable pore size, which range from microporous to mesoporous. The large pore size obviously allows more iodine molecules to fulfill COF's 1D channels to achieve greater iodine uptake.
N bond of this type of COFs are normally polar, which could be considered as a Lewis structure that would bind with the iodine molecules and the COFs tightly, according to the CT theory. Besides, many of the CN linked COFs exhibit excellent controllable pore size, which range from microporous to mesoporous. The large pore size obviously allows more iodine molecules to fulfill COF's 1D channels to achieve greater iodine uptake.
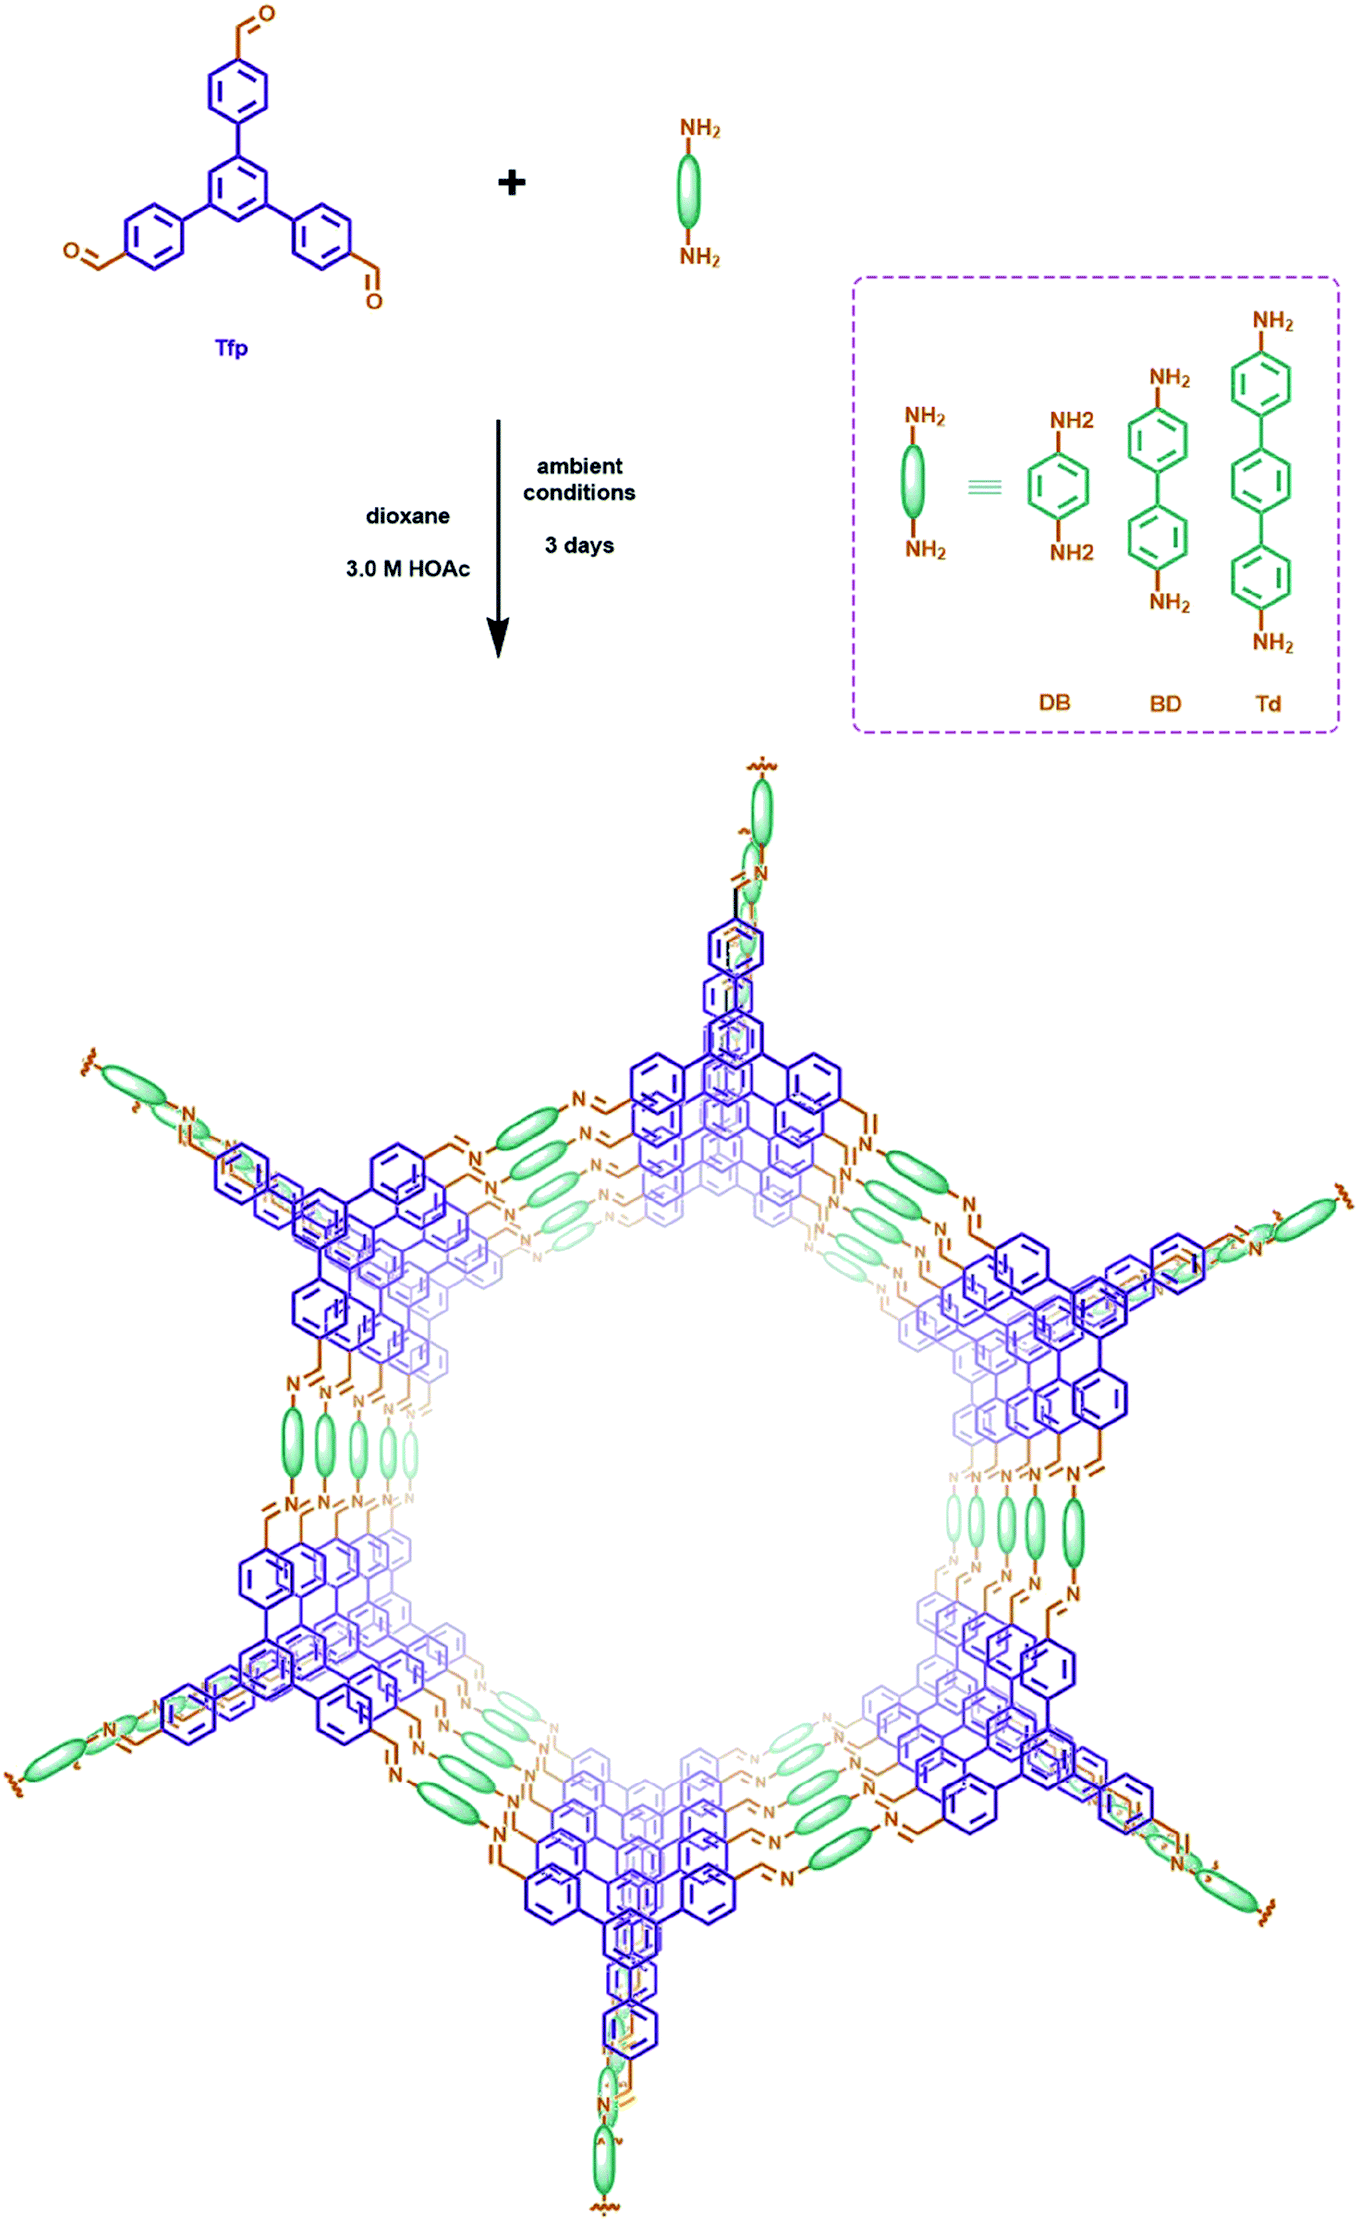
Here, we successfully synthesized a series of CN linked COFs (Tfp–DB COF, Tfp–BD COF and Tfp–Td COF) with maximized pore size from 3.89 nm to 5.63 nm. The large pore size permits the iodine molecules to pass through the COFs open channels. The Lewis acid–base interactions between the polar C–N bond and the iodine molecules also increase the uptake capacity. Meanwhile, the large pore size of the CN linked COFs have the capability to be fully accessible to iodine, which perfectly meet Jiang's theory. In this study, all three COFs achieved high iodine capacity, which were 5.82, 5.42 and 4.45 g g−1, respectively. Furthermore, theoretical calculations were performed to study the interaction between the C–N bond and the iodine molecules. Moreover, we propose a straightforward synthesis method of CN linked COFs at room temperature, which can facilitate the large-scale production for practical use without rigorous synthetic conditions.
2 Results and discussion
2.1 Experimental results
2.1.1 Structure and compositions. Three different pore size imine-linked COF in this study were synthesized through Schiff-base condensation reaction, which is illuminated in Scheme 1. Then, the structures of the COFs were verified by powder X-ray diffraction (PXRD), Fourier transform infrared (FT-IR) spectroscopy, solid-state NMR spectroscopy, and X-ray photoelectron spectroscopy (XPS) to make sure their structures were expected and consistent with previous studies. The PXRD analysis showed that all three COFs were well crystallized. In addition, the PXRD patterns of COFs agreed with our simulation results (Fig. S1, ESI†), which suggested that the structures were desired.
 |
| | Scheme 1 Synthesis of Tfp–DB COF, Tfp–BD COF and Tfp–Td COF. | |
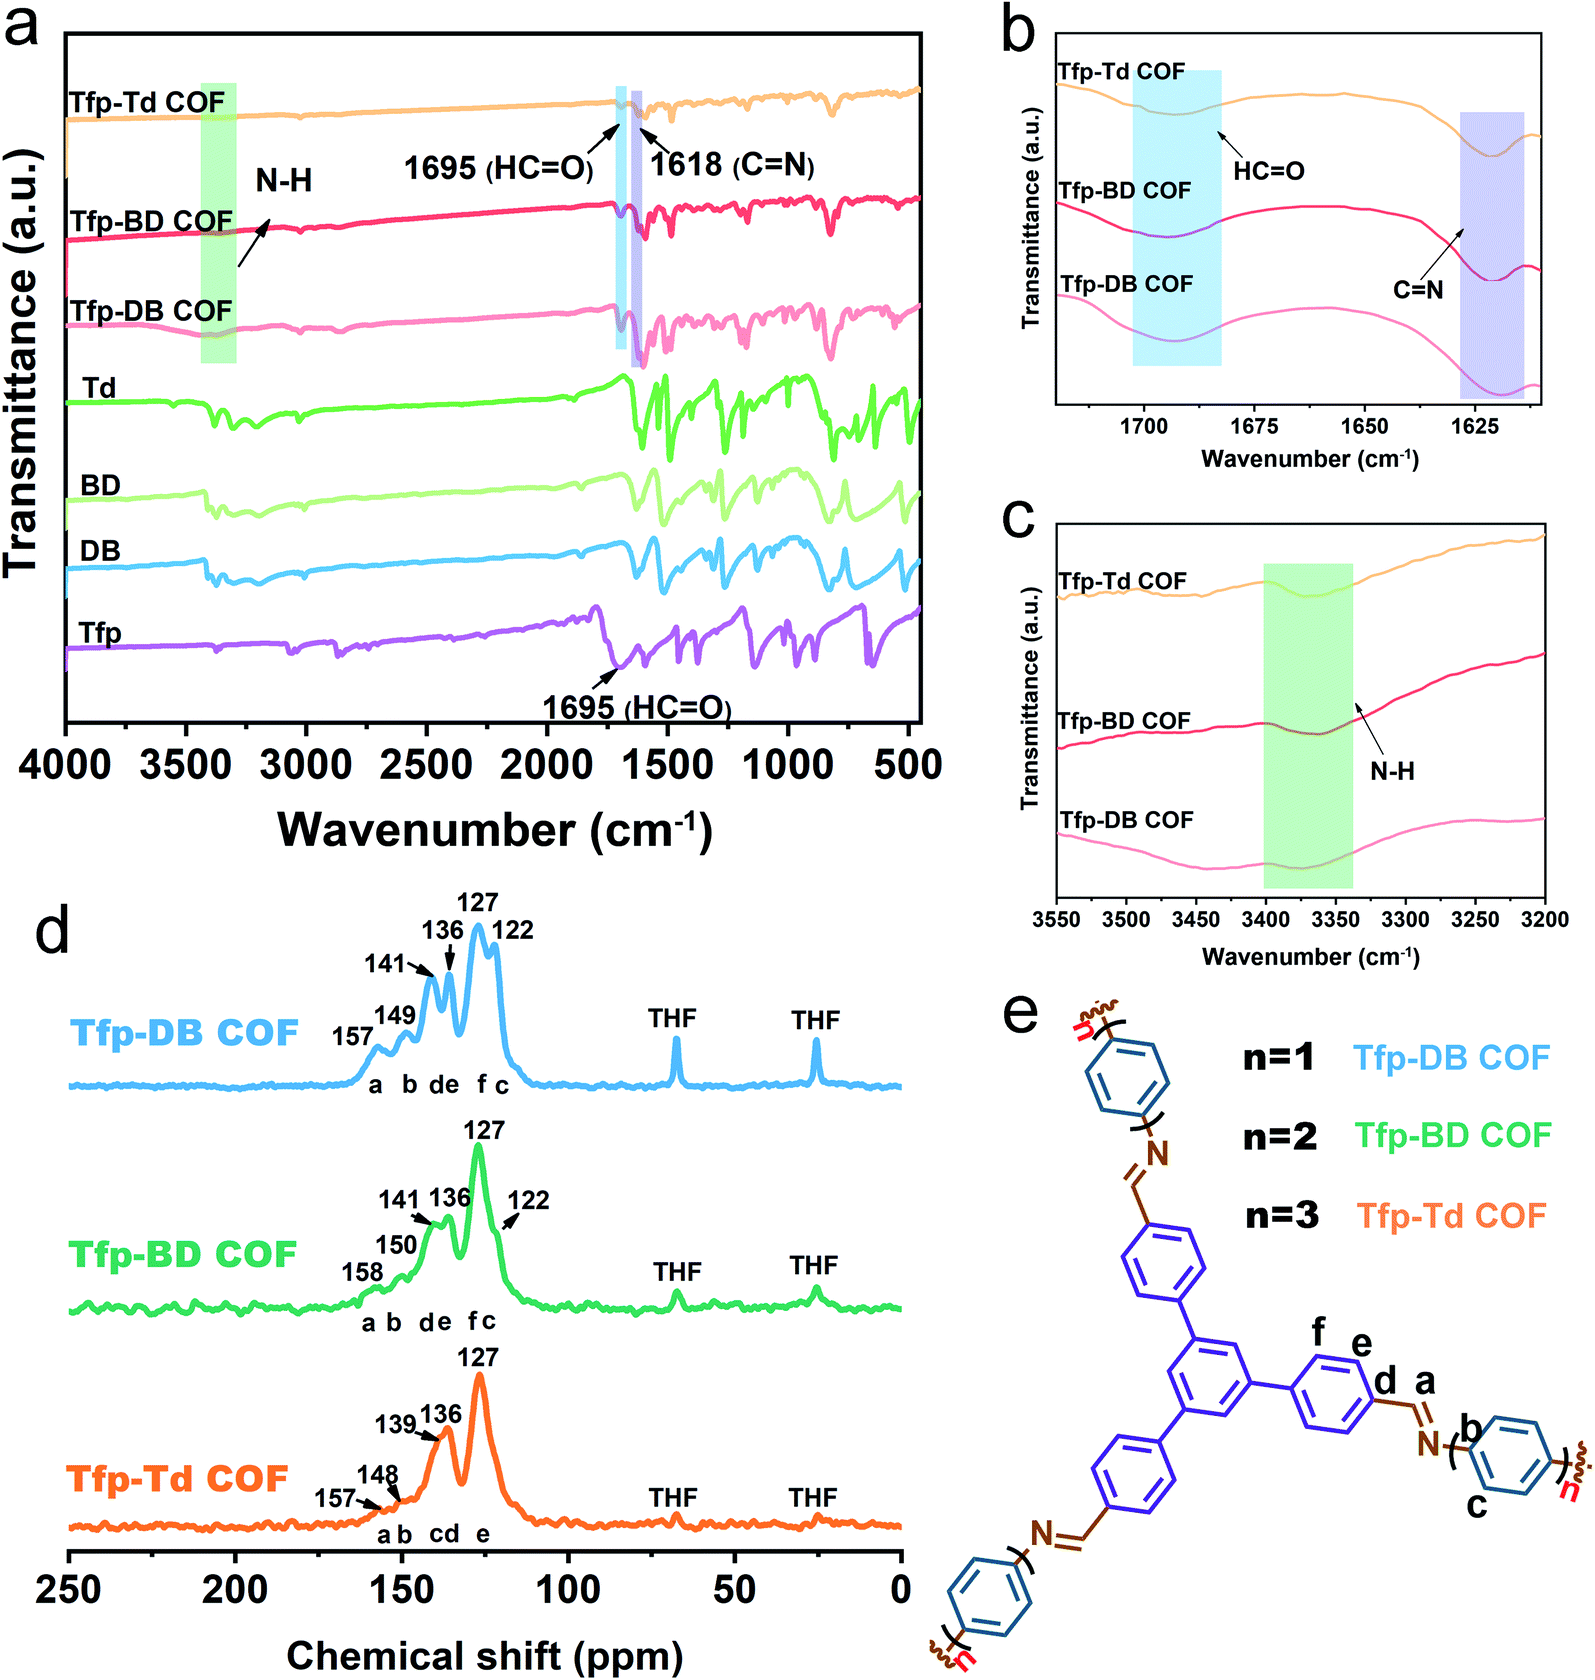
The FT-IR spectrum showed that there was a strong CN stretch vibration peak at 1618 cm−1 for Tfp–DB COF (pink), Tfp–BD COF (red) and Tfp–Td COF (orange), indicating the formation of imine bonds. Compared with the raw materials, the aldehyde group peaks at 1695 cm−1 and the stretching vibration peak of the amino group (3300–3400 cm−1) were obviously weakened, which indicated the consumption of the aldehyde group and amine group in the reaction. The remaining weak peaks at 1695, 3361 and 3417 cm−1 belong to the aldehyde group and amine group residue at the edges of the COF structures. The atomic-level construction of three kinds of COF were further verified by solid-state carbon NMR spectroscopy. As shown in Fig. 1d, the 13C NMR peak at 157 ppm corresponds to the carbon atom on the imine bond, which also confirmed the formation of the imine bonds. The signal peaks of 68 ppm and 25 ppm were the characteristic peaks of the solvent THF residual in COF. All three COF powders were further purified by THF and dried in vacuum at 80 °C for 12 hours, but there was still a small amount of THF remaining in the pores of the COF powders. The remaining THF had little effect on the following iodine adsorption experiments.
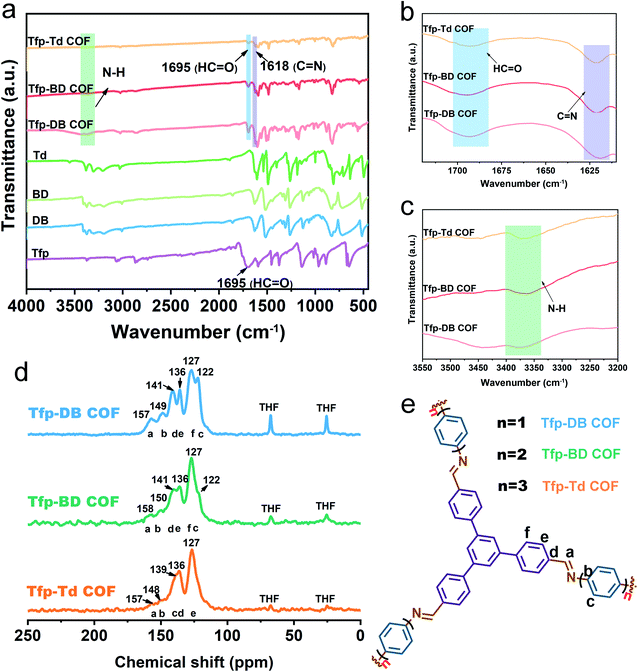 |
| | Fig. 1 FT-IR and 13C NMR spectra of COFs and raw materials. (a) The IR spectra of Tfp, DB, BD, Td, Tfp–DB COF, Tfp–BD COF, and Tfp–Td COF (from bottom to top). (b) Magnification of the ν(CO) and ν(CN) regions. (c) Magnification of the ν(N–H) region. (d) 13C NMR spectra of Tfp–DB COF (blue), Tfp–BD COF (green), Tfp–Td COF (orange). (e) Schematics of COFs. | |
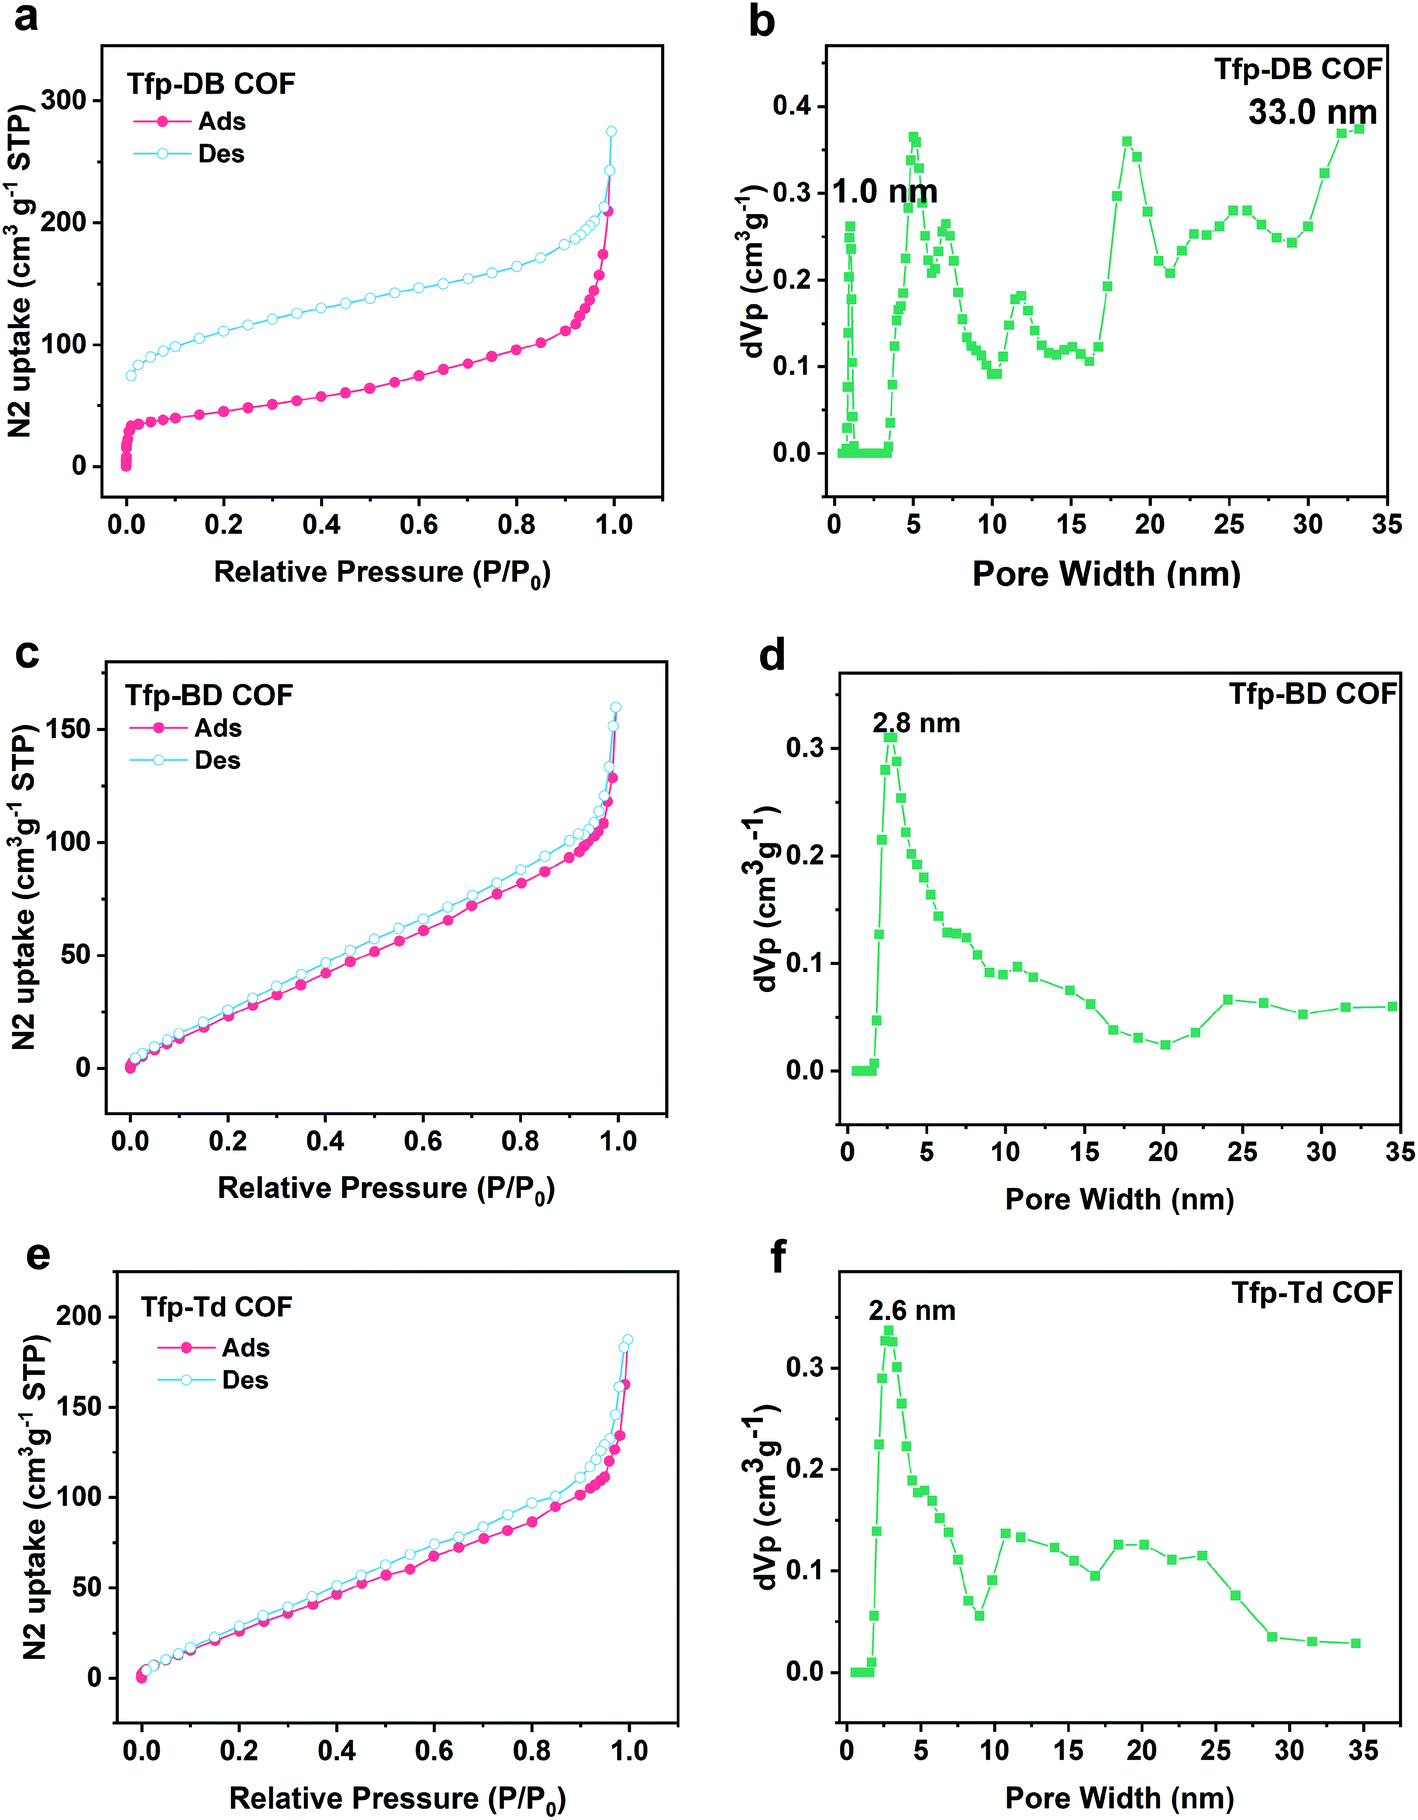
Similar to the previous studies, the hexagonal ring 2D nets showed a crystallographic diameter of ∼3.78, 4.63 and 5.48 nm for Tfp–DB COF, Tfp–BD COF and Tfp–Td COF, respectively. The experimental pore diameters and surface area of all of the materials were measured by fitting the N2 adsorption isotherms at 77 K. As shown in Fig. 2, the typical type II adsorption isothermal curve fitted well to the Tfp–DB COF, Tfp–BD COF and Tfp–Td COF data. The Brunauer–Emmett–Teller BET surface areas of the COFs of Tfp–DB COF, Tfp–BD COF and Tfp–Td COF were 158.35 m2 g−1, 138.01 m2 g−1 and 144.51 m2 g−1, respectively (Fig. S8, ESI†). The QSDFT (Quench Solid Density Function Theory) calculations showed that the average pore diameters of the three COFs were mainly centered at 1.0–33 nm, 2.8 nm and 2.6 nm for Tfp–DB COF, Tfp–BD COF and Tfp–Td COF, respectively. The pore volumes were 0.43 cm3 g−1, 0.25 cm3 g−1 and 0.29 cm3 g−1 for Tfp–DB COF, Tfp–BD COF and Tfp–Td COF, respectively.
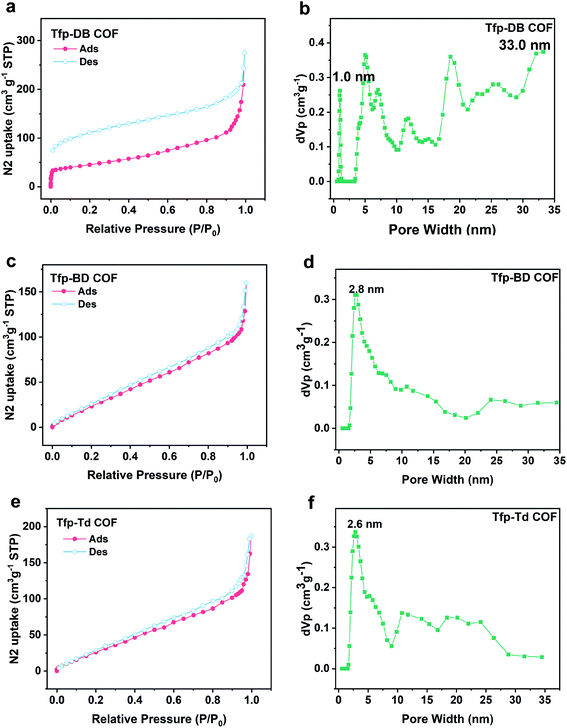 |
| | Fig. 2 N2 adsorption and desorption isotherms of COFs. (a) Tfp–DB COF, (c) Tfp–BD COF, (e) Tfp–Td COF. Pore-size distribution profile of COFs. (b) Tfp–DB COF, (d) Tfp–BD COF, (f) Tfp–Td COF. | |
2.1.2 Iodine adsorption.
2.1.2.1 Adsorption of iodine vapor. In this paper, the iodine vapor adsorption capacity of all three materials was studied by gravimetric method at various interval times. All three COFs exhibited fast iodine adsorption rates in the initial 0–1440 min, as shown in the adsorption curve (Fig. 3a). After that, the adsorption rate gradually slowed down. After the first 4320 min (72 h), all three COFs had reached their maximum saturation. The corresponding iodine adsorption capacities of Tfp–DB COF, Tfp–BD COF and Tfp–Td COF were 5.82 g g−1, 5.42 g g−1 and 4.45 g g−1, respectively. During the process of iodine adsorption, the color of all three materials changed from yellow to black. The iodine-laden COFs could be rinsed in ethanol to release the adsorbed iodine for reuse in the next cycle. The iodine uptake of different porous adsorbents in vapor is summarized in Fig. S9, and tabulated in Table S1 in the ESI.†
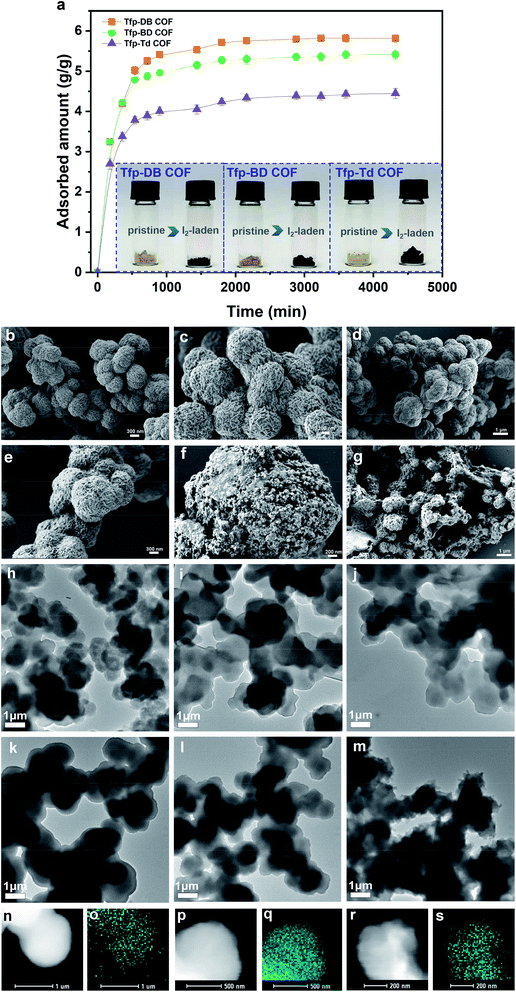 |
| | Fig. 3 (a) Adsorption curves of the investigated COFs at 75 °C in saturated iodine vapor (Inset: photographs of the COFs, pristine and after exposure to iodine vapor for 72 h). SEM images of (b) pristine Tfp–DB COF, (c) pristine Tfp–BD COF, (d) pristine Tfp–Td COF, (e) I2-laden Tfp–DB COF, (f) I2-laden Tfp–BD COF, (g) I2-laden Tfp–Td COF. TEM images of (h) pristine Tfp–DB COF, (i) pristine Tfp–BD COF, (j) pristine Tfp–Td COF, (k) I2-laden Tfp–DB COF, (l) I2-laden Tfp–BD COF, (m) I2-laden Tfp–Td COF. (n) STEM of iodine-laden Tfp–DB COF, (o) I-L elemental mapping images of iodine-laden Tfp–DB COF, (p) STEM of iodine-laden Tfp–BD COF, (q) I-L elemental mapping images of iodine-laden Tfp–BD–BD COF, (r) STEM of the iodine-laden Tfp–Td COF, (s) I-L elemental mapping images of the iodine-laden Tfp–Td COF. | |
Furthermore, scanning electron microscope (SEM) and transmission electron microscope (TEM) images of the morphologies were used to characterize the microstructure of the iodine-laden COFs. As shown in Fig. 3b–d, before the iodine adsorption, all three COFs were spherical with relatively regular morphology and layered arrangement. After iodine had been adsorbed into the COFs, Tfp–DB COF kept its original spherical structure, but Tfp–BD COF and Tfp–Td COF shrank to a shrunken balloon structure (Fig. 3e–g). More importantly, the scanning transmission electron microscopy (STEM) and elemental mapping images (Fig. S2a–c, ESI†) results (Fig. 3k–m) showed that the iodine was filled in the COFs pores.
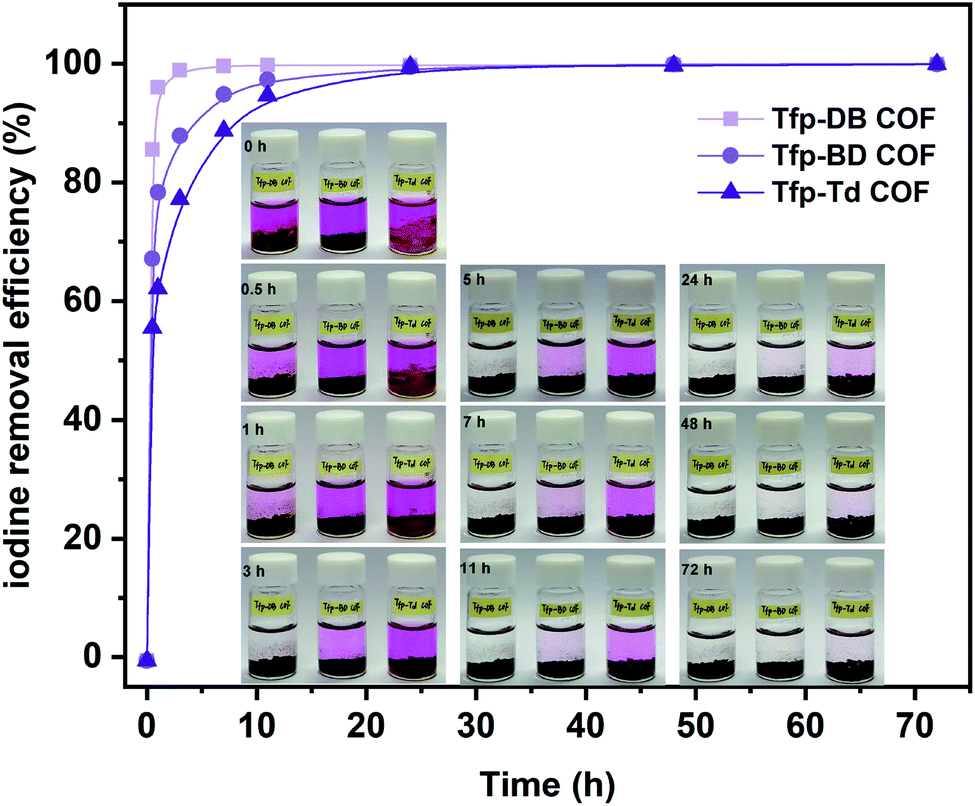
2.1.2.2 Adsorption of iodine in solution. Meanwhile, the capacity of all three COFs in iodine/n-hexane solution were also performed. As shown in the inset of Fig. 4, the solution color gradually changed from dark purple to colorless over time. In the meantime, the COFs powder gradually changed from yellow to black, which indicated that iodine had been adsorbed into the COFs. In the initial 0–3 h, the adsorption rate of iodine by Tfp–DB COF was significantly faster than the other two COFs, which caused the iodine removal efficiency to be higher than Tfp–BD COF and Tfp–Td COF. After 72 h, all three COFs had removed 99.9% iodine from the iodine/hexane solution.
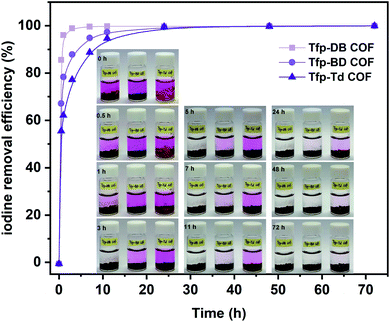 |
| | Fig. 4 The iodine removal efficiency by COFs in iodine/n-hexane solution (Inset: photographs of the process of iodine uptake after COFs were immersed in iodine/n-hexane solution (0.5 mg mL−1, 3 mL)). | |
2.1.3 Iodine release. The iodine would be released by heated (Table 1). In this paper, the thermal iodine desorption of all three COF materials were performed at 120 °C by gravimetric method. At the initial stage, the rate of iodine release was very fast in the initial 0–625 min, and then tended to slow down (Fig. S3, ESI†). After 3260 minutes, the final iodine release rates were 86.52%, 83.80% and 77.50%, corresponding to I2-laden Tfp–DB COF, I2-laden Tfp–BD COF and I2-laden Tfp–Td COF, respectively. There was an abundance of residual iodine in the COFs, indicating the strong binding between the iodine molecules and our COFs.
Table 1 Thermal treatment of I2-laden COFs at 120 °C for 54 h
| Sample |
Residual iodine in percentage |
| I2-laden Tfp–DB COF |
13.48% |
| I2-laden Tfp–BD COF |
16.20% |
| I2-laden Tfp–Td COF |
22.50% |
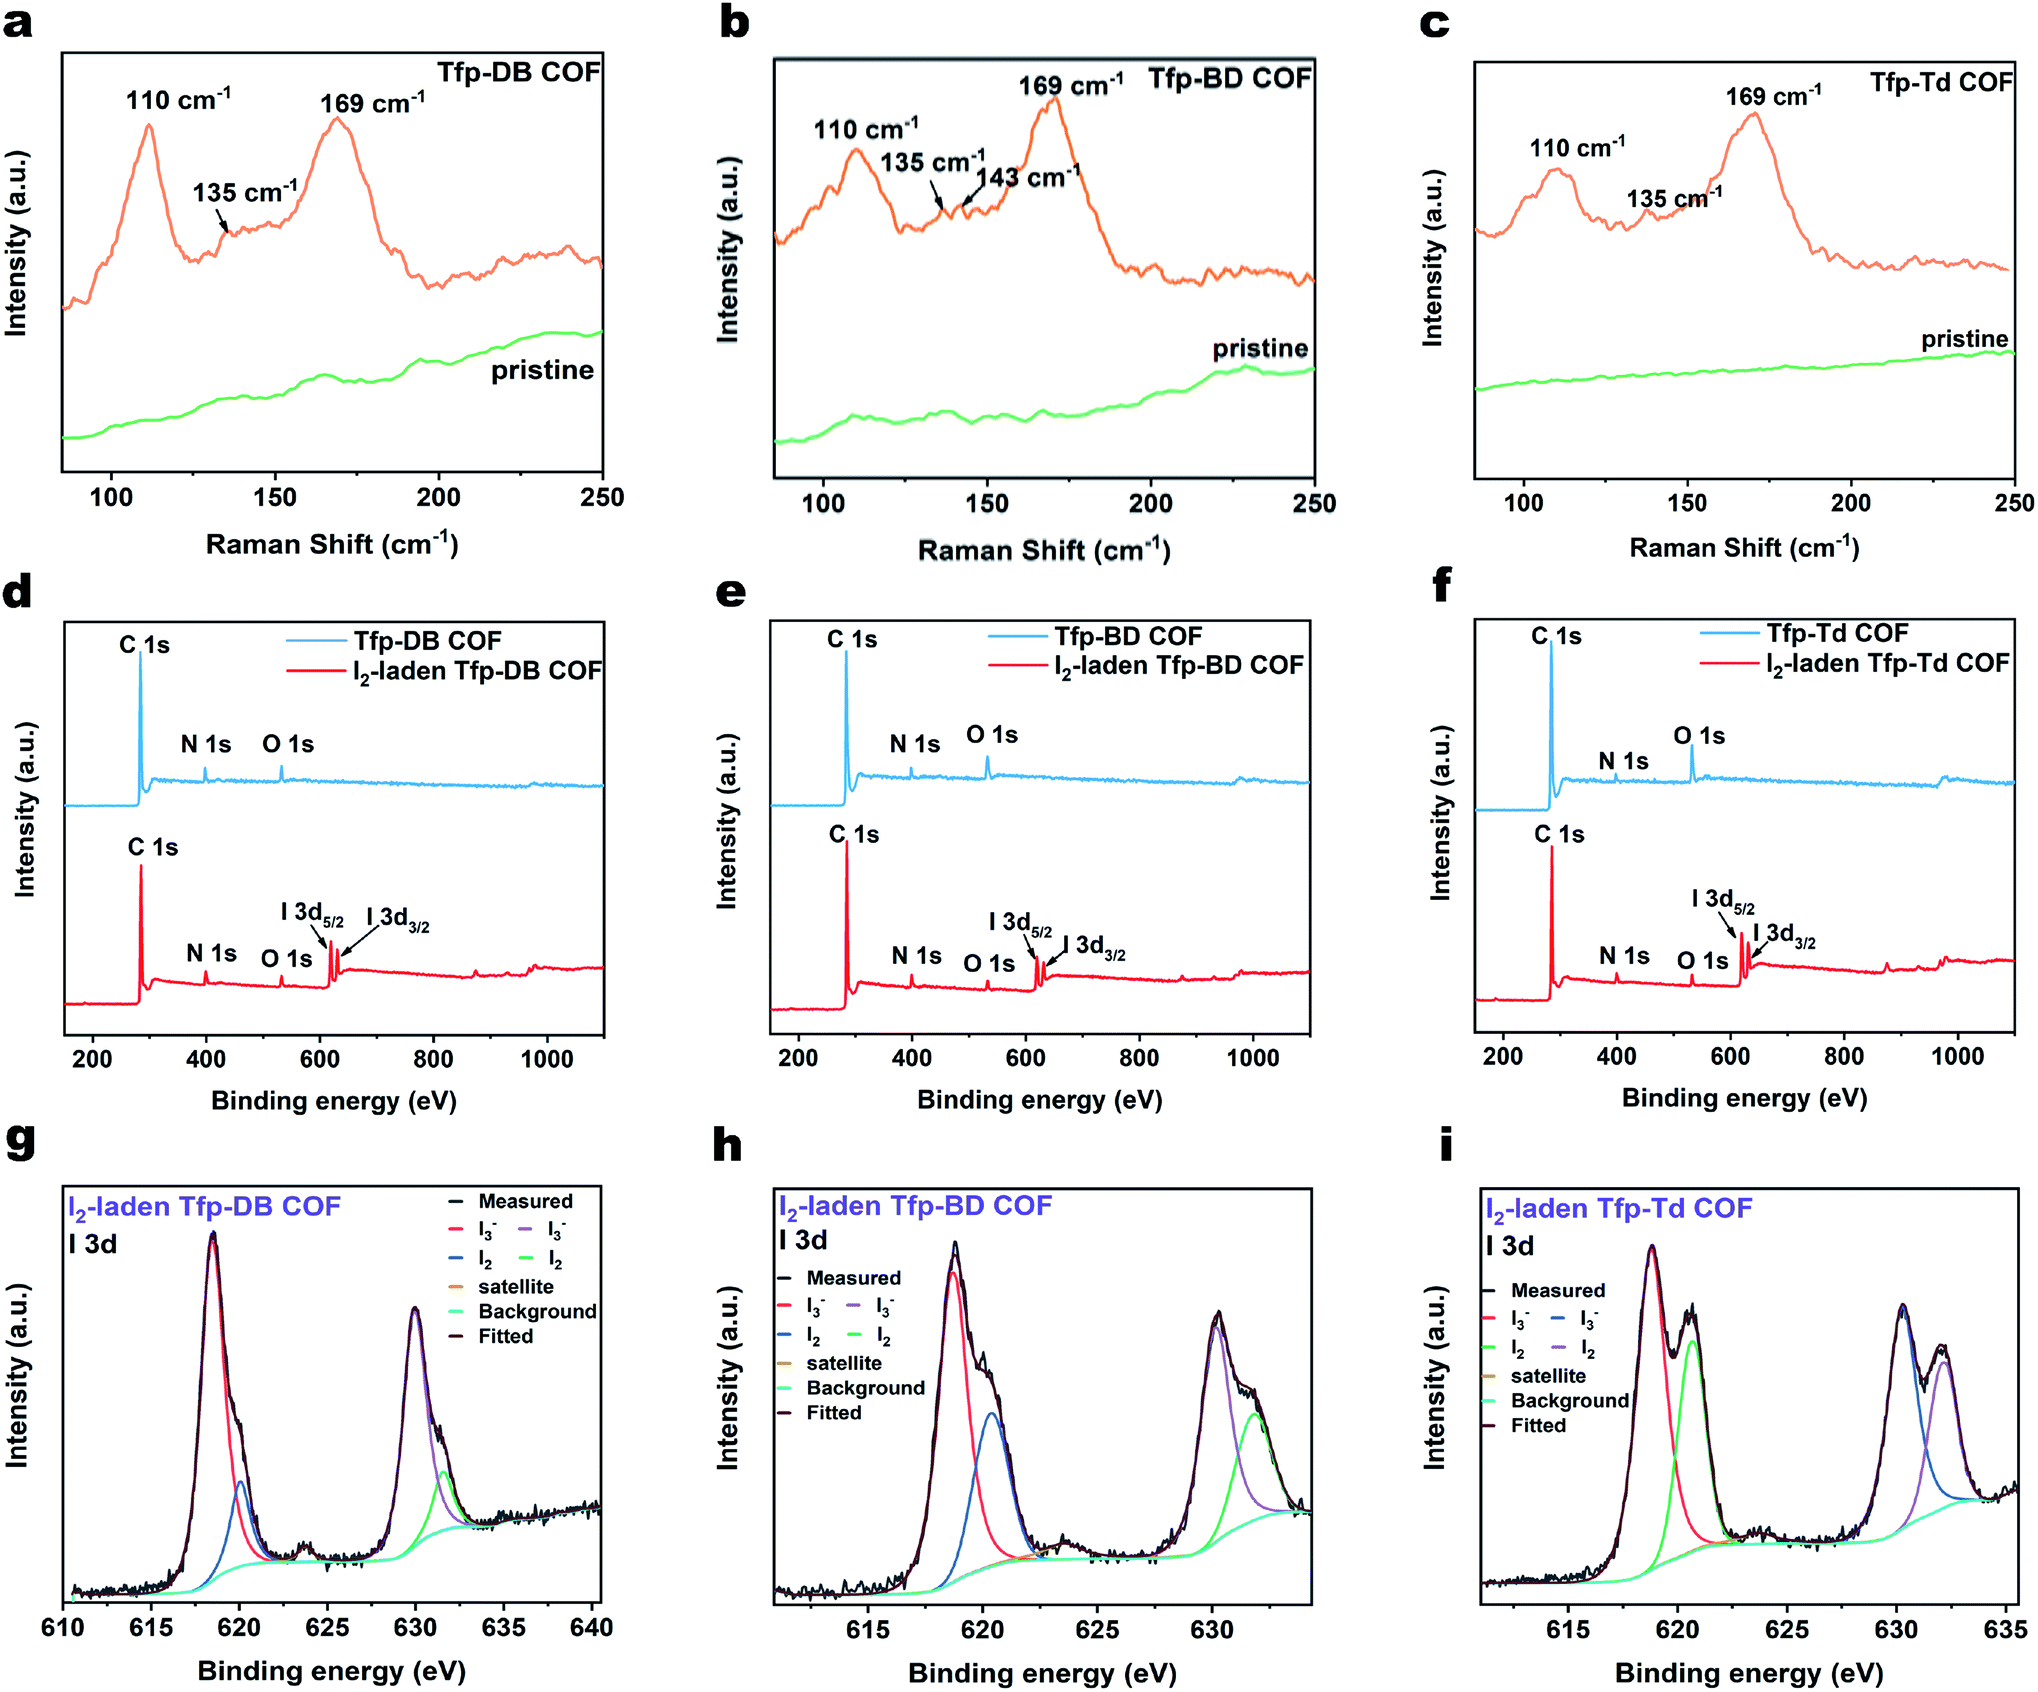
2.1.4 Absorbed iodine chemical state. In order to investigate the chemical valence state of iodine in the COF material after iodine adsorption, Raman and XPS spectroscopy were employed. The Raman results showed that in the iodine-laden COFs, all three materials had the strongest peak at 169 cm−1, which was consistent with coordinated pentaiodides I5− (Fig. 5a–c, orange). The peaks at 110, 135 and 169 cm−1 were attributed to the perturbed diiodine molecules and asymmetric stretching (νas) of I3− ions for polyiodides [I3−·I2], respectively (Fig. 5a–c). The peaks at 143 and 169 cm−1 of Tfp–BD COF was attributed to the perturbed diiodine units for [I−·(I2)2] (Fig. 5b). XPS spectroscopy was used to further confirm the detailed atomic structure and species in the I2-laden COFs. There were two obviously split peaks that appeared at 630.08 eV and 619.08 eV in the survey spectra of the I2-laden COFs, which were deconvoluted into the iodine adsorbed into the COFs. The high-resolution XPS spectra provided more details of the iodine chemical state, showing that there were two components or chemical states of all three COFs. The peaks at 618.39 eV (red) and 629.86 eV (purple) could be assigned to the neutral iodine I3− doublet signals, respectively, while the peaks at 631.55 eV (green) and 620.05 eV (blue) could be assigned to the I2 doublet signals, respectively. The Raman and XPS spectral results indicated that the I2, I3− and I5− were the dominating species of the iodine-laden COFs.
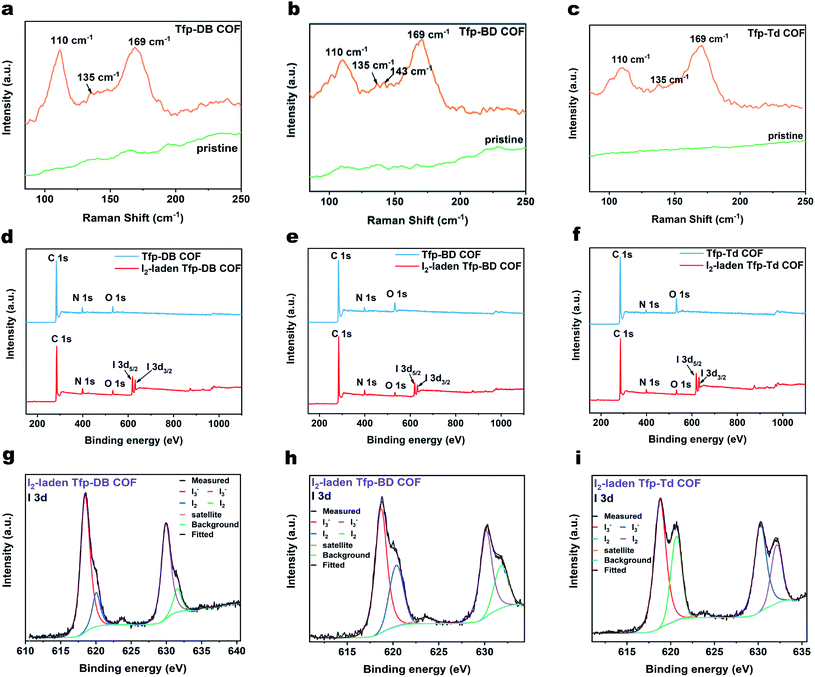 |
| | Fig. 5 Raman spectra of pristine COFs and I2-laden COFs. (a–c) Raman spectra of pristine COFs (green) and I2-laden COFs (orange). XPS spectra of COFs and I2-laden COFs. (d) Survey XPS spectra of pristine Tfp–DB COF, (e) Survey XPS spectra of pristine Tfp–BD COF, (f) survey XPS spectra of pristine Tfp–Td COF, (g) Iodine high-resolution XPS spectra of I2-laden Tfp–DB COF, (h) Iodine high-resolution XPS spectra of I2-laden Tfp–BD COF, (i) iodine high-resolution XPS spectra of I2-laden Tfp–Td COF. | |
2.1.5 Stability of COFs. The thermogravimetric analysis (TGA) was conducted to evaluate the thermal stability of COFs. The results indicated that all three COFs have good heat resistance, which was up to 400 °C (see Fig. S4a–c (orange), ESI† for more detail). When the temperature increased to higher than 400 °C, the skeleton of all three COFs began to collapse. When the temperature was heated to 500 °C, the total weight loss of three COFs was 16%. Even at 1000 °C, there was still about 47% residue in the three COF materials. Meanwhile, the main weight loss of the three iodine-laden COFs (Fig. S4a–c,† green) was attributed to the desorption of iodine, and the weight loss of iodine is about 53% under 400 °C. The COFs also exhibited stability in organic solvents. The COFs powder were immersed in different organic solvents for one week and the crystal structure could be kept, which suggested the chemical stability of the COFs (Fig. S5, ESI†).
2.1.6 Recyclability of COFs. The recyclability investigations of the vapor and solution iodine-laden COFs were both conducted with ethanol rinse to release the iodine. The color of the COFs was getting lighter as the iodine was released into the ethanol solution, while the color of the ethanol solution got darker. The 5 cycles recyclability of the COFs for iodine vapor adsorption is depicted in Fig. S6.† The iodine adsorption capacity of COFs was 1.61 g g−1, 1.78 g g−1 and 1.71 g g−1, corresponding to Tfp–DB COF, Tfp–BD COF and Tfp–Td COF, respectively. The recyclability of COFs for iodine uptake in n-hexane solution is shown in Fig. S7.† After five cycles, the iodine adsorption capacity of COFs still retained more than 99.9 mg g−1, and the removal efficiency of iodine retained up to 99%, which indicated that the COFs had good recyclability. This excellent recycling performance of the COFs suggested that the COFs could be a potential candidate for iodine adsorbents.
2.2 Theoretical calculation analysis
Theoretical calculations of DFT were performed to analyze the interaction between the iodine molecules and COFs. According to previous studies, the iodine uptake of COF was mainly affected by the binding energy between the iodine molecules and COFs skeleton, and the inner pore of the 2D COF itself. To fully understand the iodine adsorption behavior, all of the possible adsorption sites inside the COFs pores were investigated, along with polyiodides. Although many polyiodide conformations had been detected in the experiment, the high polymerization (In−) normal could be considered as In−3·I3−. In this study, I2 and I3− were used as the fundamental guest iodine to screen the potential adsorption functional groups and adsorbents.
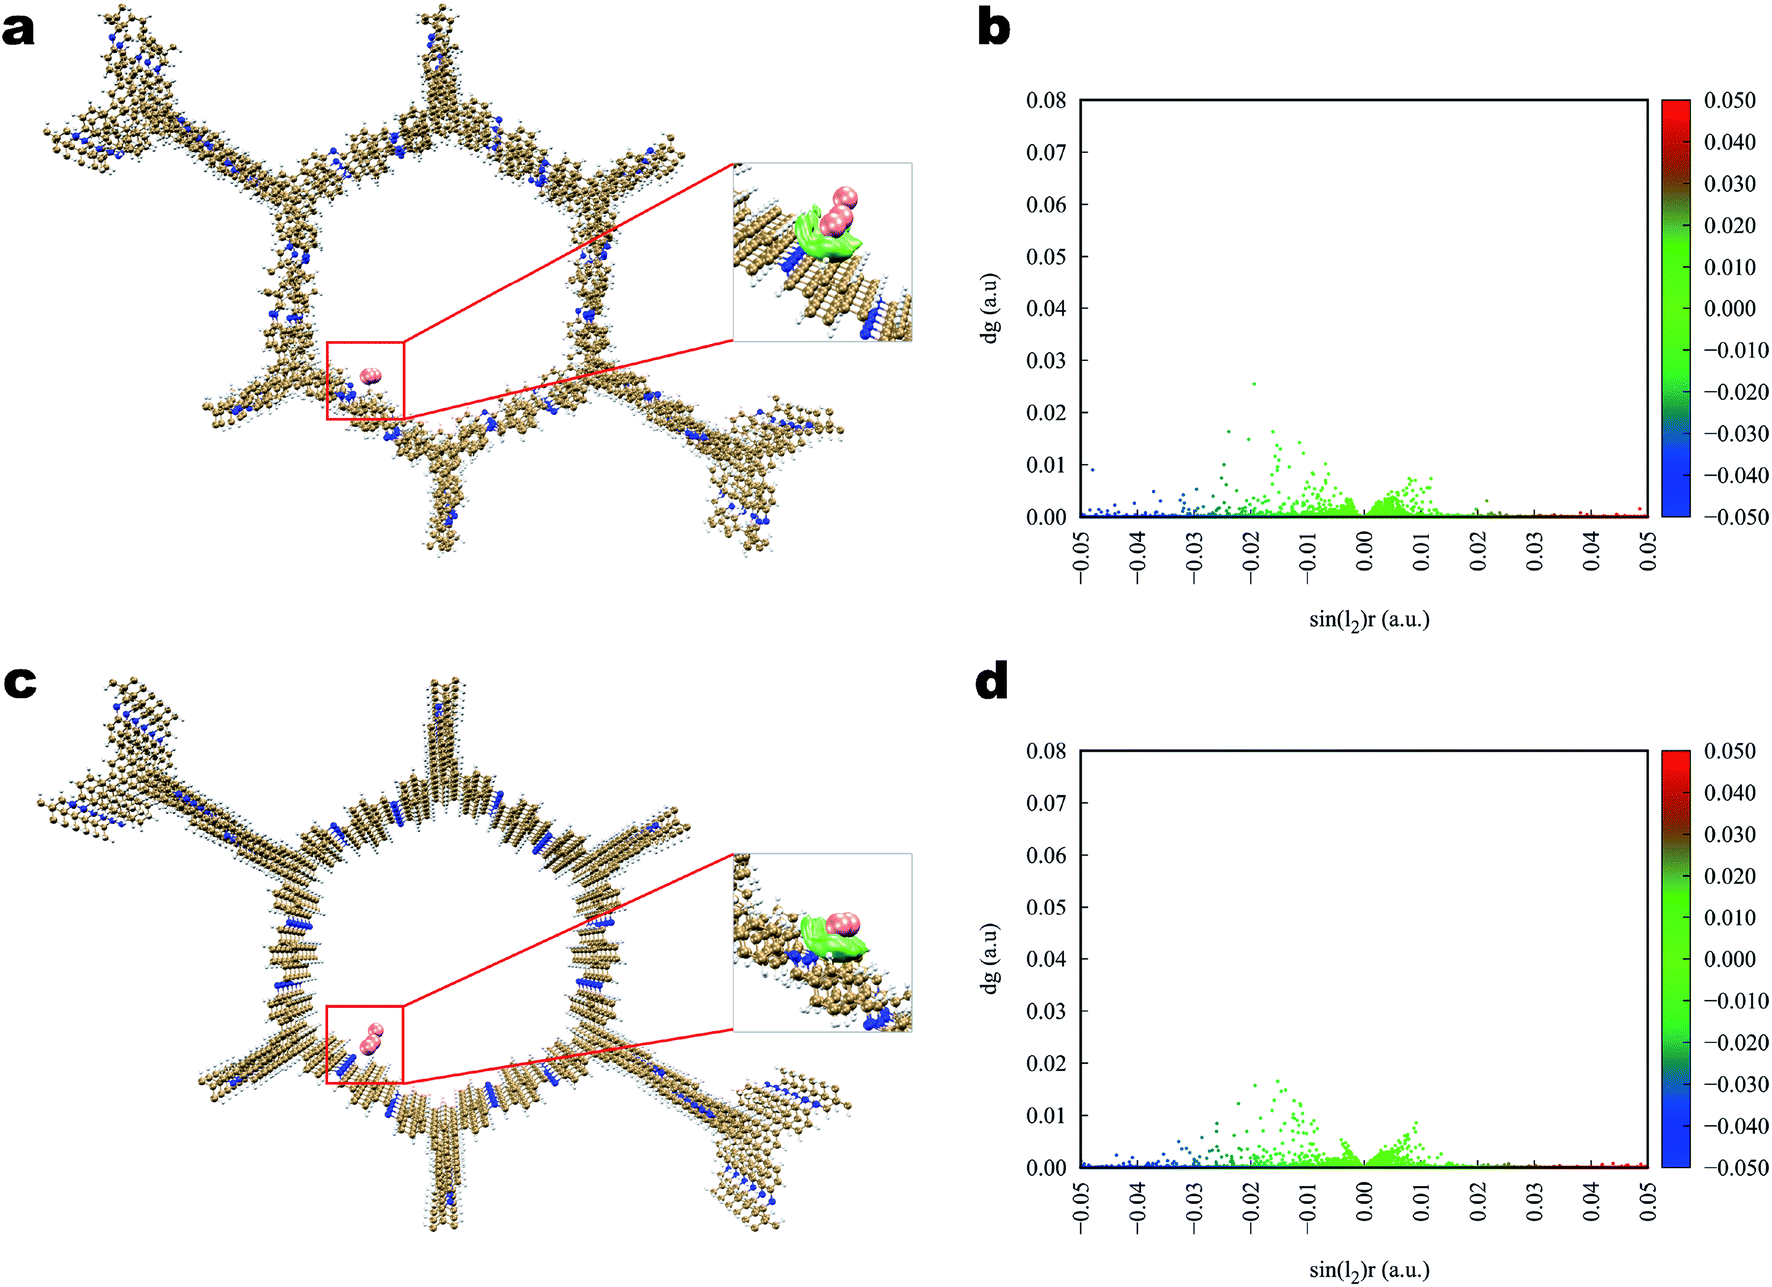
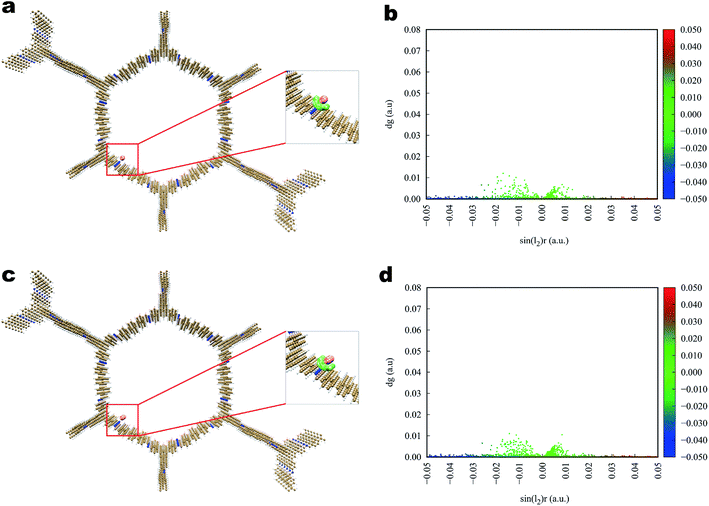
The interaction of iodine toward Tfp–DB is illustrated in Fig. 6. The calculation results showed that the iodine, both I2 and I3−, was used to bind to the amine group of Tfp–DB, which linked the Tfp and the DB, rather than the benzene group in the COF. The average binding distances between I2 and the amine group was 3.38 angstrom (Å), which was shorter than the I3− 3.40 Å counterpart. The corresponding adsorption energies of I2 and I3− were −26.36 and −60.55 kcal mol−1, respectively (Table 2). The distances and adsorption energies of I3− at the amine and benzene group sites suggested that the anion I3− had strongly bound to Tfp–DB. The interactions between iodine and Tfp–DB were further quantified and identified by using an independent gradient model (IGM) descriptor (δginter). The IGM descriptor δg vs. sin(λ2)ρ electronic density of I2 and Tfp–DB fragments was plotted in Fig. 6b. The small sharp spikes marked in the red color in the low-δg region of Fig. 6b suggested that the strength of the interaction between Tfp–DB and I2 was up to the hydrogen-bond interaction level. A more detailed 3D iso-surface was also used to show the interaction between Tfp–DB and I2 (Fig. 6a inset). Obviously, the neutral I2 molecules were attracted by the multilayer of Tfp–DB COF, which created a stereoscopic layer interaction network. The IGM results of I3− (Fig. 6c inset) also showed the similar phenomenon of I2.
 |
| | Fig. 6 Simulated characterization of the iodine species capturing sites and IGM scatter plot of Tfp–DB COF. (a and b) I2; (c and d) I3−. | |
Table 2 The binding energy of COFs
| Adsorbent |
I2 kcal mol−1 |
I3− kcal mol−1 |
| Tfp–DB COF |
−26.36 |
−60.55 |
| Tfp–BD COF |
−23.66 |
−59.70 |
| Tfp–Td COF |
−16.57 |
−51.12 |
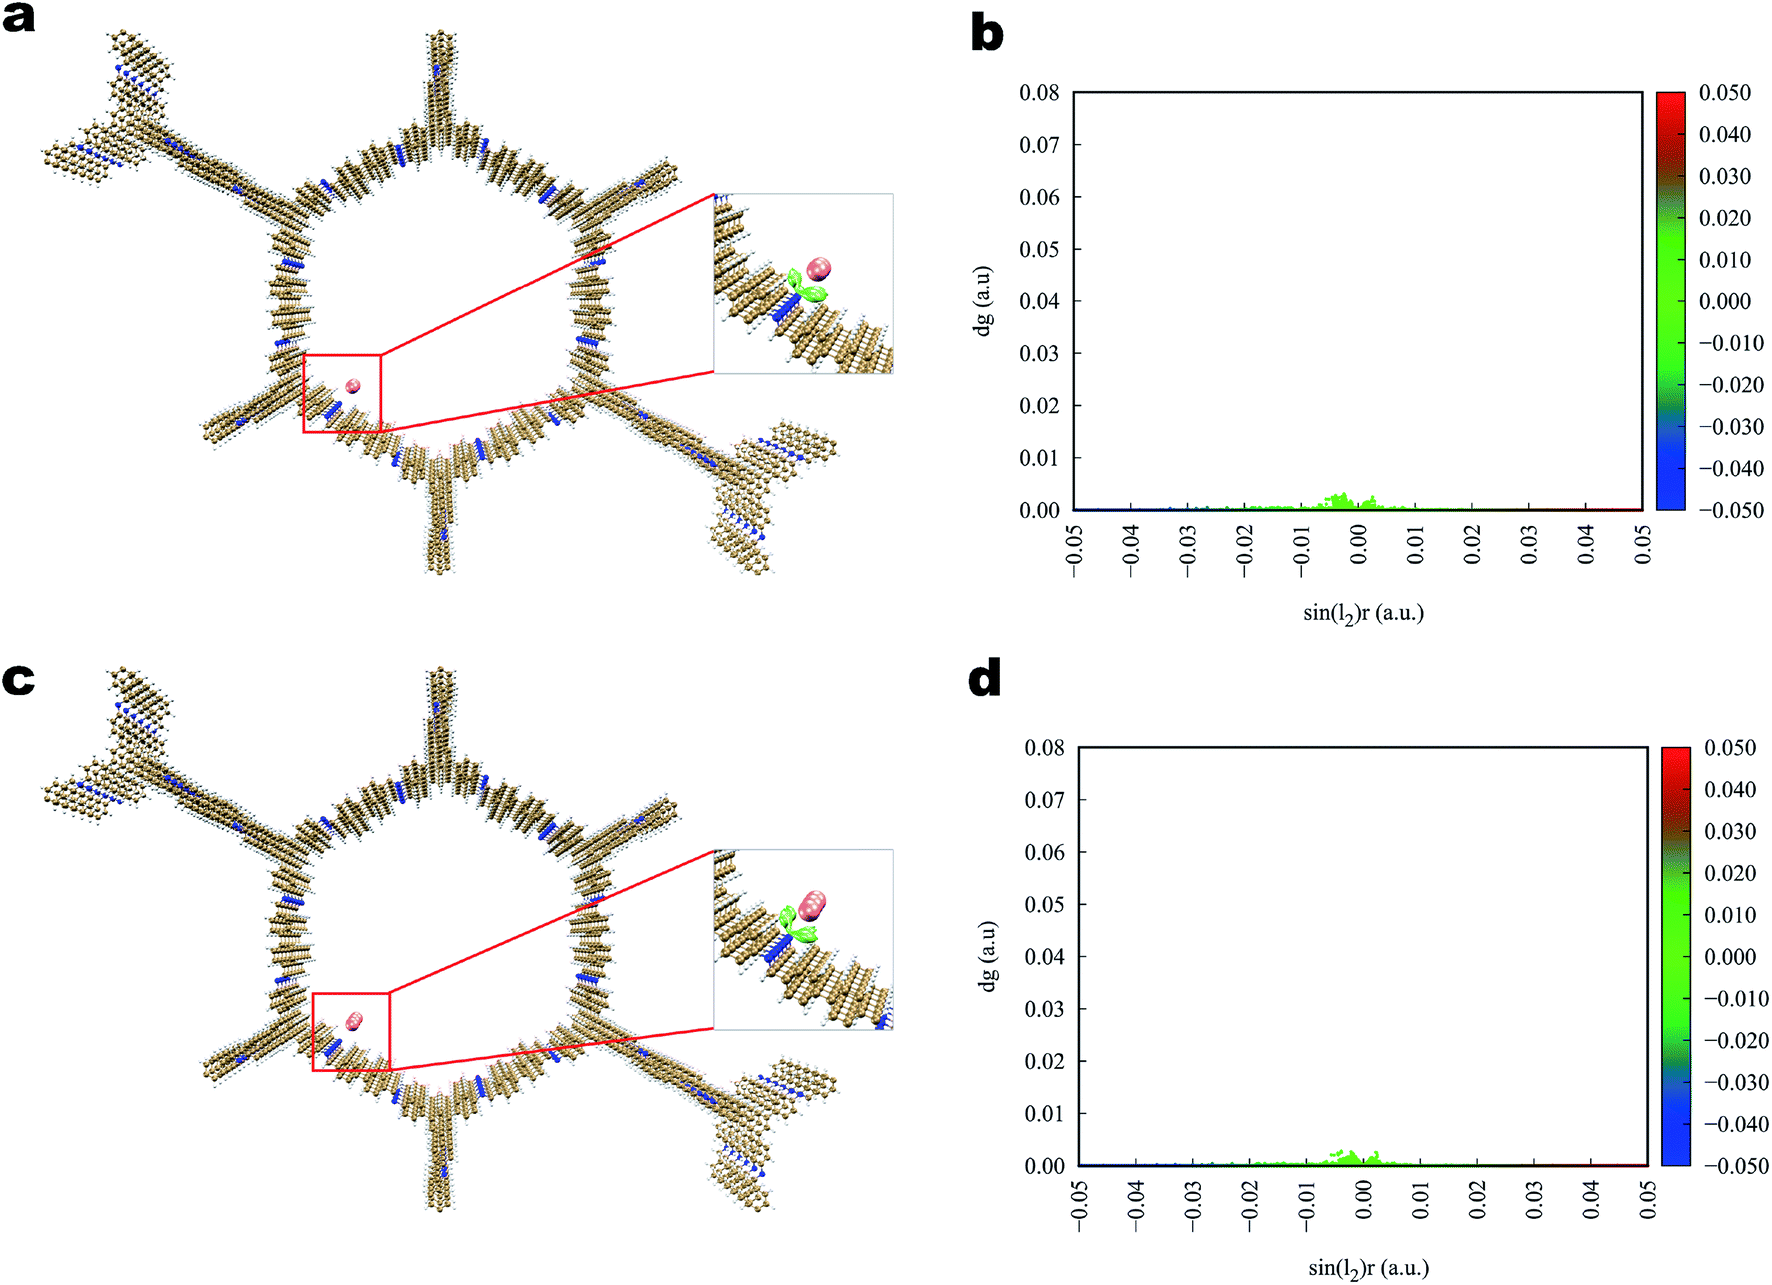
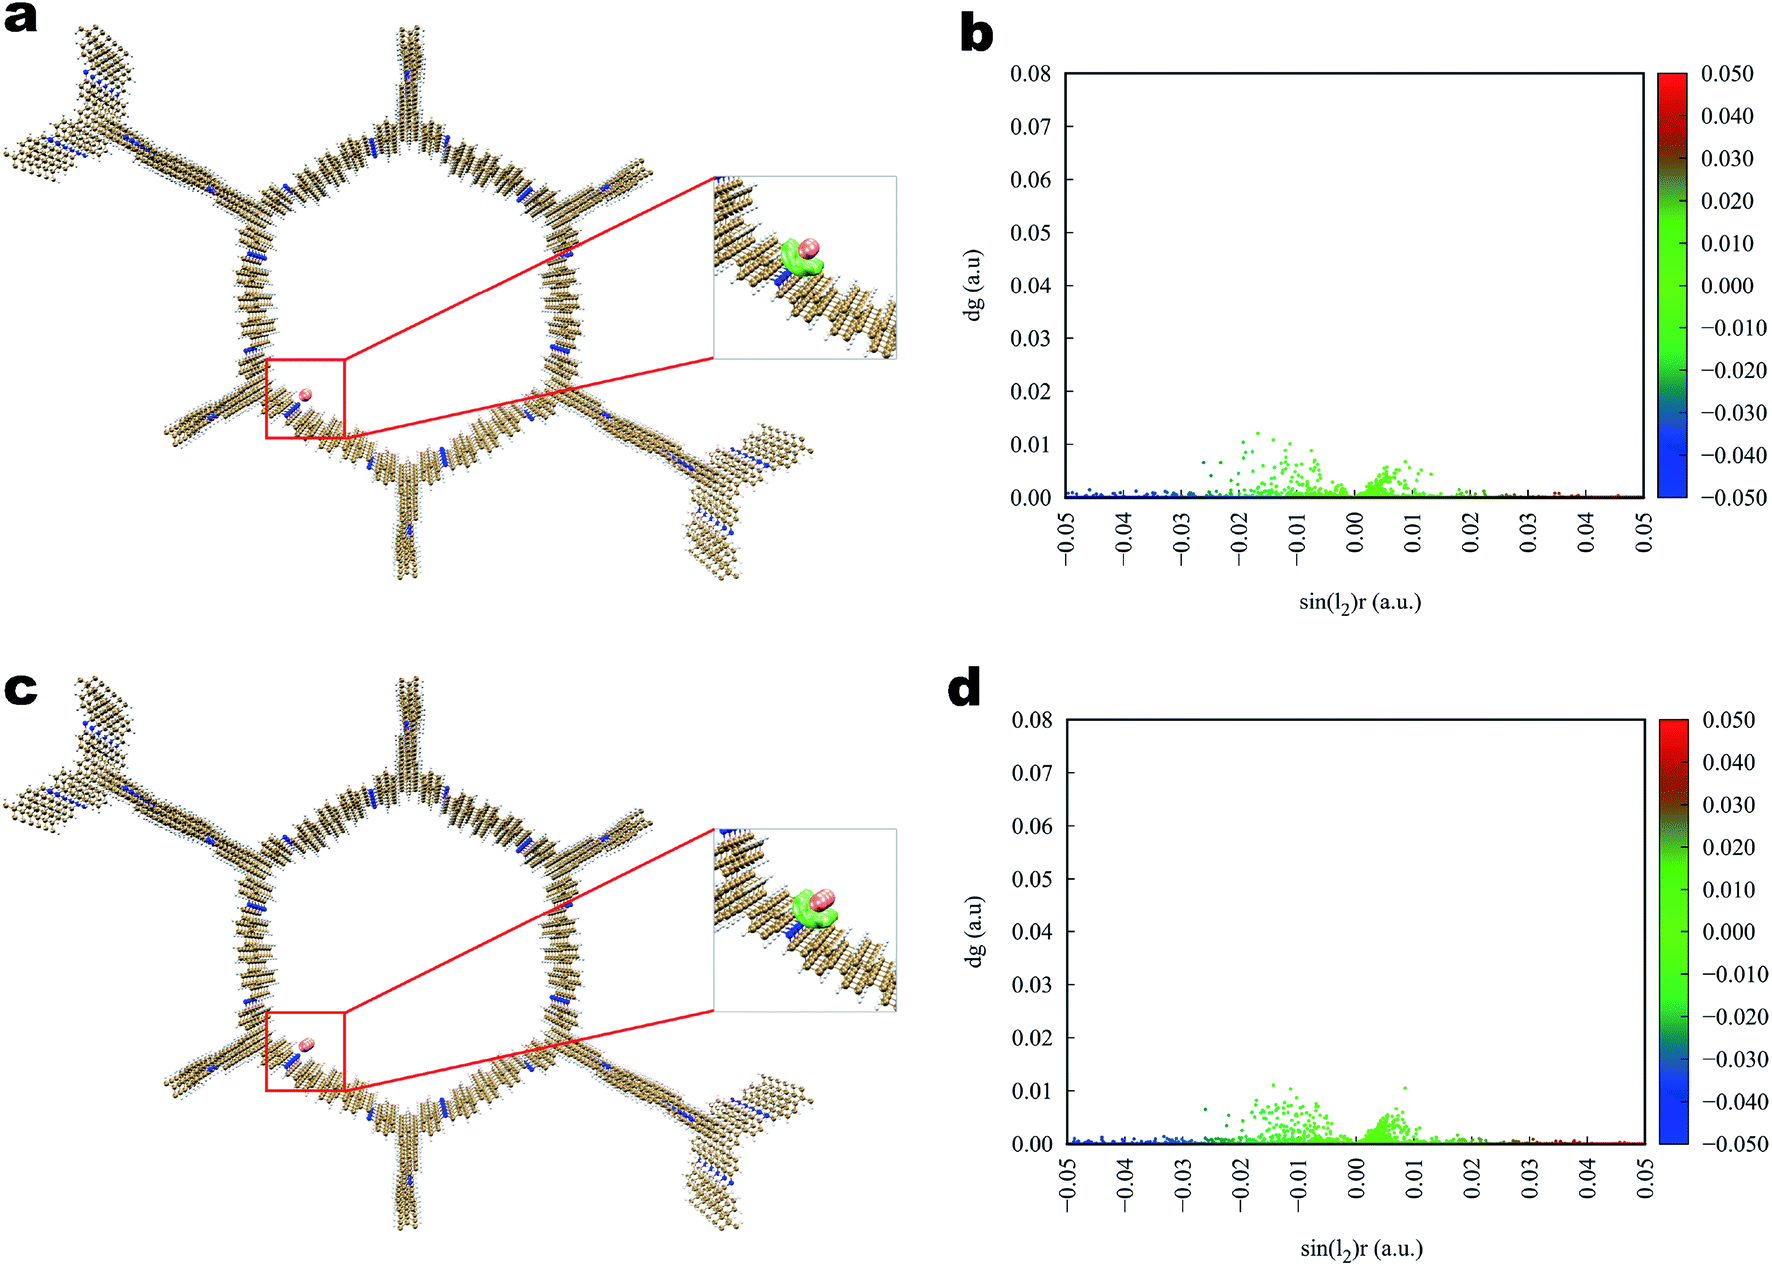
The interaction of iodine toward Tfp–BD COF and Tfp–Td COF (Fig. 7 and 8) was analogous to that toward Tfp–DB COF, in which the iodine and the COFs also formed a three-dimensional stereoscopic interaction network to enhance the capturing capability. The average binding distances between iodine and the COFs were also similar to the distances of Tfp–DB COF. The IGM results indicated that the interaction among the three iodine-laden COFs did not have a significant difference. However, the theoretical results showed that the iodine molecules more likely preferred binding to the amine than the benzene group. Furthermore, the binding energy of I2–I2, I2–I3− and I3−–I3− were −1.55, −2.09 and −2.86 kcal mol−1, which were much weaker than the energy between iodine-laden COFs. When the iodine-laden COFs are heated to a certain temperature, iodine would be released from the pore of COFs. However, due to the different binding energy of the COFs-iodine and iodine–iodine interfaces, the iodine in the middle of the COFs pore would be released. This theoretical phenomenon explained the different uptake of COFs well, which obviously do not obey Jiang's theory.
 |
| | Fig. 7 Simulated characterization of the iodine species capturing sites and IGM scatter plot of Tfp–BD COF. (a and b) I2; (c and d) I3−. | |
 |
| | Fig. 8 Simulated characterization of the iodine species capturing sites and IGM scatter plot of Tfp–Td COF. (a and b) I2; (c, d) I3−. | |
3 Methods
3.1 Materials
1,3,5-Tris(p-formylphenyl)benzene (Tfp), 1,4-diaminebenzene (DB), benzidine (BD), and 4,4′′-diamino-p-terphenyl (Td) were purchased from Jilin Chinese Academy of Science-Yanshen Technology Co., Ltd. 1,4-Dioxane, N,N-dimethylformamide (DMF), acetone, and tetrahydrofuran (THF) were purchased from Beijing Chemical Industry Co., Ltd. Iodine was obtained from Saen Chemical Technology (Shanghai) Co., Ltd. All of the chemical reagents used were of analytical grade, and used as received without further purification.
3.2 Synthesis of COFs
In this work, the COFs materials were synthesized by an accessible method without harsh synthetic conditions. Commonly, 1,3,5-tris(p-formylphenyl)benzene (Tfp) (0.3 mmol, 117 mg) and 1,4-diaminebenzene DB (0.45 mmol, 48 mg) were added to a vessel, then 1,4-dioxane (3 mL) was added to prepare a suspension. 3 M aqueous acetic acid (0.6 mL) was added dropwise, while sonicating the above suspension at room temperature. The suspension was then set at 7 °C, and allowed to stand without disturbing for 3 days. The sediment obtained was separated by centrifugation, and rinsed with DMF and acetone successively. The product was further purified by Soxhlet extraction in THF for 24 h, and dried at 80 °C under vacuum for 12 h to obtain Tfp–DB COF as a yellow powder. A mass of COF powder can be obtained at ambient temperature via the above facilitated method.
3.3 Iodine adsorption
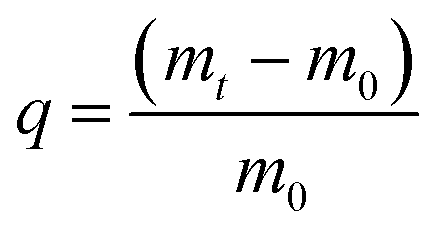
3.3.1 Adsorption of iodine vapor. The COFs were put into an excess iodine vapor environment for the iodine adsorption experiment. The specific process was as follows: 100 mg COF powder was put into a vial, and then the vial was diverted to a dryer containing excess iodine. The sealed dryer was put into an oven kept at 75 °C for the iodine adsorption experiment. The vial was taken out at various intervals, and kept in another empty vessel at 75 °C for 5 minutes to remove the iodine on the surface of the COFs. The cooled vial was weighed at different times within 72 h. The curve of the COFs adsorbed iodine vapor with time was defined by eqn (1):| |
 | (1) |
where q (g g−1) is the amount of iodine adsorbed, and m0 (g) and mt (g) are the mass of adsorbent used in this work at the initial and t times, respectively. We have already performed triple parallel experiments of iodine adsorption.
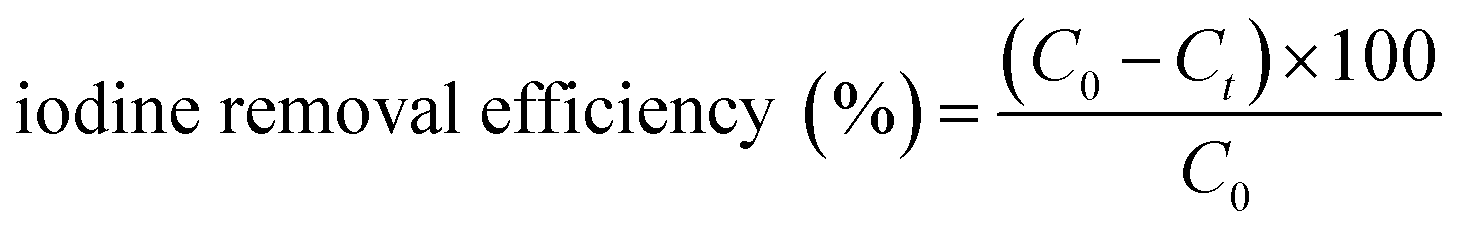
3.3.2 Adsorption of iodine in solution. The iodine capacity of adsorption in solution was carried out at room temperature. 3 mL iodine/hexane solution (0.5 mg mL−1) was added into a bottle containing 15.0 mg COF powder. The solution was filtered at different times, and the residual amount of iodine in the iodine/hexane solution was determined by UV at 522 nm. The removal efficiency of iodine by the COF can be calculated using eqn (2):| |
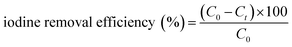 | (2) |
where C0 (mg mL−1) and Ct (mg mL−1) are the concentration of iodine in iodine/n-hexane solution at the initial and t times, respectively.
3.4 Desorption of iodine
The iodine desorption capacity of the I2-laden COFs was investigated by gravimetric method. An open vessel containing a certain amount of I2-laden COFs was put into an empty dryer. The dryer was sealed and placed at 120 °C for iodine release. The cooled vessel was weighed at various intervals, and put back into the empty dryer again. Then, the dryer was sealed and kept at 120 °C to repeat the above process of iodine desorption. The process of desorption lasted for 54 h.
3.5 Recyclability of COFs for I2 adsorption
The recyclability of the COFs was also investigated in this work. The iodine-laden COFs were rinsed with ethanol to release the iodine. The COFs were collected by centrifugation, dried under vacuum at 80 °C overnight, and then reused in the next cycle.
3.6 Characterization
The structure of the COFs was characterized via FT-IR (KBr pellet) spectra (VERTEX 70 FTIR Spectrometer) and solid-state 13C NMR (AVANCE III 400 WB solid 400 megahertz (wide cavity) superconducting nuclear magnetic resonance spectrometer). The morphology and size of the COFs were observed by scanning electron microscopy (SEM, XL-30 field emission scanning electron microscope) and transmission electron microscopy (TEM, Tecnai G2 F20 S-TWIN field emission transmission electron microscope). A Quadrachorme adsorption instrument was used to obtain the N2 adsorption–desorption curves of COFs. The Brunauer–Emmett–Teller (BET) surface area and pore properties were obtained by calculation from the adsorption branch. The Raman spectrum (Renishaw InVia Reflex equipped with a 532 nm diode laser) and XPS spectra (Thermo ESCALAB 250 electronic energy spectrometer) were used to analyze the existing state of iodine adsorbed by COFs. Powder X-ray diffraction (PXRD) measurements were carried out in reflection mode on a D8 ADVANCE X-ray diffractometer with Cu-filtered Kα radiation (λ = 1.54060 Å). Furthermore, the thermal stability of pristine COFs and I2-laden COFs were obtained by thermogravimetric analysis (TGA, PerkinElmer TGA-2 thermo gravimetric analyzer).
4 Conclusion
In summary, we have successfully synthesized a series of COF materials suitable for capturing and maintaining volatile radioiodine both in vapor and in solution. In this study, a series of functional porous COFs were synthesized. The COFs achieved 582 wt%, 542 wt%, and 445 wt% adsorption capacity toward iodine in vapor and 99.9, 99.8 and 99.8 mg g−1 in n-hexane solution, respectively. Moreover, after multiple cycles of iodine adsorption, all COFs still retained more than 171% in vapor and 98.5 mg g−1 in solution adsorption capacity of the pristine material, suggesting that all COFs could be a potential candidate for volatile radioiodine adsorption. All COFs were synthesized under moderate conditions, which could be suitable for large-scale practical applications. Theoretical calculations were also employed to study the relationship between functional groups of COFs and iodine molecules.
Conflicts of interest
There are no conflicts to declare.
Acknowledgements
This work is supported by the National Natural Science Foundation of China (No. 21174053).
References
- S. Yasuda, H. Kyozuka, Y. Nomura, K. Fujimori, A. Goto, S. Yasumura, K. Hata, T. Ohira and M. Abe, J. Matern.-Fetal Neonat. Med., 2017, 30, 2900–2904 CrossRef PubMed.
- S. I. Hayama, M. Tsuchiya, K. Ochiai, S. Nakiri, S. Nakanishi, N. Ishii, T. Kato, A. Tanaka, F. Konno, Y. Kawamoto and T. Omi, Sci. Rep., 2017, 7, 3528 CrossRef PubMed.
- K. Fujimori, H. Kyozuka, S. Yasuda, A. Goto, S. Yasumura, M. Ota, A. Ohtsuru, Y. Nomura, K. Hata, K. Suzuki, A. Nakai, M. Sato, S. Matsui, K. Nakano and M. Abe, Pregnancy and S. Birth Survey Group of the Fukushima Health Management, J. Matern.-Fetal Neonat. Med., 2014, 60, 75–81 Search PubMed.
- Y. Kojima, S. Yokoya, N. Kurita, T. Idaka, T. Ishikawa, H. Tanaka, Y. Ezawa and H. Ohto, J. Matern.-Fetal Neonat. Med., 2019, 65, 76–98 CAS.
- H. Toki, T. Wada, Y. Manabe, S. Hirota, T. Higuchi, I. Tanihata, K. Satoh and M. Bando, Sci. Rep., 2020, 10, 4074 CrossRef CAS PubMed.
- H. Yamamoto, K. Hayashi and H. Scherb, Medicine, 2019, 98, 17165 CrossRef PubMed.
- B. J. Riley, J. D. Vienna, D. M. Strachan, J. S. McCloy and J. L. Jerden, J. Nucl. Mater., 2016, 470, 307–326 CrossRef CAS.
- S. U. Nandanwar, K. Coldsnow, V. Utgikar, P. Sabharwall and D. E. Aston, Chem. Eng. J., 2016, 306, 369–381 CrossRef CAS.
- K. W. Chapman, P. J. Chupas and T. M. Nenoff, J. Am. Chem. Soc., 2010, 132, 8897–8899 CrossRef CAS PubMed.
- K. S. Subrahmanyam, D. Sarma, C. D. Malliakas, K. Polychronopoulou, B. J. Riley, D. A. Pierce, J. Chun and M. G. Kanatzidis, Chem. Mater., 2015, 27, 2619–2626 CrossRef CAS.
- B. J. Riley, J. Chun, W. Um, W. C. Lepry, J. Matyas, M. J. Olszta, X. Li, K. Polychronopoulou and M. G. Kanatzidis, Environ. Sci. Technol., 2013, 47, 7540–7547 CrossRef CAS PubMed.
- P. Tung Cao Thanh, S. Docao, I. C. Hwang, M. K. Song, D. Y. Choi, D. Moon, P. Oleynikov and K. B. Yoon, Energy Environ. Sci., 2016, 9, 1050–1062 RSC.
- K. Seff and D. P. Shoemaker, Acta Crystallogr., 1967, 22, 162–170 CrossRef CAS.
- Y. Tang, H. Huang, J. Li, W. Xue and C. Zhong, J. Mater. Chem. A, 2019, 7, 18324–18329 RSC.
- D. F. Sava, M. A. Rodriguez, K. W. Chapman, P. J. Chupas, J. A. Greathouse, P. S. Crozier and T. M. Nenoff, J. Am. Chem. Soc., 2011, 133, 12398–12401 CrossRef CAS PubMed.
- Z. Wang, Y. Huang, J. Yang, Y. S. Li, Q. X. Zhuang and J. L. Gu, Dalton Trans., 2017, 46, 7412–7420 RSC.
- D. F. Sava, T. J. Garino and T. M. Nenoff, Ind. Eng. Chem. Res., 2012, 51, 614–620 CrossRef.
- P. Chen, X. He, M. Pang, X. Dong, S. Zhao and W. Zhang, ACS Appl. Mater. Interfaces, 2020, 12, 20429–20439 CrossRef CAS PubMed.
- W. Xie, D. Cui, S. R. Zhang, Y. H. Xu and D. L. Jiang, Mater. Horiz., 2019, 6, 1571–1595 RSC.
- Y. Feng, P. Yang, Y. Li and J. Gu, J. Chem. Eng. Data, 2020, 65, 1986–1992 CrossRef CAS.
- Z. Yan, Y. Yuan, Y. Tian, D. Zhang and G. Zhu, Angew. Chem., Int. Ed., 2015, 54, 12733–12737 CrossRef CAS PubMed.
- C. Pei, T. Ben, S. Xu and S. Qiu, J. Mater. Chem. A, 2014, 2, 7179–7187 RSC.
- Y. Q. Li, Y. R. Li, Q. H. Zhao, L. Li, R. Chen and C. Y. He, Cellulose, 2020, 27, 1517–1529 CrossRef CAS.
- X. W. Pan, X. H. Qin, Q. H. Zhang, Y. S. Ge, H. Z. Ke and G. E. Cheng, Microporous Mesoporous Mater., 2020, 296, 109990 CrossRef CAS.
- J. Wang, Z. L. Li, Y. Wang, C. T. Wei, K. L. Ai and L. H. Lu, Mater. Horiz., 2019, 6, 1517–1525 RSC.
- T. M. Geng, W. Y. Zhang, Z. M. Zhu and X. M. Kai, Microporous Mesoporous Mater., 2019, 273, 163–170 CrossRef CAS.
- X. M. He, S. Y. Zhang, X. Tang, S. H. Xiong, C. X. Ai, D. Y. Chen, J. T. Tang, C. Y. Pan and G. P. Yu, Chem. Eng. J., 2019, 371, 314–318 CrossRef CAS.
- X. Wu, M. Shaibani, S. J. D. Smith, K. Konstas, M. R. Hill, H. T. Wang, K. S. Zhang and Z. L. Xie, J. Mater. Chem. A, 2018, 6, 11327–11336 RSC.
- B. Y. Li, Y. M. Zhang, R. Krishna, K. X. Yao, Y. Han, Z. L. Wu, D. X. Ma, Z. Shi, T. Pham, B. Space, J. Liu, P. K. Thallapally, J. Liu, M. Chrzanowski and S. Q. Ma, J. Am. Chem. Soc., 2014, 136, 8654–8660 CrossRef CAS PubMed.
- X. W. Pan, C. H. Ding, Z. M. Zhang, H. Z. Ke and G. E. Cheng, Microporous Mesoporous Mater., 2020, 300, 110161 CrossRef CAS.
- J. Li, H. Zhang, L. Zhang, K. Wang, Z. Wang, G. Liu, Y. Zhao and Y. Zeng, J. Mater. Chem. A, 2020, 8, 9523–9527 RSC.
- P. Wang, Q. Xu, Z. P. Li, W. M. Jiang, Q. H. Jiang and D. L. Jiang, Adv. Mater., 2018, 30, 1801991 CrossRef PubMed.
- X. Guan, H. Li, Y. Ma, M. Xue, Q. Fang, Y. Yan, V. Valtchev and S. Qiu, Nat. Chem., 2019, 11, 587–594 CrossRef CAS PubMed.
- Z. J. Yin, S. Q. Xu, T. G. Zhan, Q. Y. Qi, Z. Q. Wu and X. Zhao, Chem. Commun., 2017, 53, 7266–7269 RSC.
- C. Wang, Y. Wang, R. Ge, X. Song, X. Xing, Q. Jiang, H. Lu, C. Hao, X. Guo, Y. Gao and D. Jiang, Chem. - Eur. J., 2018, 24, 585–589 CrossRef CAS PubMed.
- H. Guan, D. Zou, H. Yu, M. Liu, Z. Liu, W. Sun, F. Xu and Y. Li, Front. Mater., 2019, 6, 12 CrossRef.
- L. Liu, C. Song and A. Kong, Mater. Lett., 2020, 277, 128291 CrossRef CAS.
- X. Guo, Y. Li, M. Zhang, K. Cao, Y. Tian, Y. Qi, S. Li, K. Li, X. Yu and L. Ma, Angew. Chem., Int. Ed., 2020, 59, 22697–22705 CrossRef CAS PubMed.
- L. Li, R. Chen, Y. Li, T. Xiong and Y. Li, Cellulose, 2020, 27, 5879–5892 CrossRef CAS.
- Y. Li, Y. Li, Q. Zhao, L. Li, R. Chen and C. He, Cellulose, 2019, 27, 1517–1529 CrossRef.
- Y. Sun, S. Song, D. Xiao, L. Gan and Y. Wang, ACS Omega, 2020, 5, 24262–24271 CrossRef CAS PubMed.
- R. Gomes, P. Bhanja and A. Bhaumik, Chem. Commun., 2015, 51, 10050–10053 RSC.
- R. Gomes and A. Bhaumik, RSC Adv., 2016, 6, 28047–28054 RSC.
Footnote |
| † Electronic supplementary information (ESI) available. See DOI: 10.1039/d0ra10587b |
|
| This journal is © The Royal Society of Chemistry 2021 |
Click here to see how this site uses Cookies. View our privacy policy here. 
 Open Access Article
 This Open Access Article is licensed under a Creative Commons Attribution-Non Commercial 3.0 Unported Licence
 *b and
Fengqi Liu*a
*b and
Fengqi Liu*a