 Open Access Article
Modeling the air pollutant concentration near a cement plant co-processing wastes†
Zhenzhou Yang *ab,
Xingmin Gaoa and
Weike Hub
aChina Center for Special Economic Zone Research, Shenzhen University, Shenzhen 518060, China. E-mail: yangzhenzhou@szhti.com.cn
bShenzhen High Technology Investment Group Co., Ltd, Shenzhen 518040, China
First published on 10th March 2021
Abstract
In this study, for the first time, we conducted full life-cycle studies on pollutants in a cement plant co-processing hazardous waste (HW) via the combined use of thermodynamic equilibrium calculations and the American Meteorological Society/Environmental Protection Regulatory Model. Results showed that the potential toxic elements (PTEs) can be classified into three categories: (1) non-volatized elements, Co; (2) semi-volatized elements, Cr and Ni; and (3) volatized elements, Cd, Pb and As. Besides, the spatial distributions of pollutants were strongly influenced by the prevalent wind direction and the size of the particulate matter they were absorbed on. The highest concentrations of most pollutants tended to be centralized at a distance in the range of 400 to 800 m away from the cement plant. Finally, validated results indicated that there is good agreement between the simulated and observed concentrations in this study. These findings can facilitate and assist local government authorities and policy makers with the management of urban air quality.
1. Introduction
Industries such as the petrochemical, chemical, metallurgical, cellulose, food, mining, and textile industries produce large quantities of waste, including sludge, oil, ash, plastic, paper, fibers, rubber, wood, metal, glass, alkaline or acidic materials and slag;1–4 about 40% of these wastes can be classified as hazardous waste (HW).5 According to the current statistics, more than 15.87 million tons of HW is produced in China at an increasing rate due to the rapid industrialization of China.6–8 Thus, the effective disposal of HW has become a severe problem that needs to be urgently solved. The most common ways to dispose HW are landfill disposal and incineration.9–11 However, the former is limited due to the reduced availability of land and the production of percolate. Besides, the emission of hazardous organics, heavy metals and the generation of solid by-products also restrict the application of incineration. Nowadays, the co-processing of HW in cement kiln has been regarded as the most promising method for its disposal due to some remarkable advantages. Firstly, HW contains some chemical components, such as SiO2, Al2O3, CaO and Fe2O3. These are essential components for the production of cement, which is in accordance with previous research.12 Secondly, HW also possesses a certain calorific value, which provides heat during the cement production process. Thirdly, compared to the incineration method, HW can be fully transferred into the cement clinker in the cement kiln without the production of solid by-products. Fourthly, the high temperature in the cement kiln can completely destroy the hazardous substances. Finally, the co-processing of HW in the cement kiln is beneficial for receiving additional revenue from governmental subsidies. However, although the co-processing of HW in the cement kiln possesses multiple advantages, some concerns still require attention, for example, the release of potential toxic elements (PTEs) and hazardous organic pollutants. PTEs have attracted significant attention from the public due to their hazardous effects on human health and the eco-system. It is worth mentioning that cement plants have become one of the most important sources for the release of PTEs.13 During the production of cement, the PTEs in raw materials and fuel can undergo a series of chemical reactions. A portion of PTEs can be immobilized in the cement clinker, while the rest can be evaporated as the gas phase. PTEs in the gas phase can be adsorbed on the fine particulate matter (PM) in the flue gas cooling process. Then, this fine PM can be released into the environment and directly inhaled by humans, which is harmful to human health.14 It has been reported that people working in cement plants are at a higher risk of developing lung, bladder and laryngeal cancer.15,16 In addition, organic pollutants have also become another important severe concern to the public during the cement manufacturing process. For example, the formation and emission of polychlorinated dibenzo-p-dioxins, polychlorinated dibenzofurans (PCDD/Fs) and polycyclic aromatic hydrocarbons (PAHs) from a cement kiln have been investigated in other studies.17,18 Besides, the emission of PCDD/Fs and PAHs from cement kilns, and their impact on the surrounding environment have also been demonstrated in previous studies.19–22 Therefore, it is necessary to monitor the air quality near cement plants, especially for those integrating the utilization of HW as raw materials and alternative fuel for cement manufacturing. However, to the best of our knowledge, currently there is a lack of stations that can monitor the air quality near this type of cement plant. Besides, due to the conflict of interest with cement plants, it is also difficult to gain access to accurate public information (i.e., local public health data, environmental compliance of cement plant and its emission). Accordingly, the atmospheric dispersion model is a useful tool, given that it can incorporate the latest knowledge regarding atmospheric dynamics and predict dispersal patterns, chemical transformations and deposition of pollutants, thereby obtaining an estimate of the concentrations of pollutants in the atmosphere over a certain period.23–27 The accurate prediction of air pollution dispersion is complicated. Gaussian-type dispersion models, including AERMOD (American Meteorological Society/U.S. Environmental Protection Agency Regulatory Model) and the California Puff Model (CALPUFF) are the most widely used model at present, which have been successfully used to simulate the emissions from large elevated sources such as power plant stacks and are recommended by global regulatory agencies for environmental assessments.28 Compared to CALPUFF, AERMOD has wide international application and has been applied in many case studies.29–31 Globally, there are several studies using the AERMOD steady-state model to predict the pollutants emitted from cement plants.32–36 However, almost all these studies focus on the dispersion of normal pollutants (i.e., PM, sulfur dioxide (SO2) and oxynitride (NOx)). Few studies have simulated the distribution of PTEs and organic pollutants from cement plants, especially those co-processing HW. This research aimed to evaluate the full life-cycle of the PTEs during the co-processing of HW in the cement kiln process. To achieve this goal, we concentrated on several issues as follows: (1) understanding the partitioning behaviors of PTEs during the cement clinker calcination process; (2) acquiring the spatially distributed data of PTEs and organic pollutants and their concentrations emitted from a cement plant integrating the utilization of HW; and (3) evaluating the performance using the atmospheric dispersion model by comparing the simulated values with the observed values.2. Materials and methods
2.1 Study area description
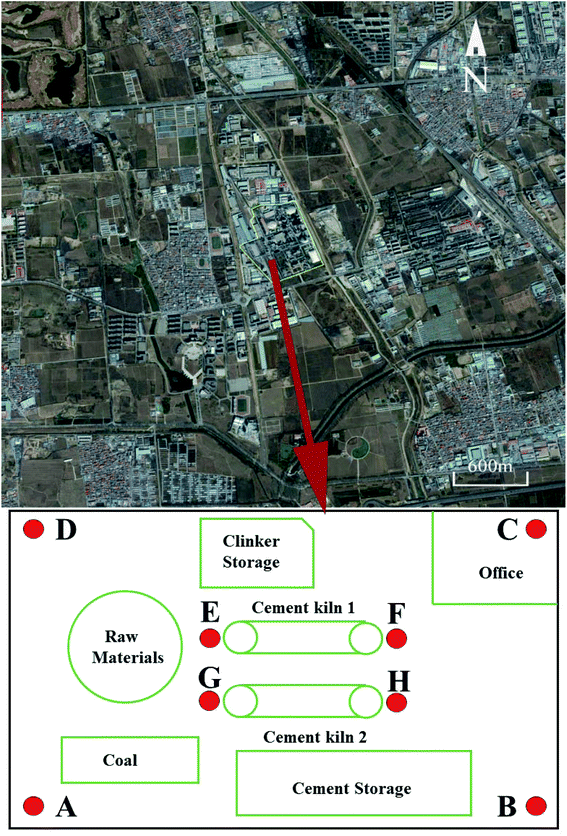
The area discussed in this study is the Machikou Town, in the Changping District, which is about 36 km away from the center of Beijing, China, as shown in Fig. 1. The latitude and longitude of this town are 116° N and 40° E. The east-west direction is approximately 6.7 km, and the south-north direction is approximately 7.2 km. Its total area coverage is 62 square kilometers. The whole area is similar to a dustpan with a flat terrain setting, which has a higher altitude in the northern area and lower altitude in both the southern and central areas. The average elevation of Machikou Town is 50 m, and the highest elevation is about 90 m, while the lowest elevation is close to 10 m. Previous studies have proven that problematic results are obtained from the simulation when the studied area is beyond the 5 km away from the reference point.36 Hence, we investigated an area of 5 km × 5 km centered on the cement plant (40.10° N, 116.09° E) in this study. This cement plant integrates the utilization of HW and municipal sewage sludge (MSS) as alternative fuel and raw materials to produce cement with a disposal capacity of 130 t d−1 HW and 500 t d−1 MSS, respectively. According to the statistics, more than 60![[thin space (1/6-em)]](https://www.rsc.org/images/entities/char_2009.gif) 000 habitants live in Machikou Town and the cement plant production is the only industrial activity in this town.
000 habitants live in Machikou Town and the cement plant production is the only industrial activity in this town.
2.2 Field study of PM
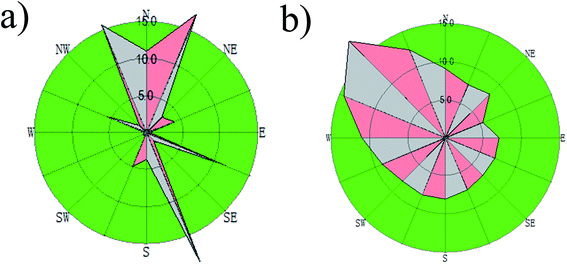
The PM sample was collected in the cement plant. The wind direction and wind speed rose plots are displayed in Fig. 2. It can be seen that the prevailing wind at the sampling sites was in the southeastern and northwestern directions. Based on the wind directions, 4 sampling sites were targeted in the north-western, south-western, south-eastern and north-western corners of the cement plant, which were marked as A, B, C and D, respectively. The cement plant has two production lines and two cement kilns. To study the effects of the cement kiln emission on the surrounding environment, another 4 sampling sites were established near the head and tail of the cement kilns, which were marked as E, F, G, and H, respectively, as shown in Fig. 1. The PM was sampled by a medium volume collector (KB-120F, Qingdao Kingstar Instruments Co., Ltd.) with a flow rate of 100 L min−1. The PM was collected on quartz microfiber filters (9 cm, 100 circles, Whatman, UK), and the collection time for each sample lasted 24 h. After collection, the PM sample was treated for the PTE measurements. The scientific methods were described in our previous study.37 All the tests were conducted three times to check the reproducibility and a reagent blank was also analyzed to check for background interference. The accuracy for the sample analysis was within ±10%.2.3 Atmospheric dispersion modeling
An atmospheric dispersion model was used to simulate and predict the distributions of air pollutants and their concentrations. AERMOD, which was developed by the American Meteorological Society and U.S Environmental Protection Agency (EPA), was used to model the dispersion of air pollutants from different point sources (stack) over the short-range. The steady-state plume model assumes vertical and horizontal air concentrations following a Gaussian distribution in the stable boundary layer, where the vertical air concentration in the convective boundary layer obeys the bi-Gaussian probability density function. AERMOD can be applied over flat and complex terrains, within urban and rural areas affected by multiple surface/elevated emission sources including point, area and volume sources. Temperature, wind direction and wind speed are the surface meteorological parameters employed by AERMOD. Some other parameters such as friction velocity, the height of the convectively boundary layer, surface roughness length and vertical potential temperature gradient are also required. Surface characteristics such as surface roughness, Bowen ratio and albedo are required to create similarity profiles of the relevant boundary layer parameters. The analytical formulation for calculating the dispersion mechanism of the pollutants in the air is described in eqn (1), where x, y, and z are the positions in which the concentration of contaminants (m) is estimated; C(x,y,z) is the expected contaminant concentration at x, y, and z (g m−3); Qs is the emission rate (g s−1); H is the effective height of the release of pollutants; μ is the average wind speed at the top of the chimney in the direction of flow (m s−1); and y and z are the mean deviations of the distribution of concentration in the directions of y and z (m), respectively.
 | (1) |
The modeling chain was formed with a main module (AERMOD) and two pre-processors (AERMET and AERMAP). The AERMAP pre-processor was used to generate receptor grids and characterize the terrain features. AERMET was used to calculate the boundary layer parameters using the meteorological interface. Then, the calculated results from AERMET and AMERMAP were sent to AERMOD to generate vertical profiles of the meteorological variables. The advantages of AERMOD include: (1) prediction effects of odor emissions at grid receptors with a high temporal resolution or a discrete receptor, (2) covering topographic features according to simple and complex terrains, (3) assessing the surface and upper air meteorological conditions together, (4) being able to predict the dispersion in the near-field from sources. In this study, the AERMET meteorological model and AERMOD were applied for 5 × 5 km areas with the cement plant being at the center with a 50 × 50 m gridding. All the calculation procedures of the model are shown in Fig. S1.†
2.4 Source and emission data
In this study, we assumed that vehicles and residential activities emit small amounts of pollutants, and thus these two pollutant sources were not considered in our study. The cement plant is the only industrial activity in the study area, and there are four stacks in the plant, which were regarded as the four point sources. The specific source information, i.e., stack height and diameter, flue-gas composition, temperature, and exit velocity, was also collected from the plant with the support of the cement plant. It should be noted that only the pollutants directly emitted from the cement plant were considered.The methods used for sampling and analysis were the standard methods suggested by the European regulations for stack analysis. Specifically, the methods used were: (1) PCDDs/Fs sampling: EPA Method 0023A, European Norme EN 1948-1; (2) PCDDs/Fs analysis: EPA Method 1613; (3) PAHs sampling: EPA Method 0010; (4) PAHs analysis: EPA Method 8100; and (5) PTEs sampling and analysis: EPA Methods 0060, 0029, 3051, 3015. Almost all these methods require an isokinetic regime for gas sampling. PCDD/Fs and PAHs required a sampling time of over 8 h, and the analysis was carried out by high-resolution gas chromatography coupled with high-resolution mass spectrometry (GC-MS, HP5890, Agilent). The analytical procedure included extraction with toluene, changing the solvent to hexane and cleanup with three different columns, including silica, alumina and activated carbon. PTE sampling required a sampling time of over 5 h. The PTE sampling train consisted of six different impingers, which were recently treated to extract the metals, according to standard method. The quantification analysis was carried out by inductively coupled plasma spectroscopy with a mass spectroscopy detector (ICP-MS, XSERIES 2, Thermo Scientific). During the measurement, certified reference materials were used for quality assurance. The measured concentrations were in good agreement with the recommended values. All tests were performed in triplicate to check the reproducibility and a reagent blank was also analyzed to check for background interference. The accuracy for the sample analyses was within ±10%. Tests in the cement kiln stack were performed for more than one year.
2.5 Meteorological and terrain data
The meteorological data such as wind direction and velocity, temperature, cloudiness, cloud height, pressure and relative humidity was collected for a one-year period in the investigated area using two meteorological stations near the cement plant. Upper-air data from the National Weather Service was also used. The wind roses of the studied area are presented in Fig. 2.The land use data for calculating the surface characteristics (albedo, Bowen ratio, and surface roughness length) was collected from the United States Geological Survey (USGS). Shuttle Radar Topography Mission topography data from the National Geospatial-Intelligence Agency (NGA) and National Aeronautics and Space Administration (NASA) database with a 90 m resolution was used to extract terrain data for the studied area.
2.6 Validation of the model
To validate the reliability of a model, many researchers use statistical indicators to compare the discrepancy between the observations and predictions.38 The commonly used simple metrics employed to quantify the difference between the modeled and observed concentrations is the fraction of predictions within a factor of two of observations (FAC2). The model is considered acceptable when the value of FAC2 is in the range of 0.5 to 2:| 0.5 ≤ FAC2 = Cm/Co ≤ 2 | (2) |
2.7 Equilibrium calculations
Chemical equilibrium analysis is a useful tool in the study of a variety of processes, which has been widely used in the study of many environmental, geochemical and technical processes. The high temperature chemistry of PTEs can be examined by using modeling programs, which employ thermodynamic data to perform complex chemical equilibrium computations in multicomponent multiphase systems. This principally delineates the stable phases and dominating species that can form during specific operating conditions. Thermodynamic equilibrium calculations were conducted in this study for a better understanding of the PTE distribution behaviors during the cement clinker calcination process. The calculation was run using FactSage 6.4 according to the principle of Gibbs free energy minimization. FactSage 6.4 runs on a PC operating with Microsoft Windows and consists of a series of information, database and calculation modules. The database of FactSage 6.4 contains thermodynamic data of over 4400 compounds (gases, liquids, solids and non-ideal solutions). Approximately 800 compounds were selected from the database.The chemical compositions of the raw materials, fuel and waste were set as input data and the excess air coefficient was set as 1.2 according to the practical operating condition. The temperature in this study was in the range of 1000 °C to 1500 °C with the calculated step of 50 °C. Several variables were considered in this study as follows: (1) the basic system considered the elements of C, H, N and S; (2) Cl was introduced in the system to explore its potential impact; (3) the mineral phases were used to examine the possible interactions; and (4) waste was also added to the system to evaluate its impacts on the PTE behaviors.
3. Results and discussion
3.1 Sample characterization
The cement plant uses limestone, sandstone, iron ore, and fly ash as raw materials and coal as fuel to produce cement clinker. It also co-processes MSS and HW simultaneously. HW is a mixture of different hazardous waste, which is divided into HW1 and HW2 according to the different moisture contents and chemical components. HW1 contains electroplating sludge, waste mineral oil and printing ink, whereas HW2 mainly consists of paint sludge, waste chemicals and cosmetics. The heavy metal contents of the raw materials, fuel, MSS and HW are shown in Table 1. It can be seen that HW contains much higher contents of PTEs than the raw materials and coal. For example, HW2 contains much higher contents of As, Cr and Pb, while HW1 shows a much higher concentration of Ni. Thus, the results indicate that the added waste can effectively increase the input of PTEs.| Coal | Sand | LS | Iron | FA | MSS | HW1 | HW2 | |
|---|---|---|---|---|---|---|---|---|
| a Nd: not detected, sand: sandstone, LS: limestone, iron: iron powder, and FA: fly ash. | ||||||||
| As | 3.5 | 4.7 | 21 | 2.41 | 2.5 | 28.1 | 7.8 | 233.4 |
| Cd | 0.3 | 1.4 | 1.9 | ND | 0.5 | 3.5 | Nd | 2.1 |
| Cr | 39.1 | 67.2 | 7 | 33 | 64 | 43.3 | 84.7 | 1000.1 |
| Co | 3.3 | Nd | 1.7 | 23.7 | 13.8 | 4.1 | 19.5 | 51.6 |
| Pb | 4.4 | 2.2 | 6.4 | 13.8 | 29.4 | 21.5 | 20.5 | 1228.7 |
| Ni | 7.3 | 3.3 | 3.5 | 12.9 | 14.5 | 15.7 | 3839 | 1064.7 |
3.2 The thermodynamics equilibrium calculation of PTEs
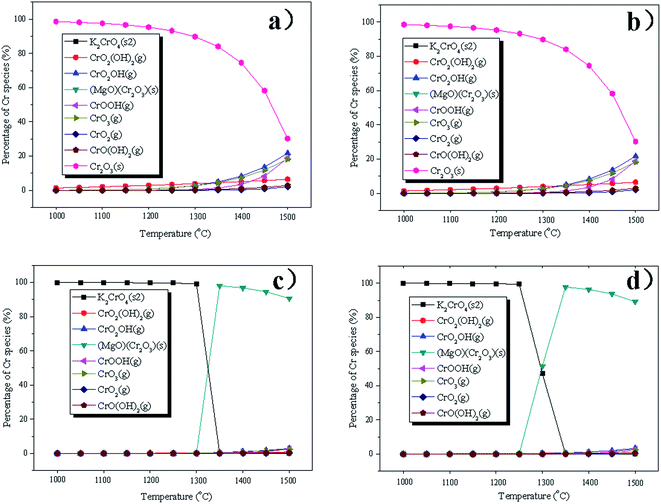
To better understand the influence of different conditions on the distribution behaviors and chemical forms of PTEs, thermodynamic equilibrium calculation was performed based on the principle of Gibbs free energy minimization using FactSage 6.4 in this study. Although the equilibrium calculations have limitations because they neglect the kinetic effect, nonuniform distribution and mode of occurrence of the elements, they can indeed help to understand the general trends of PTE behaviors under different variables. The calculations of Cr under different conditions are shown in Fig. 3 as an example, and the calculated results of the other PTEs are shown in Fig. S2–S6 in the ESI.† It is easy to find that Cr can be considered a semi-volatile element and would only partially volatilize above 1300 °C. At a temperature below 1400 °C, Cr is mainly in the form of Cr2O3(s). With an increase in temperature, the proportions of CrO2OH(g), CrOOH(g) and CrO3(g) increase in the system. The presence of chlorine has little impact on the distribution of Cr. With the addition of mineral phases to the system, it can be easily seen that the mineral species can react with the Cr and generate (MgO)(Cr2O3), which can help to stabilize Cr. The dominant species of Cr becomes K2CrO4(s) below the temperature of 1300 °C in the presence of waste, which is also in accordance with the previous study.39 When the temperature exceeds 1300 °C, (MgO)(Cr2O3) starts to become the dominant species. With a further increase in temperature, the proportion of (MgO)(Cr2O3) decreases, while the proportions of CrO2OH(g), CrO3(g), CrO2(g) and CrOOH(g) increase.With regard to Cd, Cd(g) is the only stable species in the temperature interval of 1000 °C to 1500 °C. The presence of chlorine, mineral phases and waste hardly impacts the species of Cd. As can be entirely volatilized in the form of elemental As above 1000 °C. With an increase in temperature, the proportion of elemental As increases, while AsS(g) becomes dominant at a temperature above 1500 °C. Chlorine and mineral contents have almost no influence on the volatilization of As. However, the addition of waste can help to stabilize As below the temperature of 1300 °C by forming the solid phase of K3AsO4(s). With a further increase of temperature, the proportion of K3AsO4(s) decreases, while AsO(g) becomes the dominant species. For Co, Co is condensed as CoO(s) in the temperature range of 1000 °C to 1500 °C, and the existence of chlorine can facilitate the formation of CoCl2(g) and CoCl(g). Pb is in the form of PbO(g) initially, and the proportion of Pb(g) increases with an increase in temperature. The presence of chlorine influences the species of Pb with the formation of PbCl2(g). No significant variation was observed considering the existence of mineral contents and waste. In the case of nickel, NiO(s) is the dominant species above 1000 °C. When the temperature further increases to 1100 °C, the content of NiO(s) declines, with the formation of Ni(OH)2(g). Almost all the nickel is present as Ni(OH)2(g) when the temperature reaches 1350 °C. The proportion of Ni(OH)2(g) decreases, while the proportion of NiO(g) and Ni(g) increase with a further increase in temperature. The existence of chlorine can promote the formation of NiCl(g) and NiCl2(g) when the temperature is above 1400 °C. With the addition of a mineral phase, NiCl(g) and NiCl2(g) disappear. The proportion of Ni(OH)2(g) in the vapor increases when waste is considered in equilibrium.
The partitioning behaviors of the PTEs under the cement clinker calcination conditions based on the thermodynamic equilibrium calculations are displayed in Fig. 4. It can be seen that As, Pb and Cd can be entirely volatilized as gas phases, while almost all the Co can be condensed in the solid phase. Cr and Ni can be found in both the solid phase and gas phase based on the calculation. According to the thermodynamic equilibrium calculation results, it can be concluded that the PTEs in our research can be classified into three categories: (1) non-volatized elements: Co; (2) semi-volatized elements: Cr and Ni; and (3) volatized elements: Cd, Pb and As.
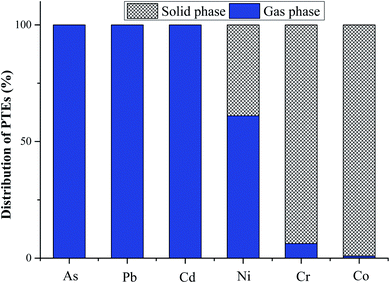 | ||
| Fig. 4 Partitioning behaviors of PTEs during the clinker calcination process based on the thermodynamic equilibrium calculation (with the condition of 1.2 excess air coefficient). | ||
3.3 Atmospheric dispersion modeling of PTEs and organics
It is well known that pollutants such as PTEs and organics can be released from the raw materials and waste during the cement clinker calcination process.39 With the cooling of the flue gas, the released pollutants can be adsorbed on fine PM and be suspended in the air, and then accumulate in the soil surrounding the cement plant through dry and wet deposition.40 Usually, more than 80% of pollutants can be adsorbed on fine PM and the rest is released as the gas phase.41 In our study, 80% of PTEs and organics was assumed to be emitted as particulate states, while the rest was released as gas phases. Different pollutants tend to be adsorbed on PM with different sizes. The deposition parameters of PTEs are displayed in Table 2, which were provided by the EPA.| Name | Diameter below 2.5 μm (%) | Median diameter (μm) |
|---|---|---|
| As | 75 | 0.5 |
| Cd | 70 | 0.6 |
| Cr | 55 | 1.2 |
| Co | 75 | 0.5 |
| Pb | 75 | 0.5 |
| Ni | 60 | 1.0 |
| PCCD/Fs | 90 | 0.1 |
| PAHs | 93 | 0.1 |
Table 3 presents the data related to the operation of the stacks in the cement plant, which was obtained from the cement plant. It is worth mentioning that the cement plant has two production lines, and each line has two active stacks including the main kiln and the clinker cooler. A bag filter was used to control these emissions and the annual operation time of the kiln was estimated to be 8040 h, considering that kilns run 24 h per day except for maintenance stops. For the dispersion calculations for the pollutants, the emissions were considered to be constant throughout the operational hours. The influence of wind direction was observed in the concentration pattern. As the studied area is in a flat terrain instead of a complex terrain, AERMOD can well simulate the dispersion result of pollutants. Fig. 4 presents the annual distribution map of PTEs, which shows that the dispersion of PTEs was predominant in the north, south, north-west, and south-east direction around the cement plant. It is known that the prevailing meteorological conditions, especially the predominant wind can effectively affect the isopleths distribution of pollutants.42 The wind rose (shown in Fig. 2) shows the prevailing wind direction and that its speed was stronger in the north-west direction, which carried the pollutants downwind towards the south-eastern direction. It can be also seen that the highest concentration values were centralized in the south-eastern direction of the cement plant, confirming that the prevalent wind direction (north-west) obviously affects the dispersion of pollutants. Our results are also in accordance with a previous study conducted to predict the SO2 pollutants in an urban area using the AERMOD model, which found that their distributions were significantly affected by the predominant wind direction.31 The concentrations of the PTEs in the north-eastern and south-western direction are lower than the background value, which can be attributed to the fact that the wind from the north-eastern and south-western directions is not strong and there are many high buildings in these two directions, blocking the dispersion of the pollutants. Moreover, the wind velocity can also affect the dispersion of the pollutants, which was proven by a previous study,43 which showed that the peak concentration of pollutants can move further away from the source with an increase in wind speed. Besides, the peak concentration shape followed a Gaussian distribution in a high speed wind case compared to that in the low speed wind case, which is also in accordance with our study. The wind speed is high in the studied area and our results showed that the pollutant dispersion can well follow a Gaussian distribution.
| Description | Height [m] | Diameter [m] | Gas temp. [°C] | Gas speed [m s−1] | Cu [kg h−1] | Ni [kg h−1] | Cr [kg h−1] | As [kg h−1] | Pb [kg h−1] | Cd [kg h−1] |
|---|---|---|---|---|---|---|---|---|---|---|
| Stack 1 | 40 | 3 | 65.2 | 5.5 | 0.1 | 1 | 0 | 0.05 | 0.11 | 0.004 |
| Stack 2 | 110 | 3.3 | 138.3 | 23.0 | 0 | 15 | 0 | 0.70 | 0.20 | 0.001 |
| Stack 3 | 40 | 3.3 | 95.0 | 16.8 | 0.08 | 10 | 0.06 | 0.07 | 0.16 | 0.002 |
| Stack 4 | 100 | 3.5 | 160.0 | 28.3 | 0.06 | 8 | 0.02 | 0.09 | 0.05 | 0.003 |
The particle size of the PM that PTEs are adsorbed on can also effectively affect the distributions of PTEs. It can be seen from Table 2 that Ni and Cr tend to adhere to coarser particles compared to As, Cd, Co, and Pb. Therefore, Ni and Cr can deposit farther than the other elements (Fig. 5). Furthermore, the highest concentration values of most PTEs tend to centralize at a distance in the range of 400 to 800 m away from the cement plant. These results are in accordance with our previous study, in which we measured the concentrations of PTEs in the soil near a cement plant within 2 km.44 In the case of other important pollutants, PCDD/Fs and PAHs have also received considerable attention from the public.45,46 The distribution maps of PCDD/Fs and PAHs are shown in Fig. 6. It can be observed that the distribution patterns of PCDD/Fs and PAHs were similar to PTEs, indicating that the distribution of organic pollutants is also significantly influenced by the prevalent winds.
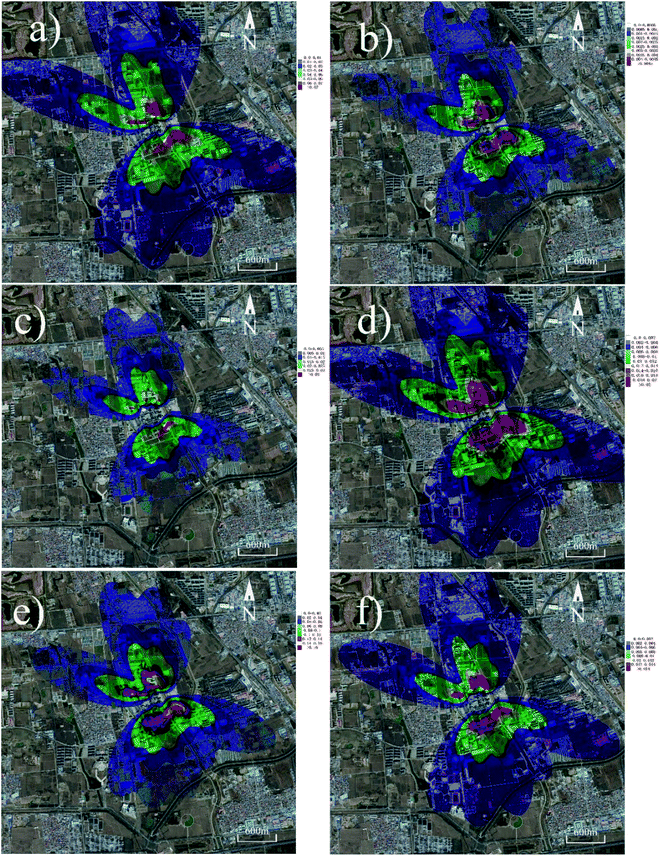 | ||
| Fig. 5 PTE concentration maps (assuming 80% of PTEs as particulate states): (a) As, (b) Cd, (c) Cr, (d) Co, (e) Pb and (f) Ni. | ||
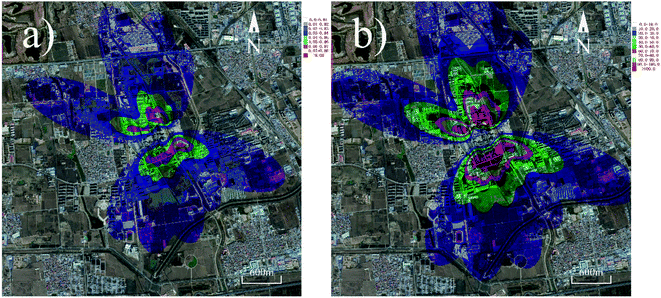 | ||
| Fig. 6 Organic pollutant concentration maps (assuming that 80% of the organics are emitted as particulate states): (a) PCCD/Fs and (b) PAHs. | ||
The highest and average concentrations of pollutants and their corresponding guidelines are shown in Table 4. According to the ambient guidelines, the average and maximum concentration of pollutants were evaluated against the maximum guidelines. As depicted in Table 4, the maximum concentrations of pollutants were 5.0%, 19.3%, 10.1% and 20.0% of the ambient guidelines for Cd, Pb As + Ni and PCCD/Fs, respectively. The average and maximum concentrations of PTEs and organic pollutants were found to be within the limitation regulated by the guidelines. Therefore, the emissions from the cement plant in Beijing are not considered to have a significant risk on the public health. According to the distribution patterns of the pollutants, we can conclude that these pollutants can affect the residential areas near the cement plant. Although the maximum concentrations of pollutants in the air stay within the corresponding regulation, the heath of the habitants nearby still needs to be considered due to the accumulated effect of these pollutants.
| Average | Max | DB 11/503-2007 | |
|---|---|---|---|
| a (%) = percent of the guideline. | |||
| As | 5 | 85 | — |
| Cd | 0.5 (0.5%) | 5 (5%) | 100 |
| Cr | 4 | 33 | — |
| Co | 3 | 25 | — |
| Pb | 20 (2%) | 193 (19.3%) | 1000 |
| As + Ni | 7 (0.7%) | 101 (10.1%) | 1000 |
| PCCD/Fs | 2 × 10⁻⁶ (2%) | 2 × 10⁻⁵ (20%) | 1 × 10⁻⁴ |
| PAHs | 9 × 10⁻⁶ | 9 × 10⁻⁵ | — |
3.4 Validation of AERMOD results
Considering that the concentration of pollutants is a random variable, it must be analyzed statistically.47,48 Besides, the model must be validated before acceptance. Thus, the validation of the AERMOD results was conducted in this section.49,50 The validation of the AERMOD results was used to evaluate the model performance on the prediction of pollutants by comparing the measured data and the simulated data. Fig. 7 shows the scatter plots between the observed and modeled PTE concentration values. It was difficult to achieve totally acceptable PTE validation results considering the variability in the behaviors of these sources (most of them are fugitive types). However, most of the scatter plots in Fig. 7 show that the modeling results satisfy the performance standard, 0.5 ≤ FAC2 ≤ 2, indicating that the validation of the model using the meteorological data is acceptable, and this model can be applied to assess the air quality in the study area. It is also worth mentioning that although most of the simulated results are in good agreement with the observed results, some points still show slight differences, which can be attributed to the contribution of other emission sources in the area, such as transportation or mobile sources.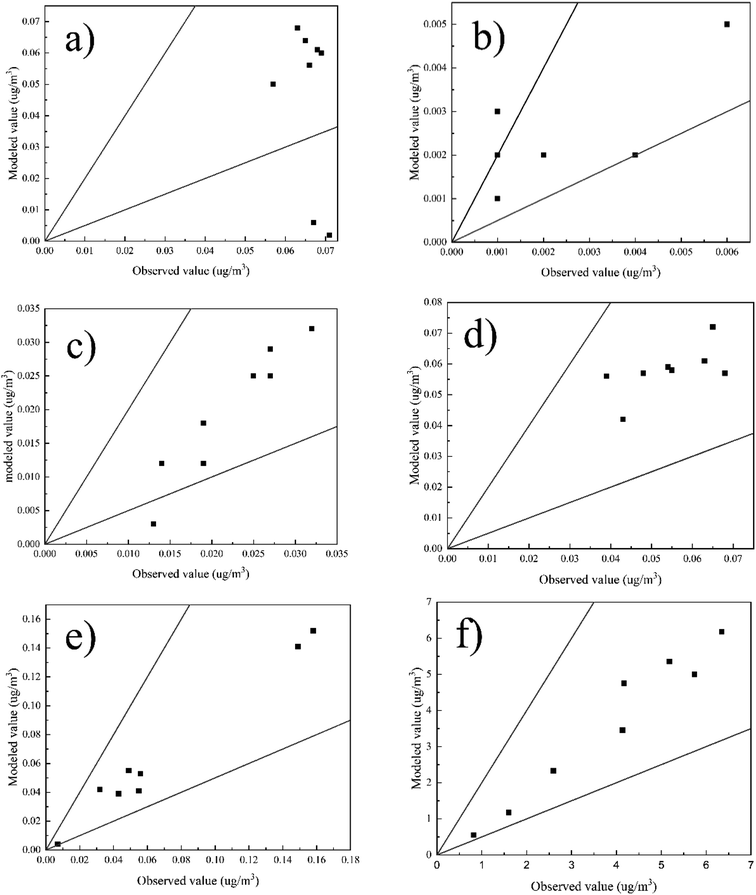 | ||
| Fig. 7 Scatter plots of the observed and modeled PTE concentration for the cement plant: (a) As, (b) Cd, (c) Cr, (d) Co, (e) Pb and (f) Ni. | ||
3.5 Uncertainty analysis
Due to the inadequacy of the input data (e.g., meteorological conditions, emissions, terrain, and land use) and the difficulty in parameterizing the dispersion of pollutants, the models can generate discrepant results. A previous study showed that even small uncertainties in the measurements used for model input can result in large uncertainties in model predictions, and that these uncertainties can be estimated via an error propagation formula when certain assumptions are met.51 Considering that the accuracy of the input data was within ±10%, it is expected to cause 37–76% uncertainty as the percentage concentration.It should be noted that the emission inventory on a local scale includes plenty of detailed activity data, such as vehicle technology, age in traffic and socio-economic characteristic of the habitants. Thus, the preparation of regional emission inventories has various uncertainties. In this study, detailed industrial data for the cement plant was easily extracted, whereas spatial distribution of fuel consumption data in the residential areas and traffic data could hardly be obtained due to the lack of data, which may cause the modeling predictions to differ from reality.
4. Conclusion
This study investigated the full life-cycle of pollutants in a cement plant that co-processes HW, not only the partitioning behaviors of the PTEs in the cement kiln, but also the spatial distributions of PTEs and organics around the cement plant. Our results showed that the distributions of the pollutants are strongly influenced by the prevalent wind direction and the particulate size they adhered to. Most pollutants tend to accumulate at a distance of 400 to 800 m away from the cement plant. The ground-level concentrations of pollutants are well within the ambient air quality guidelines. Therefore, the emission of the pollutants from the cement plant in Beijing is not considered to have a significant risk on the public health. Finally, the validated results showed good agreement between the simulated and observed concentrations of the PTEs in our study, confirming that this model can well predict the emissions and the distribution of pollutants from the cement plant for co-processing HW.This study was an attempt to gain a better understanding of effects from cement plants that co-process HW on the nature of air pollution. Evidently, the findings of this study can facilitate and assist local government authorities and policy makers with managing the ambient air quality. In fact, this model considers multiple meteorological conditions and the emission factors of the stacks. Therefore, it may help policy makers and public authorities to propose different solutions to different environmental scenarios and improve government capability through the implementation of air quality policies. This study can be extended to similar industrial areas. Although uncertainty of the output data exists due to the lack of input data, this preliminary study well explained the contribution of the cement plant co-processing HW to the air quality levels in the studied region. It may also provide a significant reference for future studies in this region, e.g., site selection of possible air quality monitoring stations, preparation of emission inventories for different pollutants types and source categories, and the application of different models.
Conflicts of interest
There are no conflicts to declare.References
- J. Liu, X. Jiang and X. Han, J. Hazard. Mater., 2011, 185, 1205–1213 CrossRef CAS PubMed.
- C. H. K. Lam, J. P. Barford and G. Mckay, Clean Technol. Environ. Policy, 2011, 13, 607–615 CrossRef CAS.
- B. Nakomcic-Smaragdakis, Z. Cepic, N. Senk, J. Doric and L. Radovanovic, Energy Sources, 2016, 38, 485–493 CrossRef CAS.
- A. A. Usón, A. M. López-Sabirón, G. Ferreira and E. L. Sastresa, Renewable Sustainable Energy Rev., 2013, 23, 242–260 CrossRef.
- A. G. Guimarães, P. Vaz-Fernandes, M. R. Ramos and A. P. Martinho, J. Cleaner Prod., 2018, 186, 313–324 CrossRef.
- Y. Li, J. Li, S. Chen and W. Diao, Environ. Pollut., 2012, 165, 77–90 CrossRef CAS PubMed.
- S. Buchner, L. Brillson and E. Burstein, Sci. Total Environ., 2013, 447, 361–369 CrossRef PubMed.
- Z. Xiao, X. Yuan, H. Li, L. Jiang, L. Leng, X. Chen, G. Zeng, F. Li and L. Cao, Sci. Total Environ., 2015, 536, 774–783 CrossRef CAS PubMed.
- M. B. Folgueras, M. Alonso and R. M. Díaz, Energy, 2013, 55, 426–435 CrossRef CAS.
- T. Murakami, Y. Suzuki, H. Nagasawa, T. Yamamoto, T. Koseki, H. Hirose and S. Okamoto, Fuel Process. Technol., 2009, 90, 778–783 CrossRef CAS.
- H. B. Zhou, C. Ma, D. Gao, T. B. Chen, G. D. Zheng, J. Chen and T. H. Pan, Bioresour. Technol., 2014, 152, 329–336 CrossRef CAS PubMed.
- A. S. K. A. Alawi, M. Mohammed, A. A. O. S. Baghabra, T. A. Saleh and S. Mohammed, Sci. Rep., 2018, 8, 11443 CrossRef PubMed.
- J. O. Ogunbileje, V. M. Sadagoparamanujam, J. I. Anetor, E. O. Farombi, O. M. Akinosun and A. O. Okorodudu, Chemosphere, 2013, 90, 2743–2749 CrossRef CAS PubMed.
- W. P. Linak, J. I. Yoo, S. J. Wasson, W. Zhu, J. O. L. Wendt, F. E. Huggins, Y. Chen, N. Shah, G. P. Huffman and M. I. Gilmour, Proc. Combust. Inst., 2007, 31, 1929–1937 CrossRef.
- A. Dietz, H. Ramroth, T. Urban, W. Ahrens and H. Becher, Int. J. Cancer, 2004, 108, 907 CrossRef CAS PubMed.
- G. Smailyte, J. Kurtinaitis and A. Andersen, Occup. Environ. Med., 2004, 61, 529–534 CrossRef CAS PubMed.
- J. A. Conesa, L. Rey, S. Egea and M. D. Rey, Environ. Sci. Technol., 2011, 45, 5878–5884 CrossRef CAS PubMed.
- Y. Li, C. Tong, Z. Jiang, W. Meng, Y. Mi, H. Wang and X. Li, Waste Manage., 2015, 36, 130–135 CrossRef CAS PubMed.
- M. Schuhmacher, A. Bocio, M. C. Agramunt, J. L. Domingo and H. A. de Kok, Chemosphere, 2002, 48, 209–217 CrossRef CAS PubMed.
- M. Ames, S. Zemba, L. Green, M. J. Botelho, D. Gossman, I. Linkov and J. Palmaoliveira, Sci. Total Environ., 2012, 419, 37–43 CrossRef CAS PubMed.
- T. Chen, Y. Guo, X. Li, S. Lu and J. Yan, Environ. Sci. Pollut. Res., 2014, 21, 4245–4253 CrossRef CAS PubMed.
- K. H. Karstensen, Chemosphere, 2008, 70, 543–560 CrossRef CAS PubMed.
- I. O. Alade, M. A. Abd Rahman and T. A. Saleh, Sol. Energy, 2019, 183, 74–82 CrossRef CAS.
- H. A. Al-Jamimi, A. Bagudu and T. A. Saleh, J. Mol. Liq., 2019, 278, 376–384 CrossRef CAS.
- I. O. Alade, M. A. A. Rahman and T. A. Saleh, Nano-Struct. Nano-Objects, 2019, 17, 103–111 CrossRef CAS.
- H. A. Al-Jamimi and T. A. Saleh, J. Cleaner Prod., 2019, 231, 1079–1088 CrossRef CAS.
- I. O. Alade, M. A. Abd Rahman, A. Bagudu, Z. Abbas, Y. Yaakob and T. A. Saleh, Heliyon, 2019, 5, e01882 CrossRef PubMed.
- H. Yu and J. Thé, J. Air Waste Manage., 2017, 67, 517–537 CrossRef CAS PubMed.
- H. Wang, W. Jiao, R. Lahdelma, P. Zou and S. Zhan, Building and Environment, 2013, 64, 200–212 CrossRef.
- M. M. Mokhtar, M. H. Hassim and R. M. Taib, Process Saf. Environ. Prot., 2014, 92, 476–485 CrossRef CAS.
- B. Zou, F. B. Zhan, J. G. Wilson and Y. Zeng, Simul. Model. Pract. Theory, 2010, 18, 612–623 CrossRef.
- M. Abu-Allaban, Aerosol Air Qual. Res., 2011, 11, 802–810 CrossRef CAS.
- K. E. Kakosimos, M. J. Assael and A. S. Katsarou, Environ. Technol., 2011, 32, 593–608 CrossRef CAS PubMed.
- M. N. Neshuku, Air Dispersion Modeling, 2012 Search PubMed.
- D. Tartakovsky, D. M. Broday and E. Stern, Environ. Pollut., 2013, 179, 138–145 CrossRef CAS PubMed.
- K. Seangkiatiyuth, V. Surapipith, K. Tantrakarnapa and A. W. Lothongkum, J. Environ. Sci., 2011, 23, 931–940 CrossRef CAS.
- Z. Yang, S. Tang, Z. Zhang, C. Liu and X. Ge, J. Cleaner Prod., 2018, 186, 831–839 CrossRef CAS.
- L. Hoinaski, D. Franco and H. D. M. Lisboa, Environ. Technol. Lett., 2016, 38, 639–651 CrossRef PubMed.
- Z. Yang, Y. Chen, Y. Sun, L. Liu, Z. Zhang and X. Ge, Environ. Sci. Pollut. Res. Int., 2016, 23, 13943–13953 CrossRef CAS PubMed.
- M. Schuhmacher, M. Nadal and J. L. Domingo, Chemosphere, 2009, 74, 1502–1508 CrossRef CAS PubMed.
- M. R. Chao, C. W. Hu, H. W. Ma, G. P. Chang-Chien, W. J. Lee, L. W. Chang and K. Y. Wu, Atmos. Environ., 2003, 37, 4945–4954 CrossRef CAS.
- A. Afzali, M. Rashid, M. Afzali and V. Younesi, J. Cleaner Prod., 2017, 166, 1215–1225 CrossRef.
- M. Rezaali and R. Fouladi-Fard, J. Environ. Health Sci. Eng., 2021, 1–9 Search PubMed.
- Z. Yang, Y. Chen, Y. Sun, L. Liu, Z. Zhang and X. Ge, Environ. Sci. Pollut. Res., 2016, 23, 1–11 CrossRef PubMed.
- J. L. Domingo, J. Rovira, M. Nadal and M. Schuhmacher, Sci. Total Environ., 2017, 63, 607–608 Search PubMed.
- C. A. Menzie, B. B. Potocki and J. Santodonato, Environ. Sci. Technol., 1992, 26, 1278–1284 CrossRef CAS.
- G. T. Csanady, Turbulent Diffusion in the Environment, D. Reidel Pub. Co., 1973, pp. 159–176 Search PubMed.
- W. S. Lewellen and R. I. Sykes, J. Atmos. Ocean. Technol., 1989, 6, 759–768 CrossRef.
- J. C. Chang and S. R. Hanna, Meteorol. Atmos. Phys., 2004, 87, 167–196 CrossRef.
- A. Kumar, S. Dixit, C. Varadarajan, A. Vijayan and A. Masuraha, Environ. Prog., 2010, 25, 141–151 CrossRef.
- D. L. Freeman, R. T. Egami, N. F. Robinson and J. G. Watson, J. Air Pollut. Control Assoc., 1986, 36, 246–253 CrossRef.
Footnote |
| † Electronic supplementary information (ESI) available. See DOI: 10.1039/d0ra10585f |
| This journal is © The Royal Society of Chemistry 2021 |

