 Open Access Article
Creative Commons Attribution 3.0 Unported Licence
Co3O4 composite nano-fibers doped with Mn4+ prepared by the electro-spinning method and their electrochemical properties
Dasong Peng
,
Lianwei Duan
 *,
Xiaodong Wang
* and
Yanchao Ren
67th Floor, Building B, Fangyuan Building, No. 9 Ping'an Road, Luojiang District, Quanzhou City, Fujian Province, China. E-mail: duanlianwei91@163.com
First published on 8th July 2021
Abstract
In this work, based on the electrospinning method, pure Co3O4, pure MnO2, and Co3O4 composite nano-fiber materials doped with different ratios of Mn4+ were prepared. XRD, XPS, BET and SEM tests were used to characterize the composition, structure and morphology of the materials. An electrochemical workstation was used to test the electrochemical performance of the materials. The results showed that the material properties had greatly improved on doping Mn4+ in Co3O4 nano-fibers. The relationship between the amount of Mn4+ doped in the Co3O4 composite nano-fiber material and its electrochemical performance was also tested and is discussed in this report. The results show that when nCo![[thin space (1/6-em)]](https://www.rsc.org/images/entities/char_2009.gif) :
:![[thin space (1/6-em)]](https://www.rsc.org/images/entities/char_2009.gif) nMn = 20
nMn = 20![[thin space (1/6-em)]](https://www.rsc.org/images/entities/char_2009.gif) :
:![[thin space (1/6-em)]](https://www.rsc.org/images/entities/char_2009.gif) 2, the Co3O4 composite nano-fiber material had a specific surface area of 68 m2 g−1. Under the current density of 1 A g−1, the 20
2, the Co3O4 composite nano-fiber material had a specific surface area of 68 m2 g−1. Under the current density of 1 A g−1, the 20![[thin space (1/6-em)]](https://www.rsc.org/images/entities/char_2009.gif) :
:![[thin space (1/6-em)]](https://www.rsc.org/images/entities/char_2009.gif) 2 sample had the maximum capacitance of 585 F g−1, which was obviously larger than that of pure Co3O4 nano-fibers (416 F g−1). After 2000 cycles of charging/discharging, the specific capacitance of the 20
2 sample had the maximum capacitance of 585 F g−1, which was obviously larger than that of pure Co3O4 nano-fibers (416 F g−1). After 2000 cycles of charging/discharging, the specific capacitance of the 20![[thin space (1/6-em)]](https://www.rsc.org/images/entities/char_2009.gif) :
:![[thin space (1/6-em)]](https://www.rsc.org/images/entities/char_2009.gif) 2 sample was 85.9%, while that of the pure Co3O4 nano-fiber material was only 76.4%. The mechanism of performance improvement in the composite fibers was analyzed, which demonstrated concrete results.
2 sample was 85.9%, while that of the pure Co3O4 nano-fiber material was only 76.4%. The mechanism of performance improvement in the composite fibers was analyzed, which demonstrated concrete results.
Dasong Peng earned his PH.D. degree (in 2010) in the Institute of Microelectronics at Chinese Academy of Sciences, Beijing. In 2021, He joined the Quanzhou Yunjian measurement control and perception Technology Innovation Research Institute as a full fellow and the director of the institute. |
Lianwei Duan earned his Master's degree (in 2017) in China University of Mining and Technology. In 2021, He joined the Quanzhou Yunjian measurement control and perception Technology Innovation Research Institute as R & D Engineer. |
Xiaodong Wang earned his Master's degree (in 2014) in Beijing University of Chemical Technology. In 2021, He joined the Quanzhou Yunjian measurement control and perception Technology Innovation Research Institute as R & D Engineer. |
Yanchao Ren earned his Master's degree (in 2012) in National Defense University of science and technology. He joined the Quanzhou Yunjian measurement control and perception Technology Innovation Research Institute as a full fellow in 2020. |
1. Introduction
Many investigations have been done to find clean and sustainable energy due to the global energy crisis and the aggravation of environmental pollution caused by the excessive use of fossil fuels.1 In many energy storage and conversion systems, supercapacitors are widely used and considered one of the most promising energy storage devices as they have the advantages of fast charging and discharging speed, high power density and long cycle stability. According to the charge storage mechanism, supercapacitors can be divided into two types: one is pseudocapacitors with redox reaction electrode materials, and the other is double-layer electric supercapacitors with carbon-based electrode materials. Electrode materials are the key components of supercapacitors. Their specific surface area, electrochemical activity and stability will directly affect the capacitance, rate performance and cycling stability, which determine their prospects in practical applications. The methods used to prepare active nano filament electrodes, such as interfacial polymerization,2 chemical vapor deposition,3 sol–gel method,4 and hydrothermal method have many disadvantages, such as complicated operation, low yield, high cost and difficulty in avoiding the agglomeration of nanoparticles. Electrospinning can avoid the above problems and simplify the fabrication process. It can also be used to prepare nano-fiber materials with a long one-dimensional nanostructural aspect ratio, which can increase the contact area between the electrode and the electrolyte and shorten the electron and ion transport paths, which are conducive to improve the capacitance performance of the electrode. During the charging/discharging process, pseudocapacitor electrode materials undergo volume expansion. A good mesoporous structure can prevent the structural instability caused by material expansion and impart high electric capacity, high rate performance, high energy density and excellent cycle stability in supercapacitors.A series of studies have been performed to prepare metal oxide nano-fiber materials with various morphologies for use as capacitance electrodes, including the Co3O4 capacitance electrodes with the morphologies of nano-meter-scale flakes,5 three-dimensional cage,6 and lamellae flowers,7 as well as the MnO2 capacitance electrode that had the following morphologies: flower-like,8 porous,9 and hollow nest.10 However, monometallic oxide electrode materials have the drawbacks of poor structural stability and low specific capacitance capacity. To solve these problems, some new works compounded a variety of transition metal oxides together in order to enhance the structural stability of the materials, increase the ion-embedding/injection channels and efficiency, and generate the impurity band effect to improve the redox reaction efficiency of the electro-active substances.11–13 Huang et al.14 prepared the Co3O4/NiO/MnO2 ternary composite electrode material. They found that when the current density was 0.5 A g−1 and wCo3O4![[thin space (1/6-em)]](https://www.rsc.org/images/entities/char_2009.gif) :
:![[thin space (1/6-em)]](https://www.rsc.org/images/entities/char_2009.gif) wNiO
wNiO![[thin space (1/6-em)]](https://www.rsc.org/images/entities/char_2009.gif) :
:![[thin space (1/6-em)]](https://www.rsc.org/images/entities/char_2009.gif) wMnO2 was 3
wMnO2 was 3![[thin space (1/6-em)]](https://www.rsc.org/images/entities/char_2009.gif) :
:![[thin space (1/6-em)]](https://www.rsc.org/images/entities/char_2009.gif) 3
3![[thin space (1/6-em)]](https://www.rsc.org/images/entities/char_2009.gif) :
:![[thin space (1/6-em)]](https://www.rsc.org/images/entities/char_2009.gif) 22, the specific capacitance capacity could reach 549 F g−1. Cheng et al.15 prepared a Co3O4/MnO2 electrode nanomaterial by a solvothermal method (core–shell grown on the surface of nickel foam). When the current density was 0.2 A g−1, the specific capacitance could reach 560 F g−1. However, this method has the drawback of a complex preparation process.
22, the specific capacitance capacity could reach 549 F g−1. Cheng et al.15 prepared a Co3O4/MnO2 electrode nanomaterial by a solvothermal method (core–shell grown on the surface of nickel foam). When the current density was 0.2 A g−1, the specific capacitance could reach 560 F g−1. However, this method has the drawback of a complex preparation process.
In this study, Mn4+-doped Co3O4 composite nanofibers were prepared by the electrospinning method, and their characteristics and electrochemical properties were tested. The results showed that the Co3O4 composite nano-fibers doped with Mn4+ possessed enhanced cycling charging/discharging stability as an electrode material. That is, after looping for 2000 cycles, the capacitance retention rate of pure Co3O4 was 76.4%, whereas the capacitance retention rate of the Co3O4 composite nano-fiber material doped with Mn4+ was 85.9%. The specific surface area of the hollow composite nano-fiber material was 68 m2 g−1, which provided a large number of activation sites for the electrochemical reaction. A hollow structure improves the utilization ratio of the material. When the current density was 1 A g−1, the discharging specific capacitance capacity reached 585 F g−1.
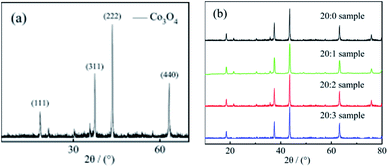
This report is organized as follows: in Section 2, Experimental methods, we have first explained the sample preparation process. Then, we have described the equipment used to test and characterize the structure, morphology and composition of the samples. Finally, the working electrode sample preparation and the electrochemical performance of the samples are shown. In Section 3, Results and discussion, we analyze and discuss test results in four parts. In the first part, the sample morphology and composition were analyzed by four methods: (1) XRD analysis of samples, (2) XPS analysis of samples, (3) the SEM and TEM analysis of samples, (4) the analysis of the specific surface area and the ratio of pores. In the second part, the electrochemical performances of tested samples are shown. In the third, the theoretical analyses of the electrochemical performances are shown. In the fourth, further discussions on the experimental results and analyses are presented. In Section 4, Conclusion, we draw a brief conclusion.
2. Experimental methods
2.1. Sample preparation
The experimental reagents used to prepare the samples were:(1) HCON(CH3)2, it is abbreviated to DMF in the following text.
(2) Co(CH3COO)2·4H2O.
(3) Mn(CH3COO)2·4H2O.
(4) (C6H9NO)n, it is abbreviated to PVP in the following text.
The experimental steps used to prepare the samples were:
Step 1: 1 g Co(CH3COO)2·4H2O and 0.098 g Mn(CH3COO)2·4H2O were added to 15 mL DMF and mixed using a magnetic stirrer for 4 hours.
Step 2: 2.2 g PVP was added into the above mixture and stirred for 4 hours. Thus, the precursor of the sample was prepared.
Step 3: The precursor of the sample was into a 5 mL syringe with a needle of inner diameter 0.5 mm for wire spraying. The electrospinning apparatus used was LSP01-2A, and its static voltage was set as 15 kV; the distance between the plates was set as 20 cm.
Step 4: The spun samples were placed in a bake oven and dried for 24 hours. After that, they were placed in a sintering furnace. The temperature was increased to 600 °C at the rate of 4 °C min−1. The samples were maintained at 600 °C for 3 hours and cooled to room temperature naturally. After that, the nCo![[thin space (1/6-em)]](https://www.rsc.org/images/entities/char_2009.gif) :
:![[thin space (1/6-em)]](https://www.rsc.org/images/entities/char_2009.gif) nMn = 20
nMn = 20![[thin space (1/6-em)]](https://www.rsc.org/images/entities/char_2009.gif) :
:![[thin space (1/6-em)]](https://www.rsc.org/images/entities/char_2009.gif) 2 Co3O4 composite nano-fiber material was obtained and marked as the “20
2 Co3O4 composite nano-fiber material was obtained and marked as the “20![[thin space (1/6-em)]](https://www.rsc.org/images/entities/char_2009.gif) :
:![[thin space (1/6-em)]](https://www.rsc.org/images/entities/char_2009.gif) 2 sample”.
2 sample”.
By repeating the above steps with different mass ratios of Co(CH3COO)2·4H2O and Mn(CH3COO)2·4H2O, we prepared the nCo![[thin space (1/6-em)]](https://www.rsc.org/images/entities/char_2009.gif) :
:![[thin space (1/6-em)]](https://www.rsc.org/images/entities/char_2009.gif) nMn = 20
nMn = 20![[thin space (1/6-em)]](https://www.rsc.org/images/entities/char_2009.gif) :
:![[thin space (1/6-em)]](https://www.rsc.org/images/entities/char_2009.gif) 1 Co3O4 composite nano-fiber material (marked as 20
1 Co3O4 composite nano-fiber material (marked as 20![[thin space (1/6-em)]](https://www.rsc.org/images/entities/char_2009.gif) :
:![[thin space (1/6-em)]](https://www.rsc.org/images/entities/char_2009.gif) 1 sample) and nCo
1 sample) and nCo![[thin space (1/6-em)]](https://www.rsc.org/images/entities/char_2009.gif) :
:![[thin space (1/6-em)]](https://www.rsc.org/images/entities/char_2009.gif) nMn = 20
nMn = 20![[thin space (1/6-em)]](https://www.rsc.org/images/entities/char_2009.gif) :
:![[thin space (1/6-em)]](https://www.rsc.org/images/entities/char_2009.gif) 3 Co3O4 composite nano-fiber material (marked as 20
3 Co3O4 composite nano-fiber material (marked as 20![[thin space (1/6-em)]](https://www.rsc.org/images/entities/char_2009.gif) :
:![[thin space (1/6-em)]](https://www.rsc.org/images/entities/char_2009.gif) 3 sample). Meanwhile, pure Co3O4 and MnO2 nano-fiber materials without doping were also prepared, respectively.
3 sample). Meanwhile, pure Co3O4 and MnO2 nano-fiber materials without doping were also prepared, respectively.
2.2. Structure, morphology and composition of the samples
The equipment used to characterize the structure, morphology and composition were:(1) A Bruker D8-Advance X-ray diffractometer (XRD) was used to test the phase composition of the samples. For the experiments, we selected the anode Cu target Kα radiation with an X-ray tube voltage of 40 kV and a tube current of 30 mA (Cu target, Kα radiation), and the scanning range (2θ) was 5°–80°.
(2) A SAM-800 photoelectron spectrometer (XPS, SAM-800) was used to analyze the surface of the samples. The electron binding energy was corrected by the C 1s peak (284.6 eV) of carbon.
(3) JSM-IT300 scanning electron microscope (accelerating voltage: 20 kV) and JEM-201 transmission electron microscope (accelerating voltage: 200 kV) were used to observe the sample morphology.
(4) A F-Sorb2400 BET instrument was used to measure the specific surface area and porosity of the samples.
2.3. Sample preparation and the electrochemical performance test
![[thin space (1/6-em)]](https://www.rsc.org/images/entities/char_2009.gif) :
:![[thin space (1/6-em)]](https://www.rsc.org/images/entities/char_2009.gif) mblack carbon
mblack carbon![[thin space (1/6-em)]](https://www.rsc.org/images/entities/char_2009.gif) :
:![[thin space (1/6-em)]](https://www.rsc.org/images/entities/char_2009.gif) mpolyfluoroethylene = 8
mpolyfluoroethylene = 8![[thin space (1/6-em)]](https://www.rsc.org/images/entities/char_2009.gif) :
:![[thin space (1/6-em)]](https://www.rsc.org/images/entities/char_2009.gif) 1
1![[thin space (1/6-em)]](https://www.rsc.org/images/entities/char_2009.gif) :
:![[thin space (1/6-em)]](https://www.rsc.org/images/entities/char_2009.gif) 1 (w/w), and some ethanol was added into the mixture to make a slurry. (2) The slurry was coated on nickel uniformly. (3) The nickel samples were dried in a vacuum at 100 °C for 6 hours. Then, the working electrode was prepared by pressing the tablet at a pressure of 6 MPa. The 20 : 1 sample was used to prepare the electrode and marked as the 20 : 1 working electrode. The 20 : 2 sample was used to prepare the electrode and mark the 20 : 2 working electrode. The 20 : 3 sample was used to prepare the electrode and mark the 20 : 3 working electrode. The working electrode prepared using the pure Co3O4 sample nano-fiber material was marked as the pure Co3O4 working electrode and that using pure MnO2 was marked as the MnO2 working electrode.
1 (w/w), and some ethanol was added into the mixture to make a slurry. (2) The slurry was coated on nickel uniformly. (3) The nickel samples were dried in a vacuum at 100 °C for 6 hours. Then, the working electrode was prepared by pressing the tablet at a pressure of 6 MPa. The 20 : 1 sample was used to prepare the electrode and marked as the 20 : 1 working electrode. The 20 : 2 sample was used to prepare the electrode and mark the 20 : 2 working electrode. The 20 : 3 sample was used to prepare the electrode and mark the 20 : 3 working electrode. The working electrode prepared using the pure Co3O4 sample nano-fiber material was marked as the pure Co3O4 working electrode and that using pure MnO2 was marked as the MnO2 working electrode.3. Results and Discussion
3.1. Sample morphology and composition
![[thin space (1/6-em)]](https://www.rsc.org/images/entities/char_2009.gif) :
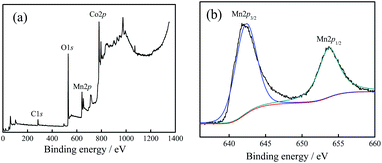
:![[thin space (1/6-em)]](https://www.rsc.org/images/entities/char_2009.gif) 2 sample was characterized in an XPS analyzer. The results are shown in Fig. 2. The binding energy of the sample was calibrated with C 1s (284.8 eV).
2 sample was characterized in an XPS analyzer. The results are shown in Fig. 2. The binding energy of the sample was calibrated with C 1s (284.8 eV).
Fig. 2(a) shows the full spectrum analysis data, corresponding to the binding energy peaks of Co, Mn, O, C. Their proportions (n/n) were 16.73% (Co), 10.85% (Mn), 52.46% (O), 17.09% (C), respectively. The results showed that (1) the sample contained the elements Co, Mn, and O. (2) The proportion of Mn atoms was in accordance with the actually added proportion. (3) The content of Co atoms was relatively low, which was caused by the substitution of Co atoms with Mn atoms on the surface.
Fig. 2(b) shows the high-resolution XPS spectrum result of Mn. From the result, it could be inferred that: (1) the peak values for Mn 2p3/2 (642.2 eV) and Mn 2p1/2 (653.8 eV) were corresponding to the binding energy peaks of the Mn element in the Mn–O bond, showing the valence state of Mn4+.17,18 This proved that the combination of Mn4+ and Co3O4 nano-fibers was successfully achieved by the electrospinning method. (2) Based on the XRD test results together with the XPS characterization results, it could be judged that Mn4+ did not enter the crystal lattice of cobalt oxide in the composite nano-fibers, and it existed only at the interface of the nano-fiber surface and the crystal boundary. The Mn atoms replaced some of the Co atoms; one Mn4+ replaced two Co2+ atoms, and the Mn atoms combine with O atoms to form the structure of O–Mn–O. (3) In fact, the XPS characterization results revealed that the Mn atoms accounted for 10.85% (n/n), which replaced 2 × 10.85% = 21.7% Co atoms. Considering that 16.73% Co atoms still existed near the surface, the ratio nCo/nO = (21.7% + 16.73%)/52.46% = 0.733, which was very close to the Co/O atom ratio of Co3O4 (0.75). This data supports the judgement that at the interface, Mn4+ substitutes some of Co2+, reacts with O2−, and forms the O–Mn–O structure.
![[thin space (1/6-em)]](https://www.rsc.org/images/entities/char_2009.gif) :
:![[thin space (1/6-em)]](https://www.rsc.org/images/entities/char_2009.gif) 1 sample, 20
1 sample, 20![[thin space (1/6-em)]](https://www.rsc.org/images/entities/char_2009.gif) :
:![[thin space (1/6-em)]](https://www.rsc.org/images/entities/char_2009.gif) 2 sample, 20
2 sample, 20![[thin space (1/6-em)]](https://www.rsc.org/images/entities/char_2009.gif) :
:![[thin space (1/6-em)]](https://www.rsc.org/images/entities/char_2009.gif) 3 sample, and pure Co3O4 sample and the TEM image of the 20
3 sample, and pure Co3O4 sample and the TEM image of the 20![[thin space (1/6-em)]](https://www.rsc.org/images/entities/char_2009.gif) :
:![[thin space (1/6-em)]](https://www.rsc.org/images/entities/char_2009.gif) 2 sample. (1) From the SEM images, it could be seen that the lengths of the nanofibers were more than 5 μm, and their sizes were uniform; the diameter range of nanofibers was between 100 to 300 nm, and their length to diameter ratio was more than 30. (2) The surface of the composite nano-fibers was rough, as shown in Fig. 3 (b–d). (3) Fig. 3(e) clearly shows the rough surface of the 20
2 sample. (1) From the SEM images, it could be seen that the lengths of the nanofibers were more than 5 μm, and their sizes were uniform; the diameter range of nanofibers was between 100 to 300 nm, and their length to diameter ratio was more than 30. (2) The surface of the composite nano-fibers was rough, as shown in Fig. 3 (b–d). (3) Fig. 3(e) clearly shows the rough surface of the 20![[thin space (1/6-em)]](https://www.rsc.org/images/entities/char_2009.gif) :
:![[thin space (1/6-em)]](https://www.rsc.org/images/entities/char_2009.gif) 2 composite nano-fibers. The composite nano-fibers were composed of many cobalt oxide nano-particles with irregular morphology, and the size range was between 30 to 50 nm, with good crystallinity. (4) Fig. 3(f) shows the transmission electron microscopy result of the 20
2 composite nano-fibers. The composite nano-fibers were composed of many cobalt oxide nano-particles with irregular morphology, and the size range was between 30 to 50 nm, with good crystallinity. (4) Fig. 3(f) shows the transmission electron microscopy result of the 20![[thin space (1/6-em)]](https://www.rsc.org/images/entities/char_2009.gif) :
:![[thin space (1/6-em)]](https://www.rsc.org/images/entities/char_2009.gif) 2 sample, in which light transmission was not uniform. This indicated that there were pores left by the combustion of organic matter between the particles of the nano-fibers.
2 sample, in which light transmission was not uniform. This indicated that there were pores left by the combustion of organic matter between the particles of the nano-fibers.
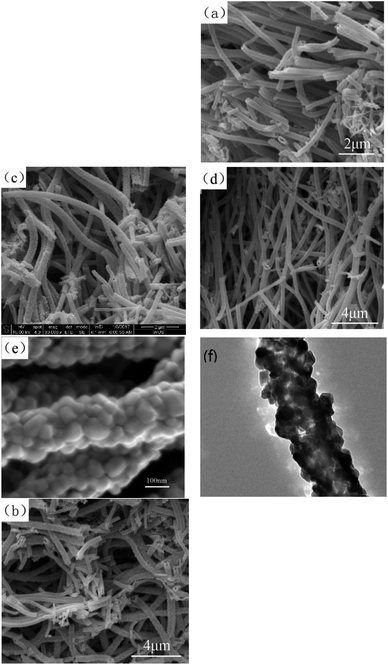 | ||
Fig. 3 (a–c) SEM images of the pure Co3O4 nano-fibers, 20![[thin space (1/6-em)]](https://www.rsc.org/images/entities/char_2009.gif) : :![[thin space (1/6-em)]](https://www.rsc.org/images/entities/char_2009.gif) 1 sample, 20 1 sample, 20![[thin space (1/6-em)]](https://www.rsc.org/images/entities/char_2009.gif) : :![[thin space (1/6-em)]](https://www.rsc.org/images/entities/char_2009.gif) 3 sample, respectively. Fig. 3 (d–f) SEM and TEM images of the 20 3 sample, respectively. Fig. 3 (d–f) SEM and TEM images of the 20![[thin space (1/6-em)]](https://www.rsc.org/images/entities/char_2009.gif) : :![[thin space (1/6-em)]](https://www.rsc.org/images/entities/char_2009.gif) 2 sample. 2 sample. | ||
![[thin space (1/6-em)]](https://www.rsc.org/images/entities/char_2009.gif) :
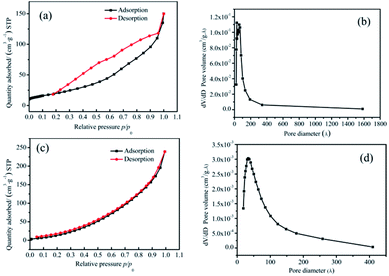
:![[thin space (1/6-em)]](https://www.rsc.org/images/entities/char_2009.gif) 2 samples. The relative pressure p/p0 was taken as the abscissa, where p is the equilibrium pressure of nitrogen, and p0 is the saturated vapor pressure of liquid nitrogen temperature, with the amount of sample adsorption and desorption as the ordinates. From Fig. 4(a) and (c), it could be seen that the interaction between the two groups of samples and the adsorbate was small, and the adsorption amount was less in the low-pressure region. With an increase in the relative pressure, the adsorption capacity also increased, which revealed that the pores were filled. When the p/p0 was less than 0.3, the curves of adsorption and desorption were basically coincident, which indicated that the proportion of micropores (<2 nm) was high. When the relative pressure was high, the adsorption lagged behind the desorption curve, which indicated that there were a certain number of mesopores (2–50 nm) and a small number of macropores (>50 nm).
2 samples. The relative pressure p/p0 was taken as the abscissa, where p is the equilibrium pressure of nitrogen, and p0 is the saturated vapor pressure of liquid nitrogen temperature, with the amount of sample adsorption and desorption as the ordinates. From Fig. 4(a) and (c), it could be seen that the interaction between the two groups of samples and the adsorbate was small, and the adsorption amount was less in the low-pressure region. With an increase in the relative pressure, the adsorption capacity also increased, which revealed that the pores were filled. When the p/p0 was less than 0.3, the curves of adsorption and desorption were basically coincident, which indicated that the proportion of micropores (<2 nm) was high. When the relative pressure was high, the adsorption lagged behind the desorption curve, which indicated that there were a certain number of mesopores (2–50 nm) and a small number of macropores (>50 nm).
An F-Sorb2400 instrument can automatically calculate the specific surface area. The results showed that the specific surface area of the pure Co3O4 sample was 65 m2 g−1 and that of the 20![[thin space (1/6-em)]](https://www.rsc.org/images/entities/char_2009.gif) :
:![[thin space (1/6-em)]](https://www.rsc.org/images/entities/char_2009.gif) 2 sample was 68 m2 g−1. On comparing Fig. 4(b) with Fig. 4(d), it can be seen that the proportion of micropores and mesoporous in the 20
2 sample was 68 m2 g−1. On comparing Fig. 4(b) with Fig. 4(d), it can be seen that the proportion of micropores and mesoporous in the 20![[thin space (1/6-em)]](https://www.rsc.org/images/entities/char_2009.gif) :
:![[thin space (1/6-em)]](https://www.rsc.org/images/entities/char_2009.gif) 2 sample was relatively large. There were no macropores. The pore size distribution of its adsorption scale range was 2–40 nm, and its average size was about 14 nm. The surface of the pure Co3O4 sample was mainly mesoporous, with a small number of macropores. This was attributed to the presence of relevant amorphous structures formed after Mn4+ doping at the crystal interface of Co3O4, which would prevent organic matter from burning and forming large pores, thereby improving the structural stability of the material and bringing about a large specific surface area.
2 sample was relatively large. There were no macropores. The pore size distribution of its adsorption scale range was 2–40 nm, and its average size was about 14 nm. The surface of the pure Co3O4 sample was mainly mesoporous, with a small number of macropores. This was attributed to the presence of relevant amorphous structures formed after Mn4+ doping at the crystal interface of Co3O4, which would prevent organic matter from burning and forming large pores, thereby improving the structural stability of the material and bringing about a large specific surface area.
3.2. The electrochemical performance of the tested samples
The cyclic voltammetry curves of the pure Co3O4 sample and composite nano-fiber samples measured at different scanning rates are shown in Fig. 5. The shapes of the curves revealed that all samples stored energy based on faradaic pseudo-capacitance, showing clear redox peaks. When the scanning rate increased, the peak current intensity increased gradually, while the peak deviation was small. The smaller offset meant better reversibility and the same redox mechanism. On comparing the closed area of their cyclic curves, it could be seen that at the same scanning rate, the 20![[thin space (1/6-em)]](https://www.rsc.org/images/entities/char_2009.gif) :
:![[thin space (1/6-em)]](https://www.rsc.org/images/entities/char_2009.gif) 2 sample had the largest area (see Fig. 5(c)) and the maximum specific capacitance capacity.
2 sample had the largest area (see Fig. 5(c)) and the maximum specific capacitance capacity.
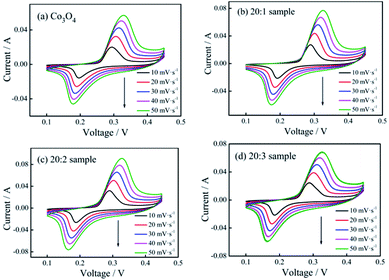 | ||
Fig. 5 CV curves of (a) pure Co3O4 nano-fibers, (b) 20![[thin space (1/6-em)]](https://www.rsc.org/images/entities/char_2009.gif) : :![[thin space (1/6-em)]](https://www.rsc.org/images/entities/char_2009.gif) 1 sample, (c) 20 1 sample, (c) 20![[thin space (1/6-em)]](https://www.rsc.org/images/entities/char_2009.gif) : :![[thin space (1/6-em)]](https://www.rsc.org/images/entities/char_2009.gif) 2 sample, and (d) 20 2 sample, and (d) 20![[thin space (1/6-em)]](https://www.rsc.org/images/entities/char_2009.gif) : :![[thin space (1/6-em)]](https://www.rsc.org/images/entities/char_2009.gif) 3 sample at different scan rates. 3 sample at different scan rates. | ||
Fig. 6 shows the constant current charging/discharging curves of the pure Co3O4 sample, 20![[thin space (1/6-em)]](https://www.rsc.org/images/entities/char_2009.gif) :
:![[thin space (1/6-em)]](https://www.rsc.org/images/entities/char_2009.gif) 1 sample, 20
1 sample, 20![[thin space (1/6-em)]](https://www.rsc.org/images/entities/char_2009.gif) :
:![[thin space (1/6-em)]](https://www.rsc.org/images/entities/char_2009.gif) 2 sample and 20
2 sample and 20![[thin space (1/6-em)]](https://www.rsc.org/images/entities/char_2009.gif) :
:![[thin space (1/6-em)]](https://www.rsc.org/images/entities/char_2009.gif) 3 sample under different current densities.
3 sample under different current densities.
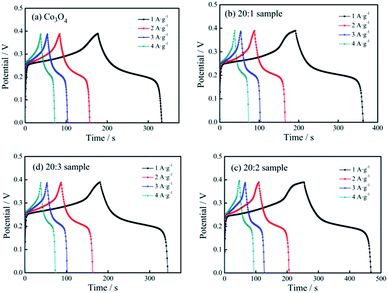 | ||
Fig. 6 Charging/discharging curves of different electrodes: (a) pure Co3O4 nano-fibers, (b) 20![[thin space (1/6-em)]](https://www.rsc.org/images/entities/char_2009.gif) : :![[thin space (1/6-em)]](https://www.rsc.org/images/entities/char_2009.gif) 1 sample, (c) 20 1 sample, (c) 20![[thin space (1/6-em)]](https://www.rsc.org/images/entities/char_2009.gif) : :![[thin space (1/6-em)]](https://www.rsc.org/images/entities/char_2009.gif) 2 sample, (d) 20 2 sample, (d) 20![[thin space (1/6-em)]](https://www.rsc.org/images/entities/char_2009.gif) : :![[thin space (1/6-em)]](https://www.rsc.org/images/entities/char_2009.gif) 3 sample. 3 sample. | ||
The relationships among C, I, t, m, ΔV can be described by the following equation:19
| C = I × t/(m × ΔV) | (1) |
Based on eqn (1), when the current densities were 1, 2, 3 and 4 A g−1, the specific capacitance capacity values of the pure Co3O4 sample were 416, 393, 386 and 348 F g−1, respectively. The values of the 20![[thin space (1/6-em)]](https://www.rsc.org/images/entities/char_2009.gif) :
:![[thin space (1/6-em)]](https://www.rsc.org/images/entities/char_2009.gif) 1 sample were 454, 414, 384, 364 F g−1, respectively. The values of the 20
1 sample were 454, 414, 384, 364 F g−1, respectively. The values of the 20![[thin space (1/6-em)]](https://www.rsc.org/images/entities/char_2009.gif) :
:![[thin space (1/6-em)]](https://www.rsc.org/images/entities/char_2009.gif) 2 sample were 585, 515, 475, 469 F g−1, respectively, and those of the 20
2 sample were 585, 515, 475, 469 F g−1, respectively, and those of the 20![[thin space (1/6-em)]](https://www.rsc.org/images/entities/char_2009.gif) :
:![[thin space (1/6-em)]](https://www.rsc.org/images/entities/char_2009.gif) 3 sample were 429, 406, 381, 365 F g−1, respectively.
3 sample were 429, 406, 381, 365 F g−1, respectively.
It could be seen that (1) with an increase in the current density, the specific capacitance of the tested samples showed a downward trend, and the extent of decline gradually decreased. (2) Because of Mn4+ doping, the specific capacitance capacity of the samples improved, and the specific capacitance capacity of the 20![[thin space (1/6-em)]](https://www.rsc.org/images/entities/char_2009.gif) :
:![[thin space (1/6-em)]](https://www.rsc.org/images/entities/char_2009.gif) 2 sample showed the most obvious improvement. (3) Under the current density of 1 A g−1, the specific capacitance values of the 4 samples were compared, and the specific capacitance values of the 20
2 sample showed the most obvious improvement. (3) Under the current density of 1 A g−1, the specific capacitance values of the 4 samples were compared, and the specific capacitance values of the 20![[thin space (1/6-em)]](https://www.rsc.org/images/entities/char_2009.gif) :
:![[thin space (1/6-em)]](https://www.rsc.org/images/entities/char_2009.gif) 1 sample, 20
1 sample, 20![[thin space (1/6-em)]](https://www.rsc.org/images/entities/char_2009.gif) :
:![[thin space (1/6-em)]](https://www.rsc.org/images/entities/char_2009.gif) 2 sample and 20
2 sample and 20![[thin space (1/6-em)]](https://www.rsc.org/images/entities/char_2009.gif) :
:![[thin space (1/6-em)]](https://www.rsc.org/images/entities/char_2009.gif) 3 sample were 9.13%, 40.63% and 3.13%, respectively, and higher than that of pure Co3O4.
3 sample were 9.13%, 40.63% and 3.13%, respectively, and higher than that of pure Co3O4.
The cyclic voltammetric curves of the 20![[thin space (1/6-em)]](https://www.rsc.org/images/entities/char_2009.gif) :
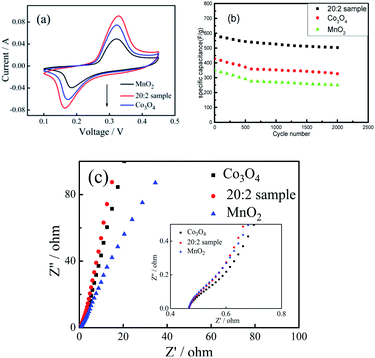
:![[thin space (1/6-em)]](https://www.rsc.org/images/entities/char_2009.gif) 2 sample, pure Co3O4 sample and pure MnO2 sample were compared and analyzed. (1) As shown in Fig. 7(a), at the scanning rate of 50 mV s−1, the cyclic curve area of the 20
2 sample, pure Co3O4 sample and pure MnO2 sample were compared and analyzed. (1) As shown in Fig. 7(a), at the scanning rate of 50 mV s−1, the cyclic curve area of the 20![[thin space (1/6-em)]](https://www.rsc.org/images/entities/char_2009.gif) :
:![[thin space (1/6-em)]](https://www.rsc.org/images/entities/char_2009.gif) 2 sample was obviously larger than that of the pure Co3O4 sample and pure MnO2 sample, and the corresponding area of MnO2 was the smallest. (2) Fig. 7(b) shows the cyclic charging/discharging curves of the 20
2 sample was obviously larger than that of the pure Co3O4 sample and pure MnO2 sample, and the corresponding area of MnO2 was the smallest. (2) Fig. 7(b) shows the cyclic charging/discharging curves of the 20![[thin space (1/6-em)]](https://www.rsc.org/images/entities/char_2009.gif) :
:![[thin space (1/6-em)]](https://www.rsc.org/images/entities/char_2009.gif) 2 sample, pure Co3O4 sample and pure MnO2 sample at 1 A g−1 current density. (3) After 2000 cycles, the capacitance retention rate of the 20
2 sample, pure Co3O4 sample and pure MnO2 sample at 1 A g−1 current density. (3) After 2000 cycles, the capacitance retention rate of the 20![[thin space (1/6-em)]](https://www.rsc.org/images/entities/char_2009.gif) :
:![[thin space (1/6-em)]](https://www.rsc.org/images/entities/char_2009.gif) 2 sample was 85.9% and those of the pure Co3O4 sample and pure MnO2 sample were 76.4% and 71.3%, respectively. It can be seen that the capacitance retention rate of the 20
2 sample was 85.9% and those of the pure Co3O4 sample and pure MnO2 sample were 76.4% and 71.3%, respectively. It can be seen that the capacitance retention rate of the 20![[thin space (1/6-em)]](https://www.rsc.org/images/entities/char_2009.gif) :
:![[thin space (1/6-em)]](https://www.rsc.org/images/entities/char_2009.gif) 2 sample was the highest.
2 sample was the highest.
3.3. Theoretical analysis of the electrochemical performance of the sample
Each Co3O4 molecule contains one Co2+ atom and two Co3+ atoms. As an electroactive substance, the electrode reaction on Co3O4 in 1 mol L−1 KOH alkaline medium20 is:| Co3O4 + H2O + OH− ↔ 3CoOOH + e− | (2) |
During charging/discharging, the corresponding redox reaction process is Co2+ ↔ Co3+ + e−. Here, the Co2+ ion in Co3O4 directly participates in the oxidation–reduction reaction and changes its valence state, which naturally affects the structural stability of Co3O4 and results in its lower specific capacitance capacity. When the Co3O4 nano-fibers are doped with Mn4+, it has been pointed out that at the interface of the cobalt oxide crystal, some Co2+ ions are replaced by Mn4+, and the Mn atoms combine with O atoms to form the O–Mn–O amorphous structure. This structure also participates in the charging/discharging process.21 The reaction can be described as:
| MnO2(O–Mn–O) + K+ + e− ↔ MnOOK | (3) |
In this reaction, the valence state of Mn4+ remains unchanged before and after the reaction. In fact, the cyclic voltammetry curves (see Fig. 5) show that the redox peaks of all the samples were the same, indicating that the redox reaction on the samples doped with Mn4+ was still Co2+ ↔ Co3+ + e, and the Mn4+ ions did not participate in the reaction.
3.4. Further discussions
From the above experimental results and analysis, it can be inferred that doping Co3O4 with Mn4+ can improve the specific capacitance capacity and cycling stability of the composite nanofibers. The reasons can be attributed to the following aspects: (1) The O–Mn–O structure formed by Mn4+ doping directly participates in charging/discharging and maintains the valence state of Mn4+, which promotes the structural stability of the composite materials. (2) Mn4+ only exists at the interface, making the O–Mn–O structure on the grain surface of Co3O4 form an interface protection layer, which can prevent the structural instability caused by the change in the valence state of Co2+. (3) Mn4+ enters the gap between the Co3O4 grains and contributes to the formation of more active defect sites and ion channels in the composite nano-fiber materials, which makes more Co2+ participate in the charging/discharging process and improves the reaction efficiency of the active substance. (4) In addition, as shown in Fig. 7(c), the AC impedance spectra of the 20![[thin space (1/6-em)]](https://www.rsc.org/images/entities/char_2009.gif) :
:![[thin space (1/6-em)]](https://www.rsc.org/images/entities/char_2009.gif) 2 sample, pure Co3O4 sample and pure MnO2 sample were similar. Moreover, the electronic conduction resistance was also similar. However, in the low-frequency region, the slope of the oblique line for the 20
2 sample, pure Co3O4 sample and pure MnO2 sample were similar. Moreover, the electronic conduction resistance was also similar. However, in the low-frequency region, the slope of the oblique line for the 20![[thin space (1/6-em)]](https://www.rsc.org/images/entities/char_2009.gif) :
:![[thin space (1/6-em)]](https://www.rsc.org/images/entities/char_2009.gif) 2 sample was larger than that of the pure Co3O4 and MnO2 samples. This indicates that the ionic diffusion resistance of the composite sample was less than that of the pure oxide sample. This is the direct positive effect of Mn4+ doping. If the amount of Mn4+ doped in the Co3O4 composite nano-fibers is too large, the surplus Mn4+ cannot enter into the O–Mn–O structure, which will weaken the charging/discharging reaction efficiency of the composite. However, if the amount of Mn4+ doped in the Co3O4 nano-fibers is too small, it will not be conducive to fully realizing the effect of Mn4+ doping, that is, to stabilize the structure of Co3O4 and promote the improvement of reaction efficiency.
2 sample was larger than that of the pure Co3O4 and MnO2 samples. This indicates that the ionic diffusion resistance of the composite sample was less than that of the pure oxide sample. This is the direct positive effect of Mn4+ doping. If the amount of Mn4+ doped in the Co3O4 composite nano-fibers is too large, the surplus Mn4+ cannot enter into the O–Mn–O structure, which will weaken the charging/discharging reaction efficiency of the composite. However, if the amount of Mn4+ doped in the Co3O4 nano-fibers is too small, it will not be conducive to fully realizing the effect of Mn4+ doping, that is, to stabilize the structure of Co3O4 and promote the improvement of reaction efficiency.
4. Conclusions
In this work, by the electrospinning method and calcination at 600 °C, three kinds of Mn4+-doped Co3O4 composite nano-fiber samples were prepared. The nCo![[thin space (1/6-em)]](https://www.rsc.org/images/entities/char_2009.gif) :
:![[thin space (1/6-em)]](https://www.rsc.org/images/entities/char_2009.gif) nMn of the three samples were 20
nMn of the three samples were 20![[thin space (1/6-em)]](https://www.rsc.org/images/entities/char_2009.gif) :
:![[thin space (1/6-em)]](https://www.rsc.org/images/entities/char_2009.gif) 1, 20
1, 20![[thin space (1/6-em)]](https://www.rsc.org/images/entities/char_2009.gif) :
:![[thin space (1/6-em)]](https://www.rsc.org/images/entities/char_2009.gif) 2 and 20
2 and 20![[thin space (1/6-em)]](https://www.rsc.org/images/entities/char_2009.gif) :
:![[thin space (1/6-em)]](https://www.rsc.org/images/entities/char_2009.gif) 3, respectively. The nano-fiber materials had a hollow structure. The specific surface area of the 20
3, respectively. The nano-fiber materials had a hollow structure. The specific surface area of the 20![[thin space (1/6-em)]](https://www.rsc.org/images/entities/char_2009.gif) :
:![[thin space (1/6-em)]](https://www.rsc.org/images/entities/char_2009.gif) 2 sample reached 68 m2 g−1. From the pore size distribution curves, it was observed that the proportion of micropores and macropores on the surface of the sample was small, while the proportion of mesopores was large, and the average pore size for adsorption was about 14 nm.
2 sample reached 68 m2 g−1. From the pore size distribution curves, it was observed that the proportion of micropores and macropores on the surface of the sample was small, while the proportion of mesopores was large, and the average pore size for adsorption was about 14 nm.
The electrochemical performance test results showed that the samples had clear redox peaks, among which the 20![[thin space (1/6-em)]](https://www.rsc.org/images/entities/char_2009.gif) :
:![[thin space (1/6-em)]](https://www.rsc.org/images/entities/char_2009.gif) 2 sample had the maximum discharging specific capacitance capacity, and the capacity was 585 F g−1 at the current density of 1 A g−1. After 2000 cycles, the specific capacitance retention rate of the sample was 85.9%, which was obviously better than those of the pure Co3O4 sample and pure MnO2 sample.
2 sample had the maximum discharging specific capacitance capacity, and the capacity was 585 F g−1 at the current density of 1 A g−1. After 2000 cycles, the specific capacitance retention rate of the sample was 85.9%, which was obviously better than those of the pure Co3O4 sample and pure MnO2 sample.
The reasons for the improvement in the electrochemical properties of the composite nano-fiber materials are as follows: (1) the large specific surface area of the hollow composite nano-fibers provides sufficient activation sites for the electrochemical reaction. (2) By substituting Co2+ on the surface, Mn4+ in the composite can form the O–Mn–O bond, which can participate in the charging/discharging process and exists at the Co3O4 interface in the amorphous form to maintain the stability of the crystal structure. (3) The composite nano-fibers with doped Mn4+ produce more ion channels, which are conducive to reducing the ion diffusion resistance.
Subsequently, for our next report, Ni2+-doped Co3O4 composite nano-fibers will be prepared by electrospinning to test their electrochemical properties, and a ternary composite nano-fiber material will be prepared to explore the mechanism of the stable structure.
Conflicts of interest
There are no conflicts to declare.Acknowledgements
The authors gratefully acknowledge the financial support from the Quanzhou Science and Technology Bureau. We also thank the status of the Quanzhou Yunjian Measurement Control and Perception Technology Innovation Research Institute who gave much assistance for the paper's experiment.References
- U. Ahmad, M. S. Akhtar and A. Sadia, et al., Microchem. J., 2020, 160, 105630 Search PubMed.
- F. Zhang, C. Z. Yuan and X. J. Lu, et al., Power Sources, 2012, 203, 250–256 CrossRef CAS.
- G.-Y. Huang, Xu Sheng-Ming and Y. Yang, et al., J. Inorg. Chem., 2016, 32, 1693–1703 CAS.
- S. H. Li, Q. H. Liu and L. Qi, et al., J. Anal. Chem., 2012, 40, 339–346 CAS.
- K. Ding, X. Zhang, P. Yang and X. Cheng, CrystEngComm, 2016, 18, 8253–8261 RSC.
- S. Wang, Q. Li, M. Chen, W. Pu, Y. Wu and M. Yang, Electrochim. Acta, 2016, 215, 473–482 CrossRef CAS.
- X. W. Wang, D. L. Zheng, P. Z. Yang, X. E. Wang, Q. Q. Zhu, P. F. Ma and L. Y. Sun, Chem. Phys. Lett., 2017, 667, 260–266 CrossRef CAS.
- X. Zhou, F. Cao, J. Li, W. Shen and J. Liu, J. Alloys Compd., 2016, 688, 354–361 CrossRef CAS.
- Y. Zhang, Y. Yang, L. Mao, C. Ding, Z. Zhan and J. Xiong, Mater. Lett., 2016, 182, 298–301 CrossRef CAS.
- W. Hong, J. Wang, P. Gong, J. Sun, L. Niu, Z. Yang, Z. Wang and S. Yang, J. Power Sources, 2014, 270, 516–525 CrossRef CAS.
- X. Wang, L. Jia, L. Qi, J. Liu, X. Guo, X. Jing and J. Wang, Colloids Surf., A, 2016, 506, 646–653 CrossRef CAS.
- J. N. Broughton and M. J. Brett, Electrochim. Acta, 2005, 50, 4814–4819 CrossRef CAS.
- L. Su, Yu Wang, Y. Sha and M. Hao, J. Alloys Compd., 2016, 656, 585–589 CrossRef CAS.
- M. Huang, Y. Zhang, F. Li, L. Zhang, Z. Wen and Q. Liu, J. Power Sources, 2014, 252, 98–106 CrossRef CAS.
- H. Cheng, J. Xie, Z. Chen, J. Tu, G. Cao and X. Zhao, Chin. J. Inorg. Chem., 2012, 34, 1173–1182 Search PubMed.
- X. Chen, S. Yan, W. Nan, N. Wang, S. Peng, C. Wang and S. Dai, Mater. Eng., 2019, 47, 18–24 Search PubMed.
- V. H. Nguyen, C. Lamiel and J.-J. Shim, Mater. Lett., 2016, 179, 105–109 CrossRef.
- S.-W. Hwang and S.-H. Hyun, J. Non-Cryst. Solids, 2004, 347, 238–245 CrossRef CAS.
- C. Wang, F. Zhu and G. Wang, et al., Int. J. Mater. Res., 2018, 109, 873–879 CrossRef CAS.
- H. Fang, W. Zou, Z. Zhang and S. Zhang, Battery, 2019, 49, 90–93 Search PubMed.
- C. Jiang, Z. Tang and Z. Zhang, Rare Metal Materials and Engineering, 2018, 47, 45–49 Search PubMed.
| This journal is © The Royal Society of Chemistry 2021 |

